
Global Dessert Mixes Market Size, Share Report By Type (Cake Mixes, Pudding Mixes, Cookie Mixes, Brownie Mixes, Ice Cream Mixes), By Form (Dry Mix, Ready-to-Eat, Liquid Mix, Frozen Mix), By Flavor (Chocolate, Vanilla, Red velvet, Others), By Category (Organic, Conventional), By End Use ( Household, Food Service, Bakeries, Cafes, Others), By Distribution Channel (Hypermarkets/Supermarkets, Convenience Stores, Online Retail Stores, Others) , By Region and Companies - Industry Segment Outlook, Market Assessment, Competition Scenario, Trends and Forecast 2025-2034
- Published date: Aug 2025
- Report ID: 154482
- Number of Pages: 232
- Format:
-
keyboard_arrow_up
Quick Navigation
Report Overview
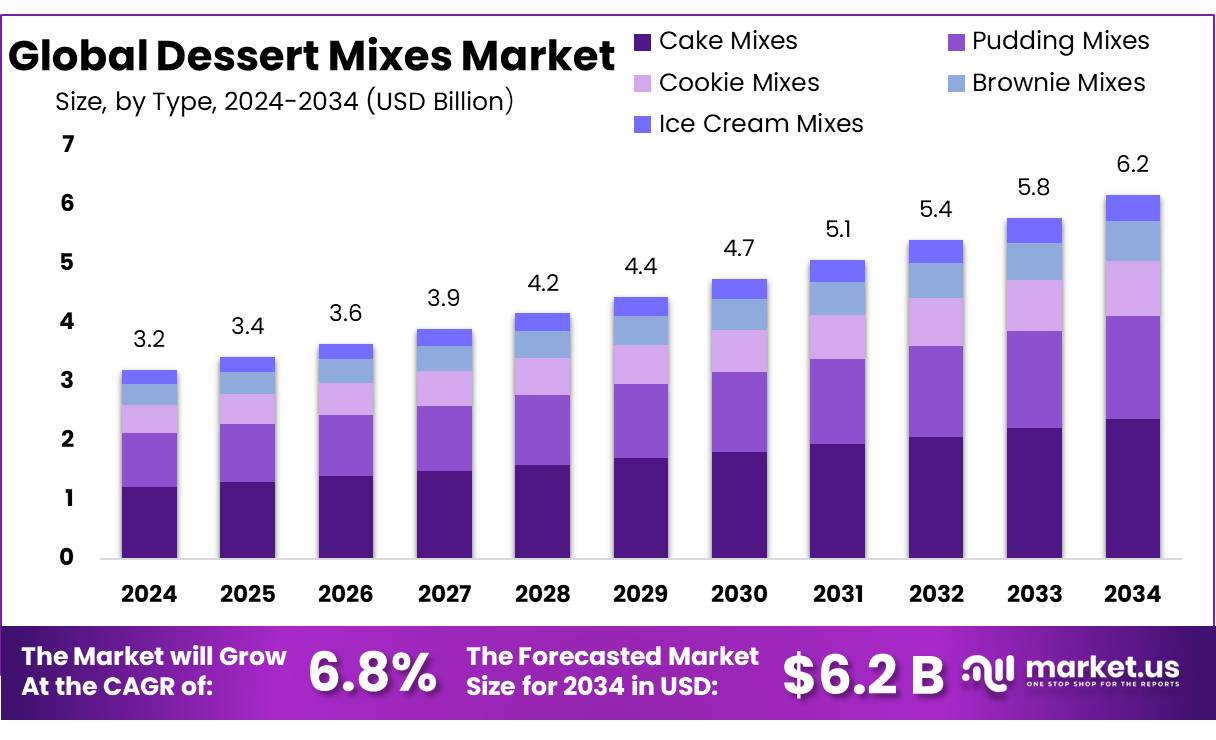
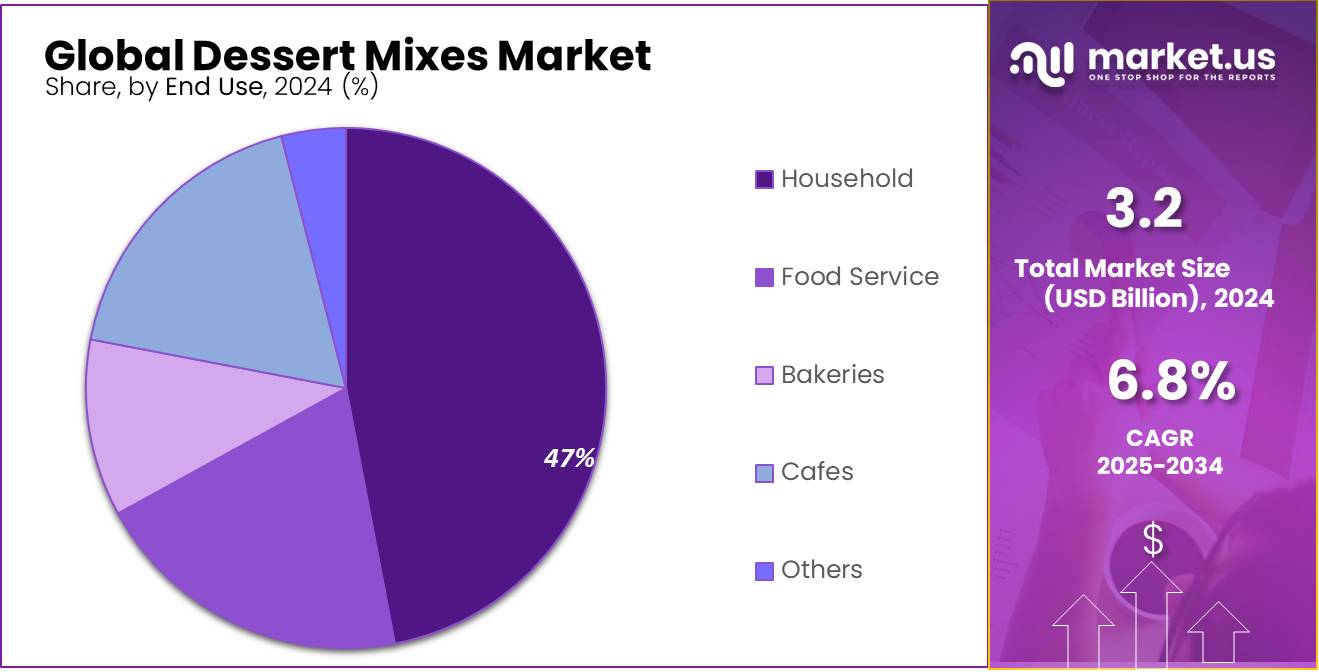
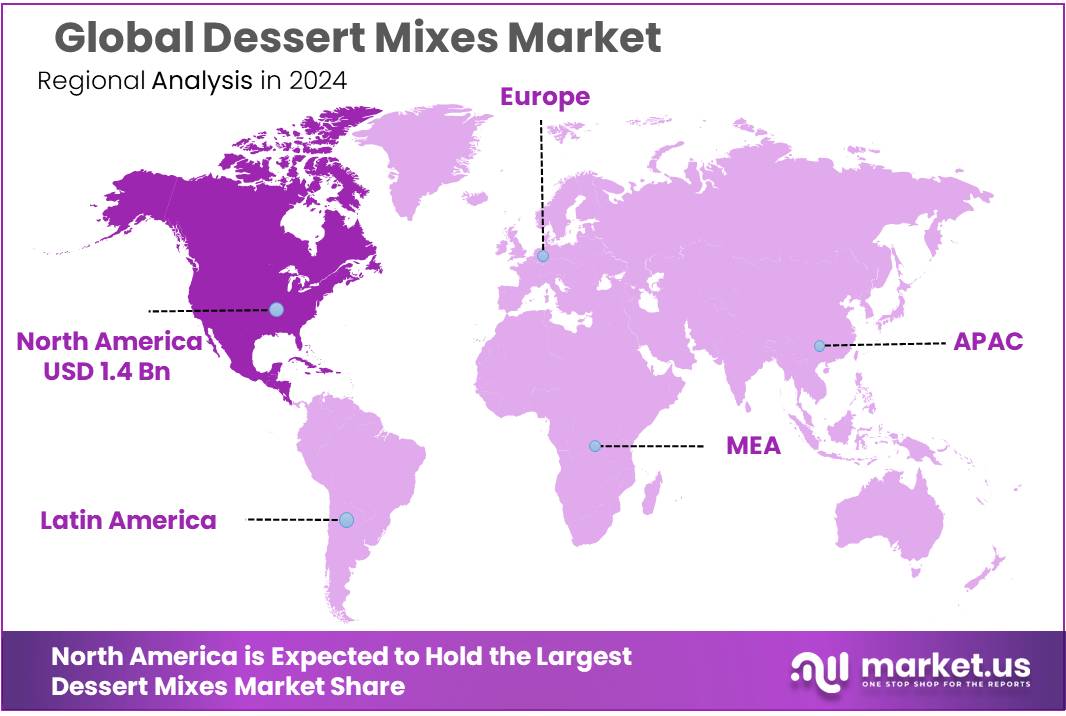
The Global Dessert Mixes Market size is expected to be worth around USD 6.2 Billion by 2034, from USD 3.2 Billion in 2024, growing at a CAGR of 6.8% during the forecast period from 2025 to 2034. In 2024, North American held a dominant market position, capturing more than a 45.10% share, holding USD 1.4 Billion in revenue.
The dessert mixes and concentrates industry includes dry and liquid forms such as cake mixes, pudding mixes, brownie mixes, ice‑cream mixes and fruit puree concentrates that serve both household and food‑service markets. While comprehensive government statistics specifically for dessert mixes remain limited, official data on key upstream commodities—such as dairy and fruit—in major consuming markets helps frame the broader scenario.
For instance, India’s fluid milk production is forecast to reach approximately 102 million metric tons (MMT) in calendar year 2024, up 2.5 % over 2023, with 110.7 MMT of buffalo (other milk) output also projected—a reflection of the robust supply base supporting ice‑cream mixes and dairy‑based dessert concentrates.
Government initiatives in India, such as support for dairy development through improved feeding, genetics and veterinary services, have underpinned the rise in milk production (212.7 MMT of total fluid supply including cow and buffalo output in 2024) while protecting domestic processing capacity through tariffs and import restrictions.
Future growth opportunities lie in unlocking penetration in emerging markets (Asia‑Pacific is the fastest growing region globally for dessert grocery consumption), and increasing product offerings in meal replacement formats, portion‑controlled snack mixes, and clean‑label or allergen‑friendly formulations. Regions with rising dairy output—such as India, contributing nearly 24 % to global milk production—and expanding fruit processing capacities are well placed to support growth in dessert concentrates tailored to local taste profiles.
Policies such as Pradhan Mantri Kisan SAMPADA Yojana provide grants and financial assistance for processing infrastructure and cold‑chain modernization, which supports extended shelf‑life for dessert concentrates like ice‑cream powders and dry pudding mixes.
The Mega Food Park Scheme, also under MoFPI, offers capital grants (up to ₹50 crore per park) to develop processing clusters linking farmers through collection and primary processing centres into commercial supply chains. These parks aim to raise food processing in India from ~6 % to ~20 % and boost India’s share in global processed‑food trade to around 3 % by 2015 targets—though development continues into the current decade across more than 40 sanctioned parks.
Key Takeaways
- Dessert Mixes Market size is expected to be worth around USD 6.2 Billion by 2034, from USD 3.2 Billion in 2024, growing at a CAGR of 6.8%.
- Cake Mixes held a dominant market position, capturing more than a 38.3% share in the Dessert Mixes Market.
- Dry Mix held a dominant market position, capturing more than a 59.7% share in the Dessert Mixes Market.
- Conventional held a dominant market position, capturing more than a 77.2% share in the Dessert Mixes Market.
- Chocolate held a dominant market position, capturing more than a 46.1% share in the Dessert Mixes Market.
- Household held a dominant market position, capturing more than a 47.5% share in the Dessert Mixes Market.
- Hypermarkets/Supermarkets held a dominant market position, capturing more than a 39.6% share in the Dessert Mixes Market.
- North American region held a commanding position in the global Dessert Mixes Market, accounting for 45.10% of total revenues, equivalent to approximately USD 1.4 billion.
By Type Analysis
Cake Mixes lead with 38.3% due to ease of use and growing home baking trends.
In 2024, Cake Mixes held a dominant market position, capturing more than a 38.3% share in the Dessert Mixes Market. This strong performance was mainly due to the rising popularity of home baking, especially among urban consumers seeking quick and easy dessert solutions. Ready-to-use cake mixes are widely preferred for their convenience, consistent results, and wide flavor options. Their dominance reflects growing consumer interest in baking at home for celebrations and everyday indulgence, fueled by social media trends and DIY recipes.
Moving into 2025, this segment is expected to maintain its lead as demand continues to rise across both retail and foodservice channels. Innovative offerings like gluten-free, vegan, and low-sugar variants are also expected to further strengthen the position of cake mixes in the market. Additionally, increasing shelf space in supermarkets and rising adoption through e-commerce platforms are likely to support steady sales throughout the year.
By Form Analysis
Dry Mix dominates with 59.7% thanks to long shelf life and easy storage.
In 2024, Dry Mix held a dominant market position, capturing more than a 59.7% share in the Dessert Mixes Market. This dominance can be linked to the product’s longer shelf life, easy packaging, and suitability for ambient storage, making it ideal for both households and commercial kitchens. Consumers prefer dry mixes because they allow for flexibility in preparation and can be stored for longer periods without refrigeration. Additionally, their compact format makes distribution and retail stocking more efficient.
Looking ahead to 2025, the demand for dry dessert mixes is expected to remain strong, particularly in emerging markets where cold storage infrastructure is limited. The convenience of preparing desserts by just adding water, milk, or eggs appeals to time-constrained users. The segment is also witnessing growth through new variants in cakes, puddings, and brownies that meet evolving consumer preferences for healthier, customizable, and easy-to-make sweet treats.
By Flavor Analysis
Conventional category dominates with 77.2% share, driven by affordability and wide consumer preference.
In 2024, Conventional held a dominant market position, capturing more than a 77.2% share in the Dessert Mixes Market by Category. This high share reflects the strong consumer trust and established presence of conventional dessert mixes across both urban and rural markets. These products are widely preferred for their affordability, familiar taste profiles, and ease of availability in general retail and grocery stores. Conventional mixes cover a broad range of dessert options, from chocolate and vanilla cakes to traditional puddings and brownies, appealing to mass-market consumers.
Looking ahead to 2025, the category is expected to sustain its lead as it continues to cater to a broad audience across income levels. While niche categories like organic or gluten-free are growing, conventional products remain dominant due to their price accessibility and consistent demand in households, bakeries, and foodservice establishments. Manufacturers are also introducing minor ingredient upgrades and packaging improvements to keep conventional offerings attractive and competitive, ensuring their continued dominance in the dessert mixes space.
By Category Analysis
Chocolate leads with 46.1% share, driven by its universal appeal and rich taste.
In 2024, Chocolate held a dominant market position, capturing more than a 46.1% share in the Dessert Mixes Market by Flavor. The popularity of chocolate-based dessert mixes remains unmatched due to its rich flavor, wide consumer acceptance, and versatility across different dessert types like cakes, puddings, brownies, and ice creams. Whether in family gatherings, festive occasions, or everyday indulgences, chocolate continues to be the first choice for both home bakers and professionals.
Heading into 2025, the chocolate segment is expected to maintain its lead as manufacturers introduce new variants including dark chocolate, low-sugar, and vegan-friendly options. Social media influence and increasing demand for premium desserts are also contributing to steady growth. Moreover, chocolate’s ability to pair well with other flavors like nuts, fruits, or caramel ensures its continued relevance and strong presence in the dessert mixes category.
By End Use Analysis
Household segment dominates with 47.5% share, fueled by convenience and at-home dessert trends.
In 2024, Household held a dominant market position, capturing more than a 47.5% share in the Dessert Mixes Market by End Use. This strong lead was driven by the increasing demand for quick and easy dessert options at home, especially among families and working individuals. Consumers are turning to ready-to-make dessert mixes like cakes, puddings, and brownies to save time while still enjoying homemade treats. The simplicity of preparation, combined with the joy of baking without much effort, has made dessert mixes a staple in many kitchens.
By 2025, this trend is expected to grow further as more people embrace home cooking, partly influenced by lifestyle changes and online food inspiration. Seasonal celebrations, birthdays, and everyday indulgence continue to drive demand for household dessert products. The expansion of retail availability and e-commerce convenience is also making these products more accessible to consumers in both urban and semi-urban areas, helping sustain the segment’s leading position in the market.
By Distribution Channel Analysis
Hypermarkets/Supermarkets lead with 39.6% share, supported by strong retail presence and visibility.
In 2024, Hypermarkets/Supermarkets held a dominant market position, capturing more than a 39.6% share in the Dessert Mixes Market by Distribution Channel. Their large shelf space, wide product variety, and frequent footfall made them the preferred choice for consumers buying dessert mixes. Shoppers often rely on these stores for quick access to trusted brands, seasonal promotions, and bulk buying options, which together boost overall sales. The ability to compare products in person also supports purchase decisions, especially for new or promotional dessert mix variants.
By 2025, this channel is expected to maintain steady growth as retail chains continue expanding into suburban and semi-urban markets. In-store visibility, coupled with promotional sampling and discount campaigns, helps drive impulse purchases and brand switching. Additionally, improvements in cold-chain logistics and inventory management allow supermarkets to stock a broader range of dessert mixes, including premium and health-oriented varieties, further strengthening their role as the leading distribution point for this segment.
Key Market Segments
By Type
- Cake Mixes
- Pudding Mixes
- Cookie Mixes
- Brownie Mixes
- Ice Cream Mixes
By Form
- Dry Mix
- Ready-to-Eat
- Liquid Mix
- Frozen Mix
By Flavor
- Chocolate
- Vanilla
- Red velvet
- Others
By Category
- Organic
- Conventional
By End Use
- Household
- Food Service
- Bakeries
- Cafes
- Others
By Distribution Channel
- Hypermarkets/Supermarkets
- Convenience Stores
- Online Retail Stores
- Others
Emerging Trends
Instant, clean-label coconut milk powders for everyday use
Shoppers are picking coconut milk in powder form because it fits busy kitchens and cafés: it dissolves fast, stores safely at room temperature, and ships light. What’s new is how clean the labels are getting. The Codex Standard for Aqueous Coconut Products (CXS 240‑2003)—amended again in 2024—tightens how coconut milk and cream are defined and which additives are acceptable. That clarity helps brands formulate simpler, standards‑ready powders that move across borders without reformulating for each market.
Regulators are pushing in the same direction. In the EU, the Union list of approved food additives (Regulation (EC) No 1333/2008) sets strict category rules that favor leaner formulas and transparent labeling. Coconut milk powder makers are responding with unsweetened and short‑ingredient SKUs that still foam in coffee, whisk into curries, and travel well for e‑commerce.
Another driver is who needs dairy‑free options: the NIDDK estimates about 68% of the world’s population has lactose malabsorption. That big base isn’t new, but the format is: cafés, vending operators, and home cooks are moving to powders because they cut waste and refrigeration, especially in hot climates and small spaces.
Supply chains are also tilting toward powder‑friendly growth. China—now a major buyer in Asia—imported ~1.22 billion kg of coconuts in 2023 (about $619 million), keeping processors and blenders busy across the region with steady raw material flows that can be spray‑dried close to ports. Powder captures these flows efficiently and widens access for private labels.
Governments are quietly enabling this shift. India’s Coconut Development Board financed and disseminated spray‑dried coconut milk powder technology with CFTRI, lowering barriers for small and mid‑sized processors to launch stable, export‑ready powders. In the Philippines, the Coconut Farmers and Industry Development Plan (RA 11524) channels public funds into replanting and processing—support that ultimately feeds more value‑added products like powders. Together, these steps make the “instant, clean‑label” trend durable, not just fashionable.
Drivers
The dairy‑free shift powered by lactose intolerance
One of the biggest forces pushing coconut milk powder forward is the simple fact that many people can’t comfortably digest regular milk. Health agencies estimate about 68% of the world’s population has lactose malabsorption, which often leads to lactose intolerance and drives shoppers toward dairy‑free choices they can use in tea, coffee, baking, and packaged foods. Coconut milk powder answers that need with a creamy taste, long shelf life, and easy transport for brands and retailers.
On the supply side, coconut is right where demand is rising: Asia. FAO notes coconuts are mostly produced in Asia, led by Indonesia, the Philippines, and India—a geography that keeps ingredient pipelines close to large, lactose‑intolerant consumer bases. FAO’s figures also show global coconut output at ~62.4 million tonnes in 2022, underlining ample raw material for powder processing and export. Together, these facts make coconut milk powder a practical, scalable dairy alternative for mainstream food and beverage lines.
Government backing is reinforcing the shift. In India, the Coconut Development Board provides technology for spray‑dried coconut milk powder and extends financial assistance to set up value‑added units, explicitly naming coconut milk powder as eligible.
Such support lowers startup costs, nudges capacity expansion, and helps stabilize supplies for both domestic and export markets. The Philippine Coconut Authority is likewise rolling out programmatic interventions to improve farmer incomes and upgrade coconut‑based industries—conditions that favor more value‑added products like milk powder.
Restraints
Limited Coconut Production And Farmer Dependency
One of the major challenges slowing down the growth of coconut milk powder is the limited and uneven production of coconuts, especially in key growing regions. While coconut trees are a valuable resource, they’re highly sensitive to climate, aging, and disease — making consistent, large-scale output difficult. As per the Food and Agriculture Organization (FAO), global coconut production stood at 62.4 million tonnes in 2022, with Indonesia, the Philippines, and India accounting for nearly 75% of that supply. This means the entire world is highly dependent on just a few countries for raw material, which creates risk.
In the Philippines, for example, the Philippine Coconut Authority (PCA) has reported that approximately 60% of coconut farmers live below the poverty line, and many still rely on traditional farming methods. Low income discourages investment in better farming tools or replanting of aging trees. Most coconut trees in the region are over 60 years old, past their peak productivity phase, and yields are declining. This affects the supply chain for coconut-based products, including milk powder.
Climate change adds more pressure. Typhoons, droughts, and unpredictable rain patterns have been damaging coconut crops regularly. In 2021, Typhoon Rai caused significant damage to coconut plantations across the Philippines, one of the biggest exporters. Recovery can take up to 7 years for newly planted coconut trees to bear fruit, which slows production recovery dramatically.
Governments are working on it. The Indian Coconut Development Board and the PCA have initiated replanting programs and technology support. But the impact takes time. Until coconut farming becomes more resilient and equitable, the industry’s ability to scale coconut milk powder remains limited — not because of demand, but because of what’s growing on the trees.
Opportunity
Standards‑ready, shelf‑stable dairy alternative for lactose‑intolerant markets
Coconut milk powder sits at the sweet spot of two big needs: safe, recognized standards for trade and a very large base of people who want dairy‑free choices. Codex Alimentarius maintains a global standard for aqueous coconut products (coconut milk and cream)—CXS 240‑2003, amended as recently as 2024. Clear definitions and additive rules make it easier for brands and retailers to source across borders and scale new products (ready‑to‑mix beverages, creamers, bakery mixes) without reinventing specs for every market. For exporters, having a living Codex standard lowers technical barriers and helps win listings with modern trade and e‑commerce.
Demand‑side pull is strong and simple: many adults can’t comfortably digest lactose. The U.S. National Institute of Diabetes and Digestive and Kidney Diseases notes about 68% of the world’s population has lactose malabsorption, a key reason people look for dairy‑free formats that are easy to use in tea, coffee, and cooking. Powder solves everyday pain points—no refrigeration, lighter freight, long shelf life—so households and foodservice can keep stock without waste.
Supply is anchored where demand is high. FAOSTAT reports global coconuts at ~62.4 million tonnes (2022), led by Indonesia, the Philippines, and India. Clusters of raw material, processors, and ports shorten lead times for spray‑drying and help private labels launch SKUs quickly. Powder also lets producers valorize seasonal surpluses of coconut milk that would otherwise be costly to ship as liquid.
Governments are leaning in. India’s Coconut Development Board provides technology and assistance for spray‑dried coconut milk powder, helping SMEs move up the value chain. In the Philippines, the Coconut Farmers and Industry Development Plan (under RA 11524) finances replanting, processing, and market access—exactly the backbone needed for more value‑added exports like milk powder. Together, these programs reduce unit costs, improve quality, and widen procurement options for buyers.
Regional Insights
North America dominates with 45.10% share, representing US 1.4 billion in 2024 sales.
In 2024, the North American region held a commanding position in the global Dessert Mixes Market, accounting for 45.10% of total revenues, equivalent to approximately USD 1.4 billion. This dominance reflects well-established consumption patterns, high consumer purchasing power, and longstanding presence of leading brands in the United States and Canada.
The U.S. market alone generated nearly USD 1.9 billion in retail dessert mix sales in 2022, largely stable from previous years with minimal year‑over‑year change. Growth is projected at a modest 1.7% CAGR through 2027. These facts underline North America’s mature and steady consumption dynamics, manifesting in consistent volume despite limited expansion.
Several factors reinforce this leading position. First, the region benefits from well‑developed modern retail channels—including hypermarkets and supermarkets—which offer extensive variety of dessert mix options and promotional activity. Seasonality plays a notable role, with purchases of cake and cookie mixes rising sharply between October and December, tied to holiday baking traditions and festive celebrations. Second, the presence of heritage brands such as Betty Crocker, Jell‑O, and Duncan Hines drives strong consumer loyalty and consistent demand, with these brands accounting for nearly half of U.S. dessert mix sales.
Key Regions and Countries Insights
- North America
- US
- Canada
- Europe
- Germany
- France
- The UK
- Spain
- Italy
- Rest of Europe
- Asia Pacific
- China
- Japan
- South Korea
- India
- Australia
- Rest of APAC
- Latin America
- Brazil
- Mexico
- Rest of Latin America
- Middle East & Africa
- GCC
- South Africa
- Rest of MEA
Key Players Analysis
Cargill, a global food and agriculture giant, contributes significantly to the dessert mixes segment through its wide portfolio of food ingredients. It supplies key components like cocoa powder, starches, sweeteners, and stabilizers used in formulating various dessert mix products. Cargill also offers technical support to manufacturers for product development and reformulation. With operations in over 70 countries, the company ensures reliable ingredient sourcing, regulatory compliance, and sustainable supply chains to serve evolving consumer preferences.
Betty Crocker, a trusted household brand under General Mills, plays a dominant role in the dessert mixes market. It offers a wide range of cake, brownie, cookie, and muffin mixes known for ease of preparation and consistent quality. Popular across North America and parts of Asia-Pacific, Betty Crocker is recognized for its seasonal offerings and new product innovation such as gluten-free and low-sugar mixes. Strong retail presence and high brand loyalty drive its continued market leadership.
Chelsea Milling Co., best known for its “Jiffy” brand, is a U.S.-based family-owned company specializing in ready-to-use baking mixes. Its offerings include muffin, cake, brownie, and cornbread mixes that are widely used in households and institutional kitchens. The company is known for its cost-effective products, simple packaging, and strong domestic distribution. With decades of market presence, Chelsea Milling maintains a stable customer base through consistent product quality and its focus on value-based pricing.
Top Key Players Outlook
- Baker Hughes
- Betty Crocker
- Cargill
- Chelsea Milling Co.
- Chocoladefabriken Lindt & Sprüngli AG
- Conagra Brands Inc.
- Dr. Oetker KG
- Duncan Hines
- General Mills Inc.
- Hershey’s
Recent Industry Developments
In 2024 Baker Hughes plays, posted USD 27.8 billion in total revenue (9% growth year‑on‑year), with USD 13 billion worth of Industrial & Energy Technology orders—a clear indicator of demand across industrial sectors including processed food.
In 2024, Betty Crocker—a flagship brand of General Mills—continued to reinforce its leadership in the dessert mix category, particularly cake mixes. Nielsen data for the 52 weeks ending April 5, 2025 confirmed that Betty Crocker remains America’s #1 cake mix brand, based on dry cake mix sales.
Report Scope
Report Features Description Market Value (2024) USD 3.2 Bn Forecast Revenue (2034) USD 6.2 Bn CAGR (2025-2034) 6.8% Base Year for Estimation 2024 Historic Period 2020-2023 Forecast Period 2025-2034 Report Coverage Revenue Forecast, Market Dynamics, Competitive Landscape, Recent Developments Segments Covered By Type (Cake Mixes, Pudding Mixes, Cookie Mixes, Brownie Mixes, Ice Cream Mixes), By Form (Dry Mix, Ready-to-Eat, Liquid Mix, Frozen Mix), By Flavor (Chocolate, Vanilla, Red velvet, Others), By Category (Organic, Conventional), By End Use ( Household, Food Service, Bakeries, Cafes, Others), By Distribution Channel (Hypermarkets/Supermarkets, Convenience Stores, Online Retail Stores, Others) Regional Analysis North America – US, Canada; Europe – Germany, France, The UK, Spain, Italy, Rest of Europe; Asia Pacific – China, Japan, South Korea, India, Australia, Singapore, Rest of APAC; Latin America – Brazil, Mexico, Rest of Latin America; Middle East & Africa – GCC, South Africa, Rest of MEA Competitive Landscape Baker Hughes, Betty Crocker, Cargill, Chelsea Milling Co., Chocoladefabriken Lindt & Sprüngli AG, Conagra Brands Inc., Dr. Oetker KG, Duncan Hines, General Mills Inc., Hershey’s Customization Scope Customization for segments, region/country-level will be provided. Moreover, additional customization can be done based on the requirements. Purchase Options We have three licenses to opt for: Single User License, Multi-User License (Up to 5 Users), Corporate Use License (Unlimited User and Printable PDF) 
-
-
- Baker Hughes
- Betty Crocker
- Cargill
- Chelsea Milling Co.
- Chocoladefabriken Lindt & Sprüngli AG
- Conagra Brands Inc.
- Dr. Oetker KG
- Duncan Hines
- General Mills Inc.
- Hershey's
Our Clients
- 154482
- Aug 2025


