


Report Overview
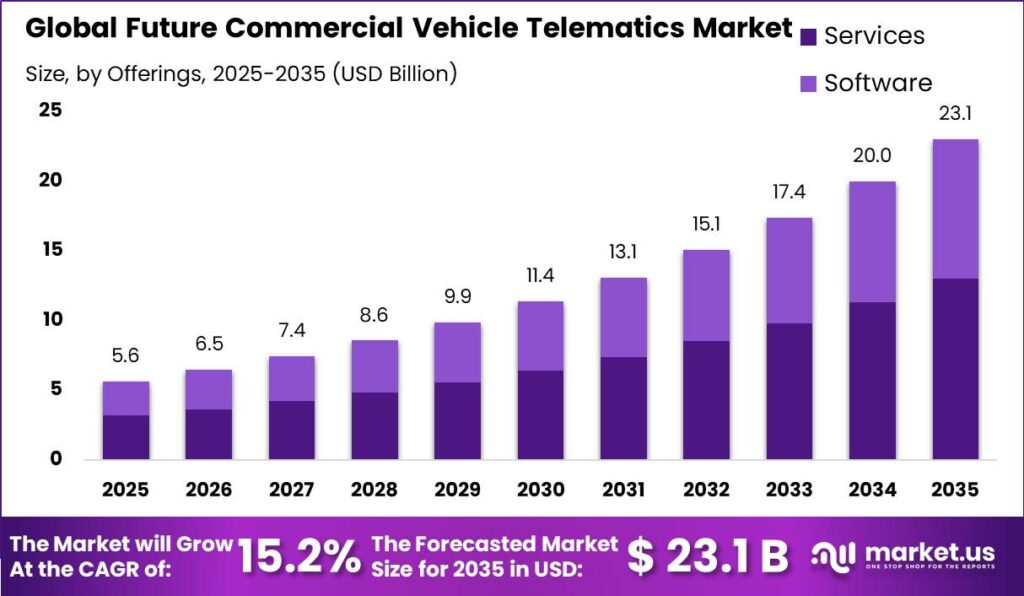
Global Future Commercial Vehicle Telematics Market size is expected to be worth around USD 23.10 Billion by 2035 from USD 5.60 Billion in 2025, growing at a CAGR of 15.2% during the forecast period 2026 to 2035. This trajectory reflects how fleets now treat connected data as core operating infrastructure. Operators buy telematics to cut cost, meet compliance, and protect margins, which locks in recurring software revenue for suppliers.
Commercial vehicle telematics combines onboard hardware, wireless connectivity, and cloud software to track location, driver behavior, engine health, and fuel use. The market structures around offerings, providers, vehicle types, and end-user verticals. Therefore vendors compete across two layers at once. Hardware wins the vehicle slot, while software subscriptions capture the long-term customer relationship and set pricing power for the decade ahead.
Key Takeaways
- Global market reaches USD 23.10 Billion by 2035 from USD 5.60 Billion in 2025, at a CAGR of 15.2%.
- Software leads the By Offerings segment with a 43.45% share.
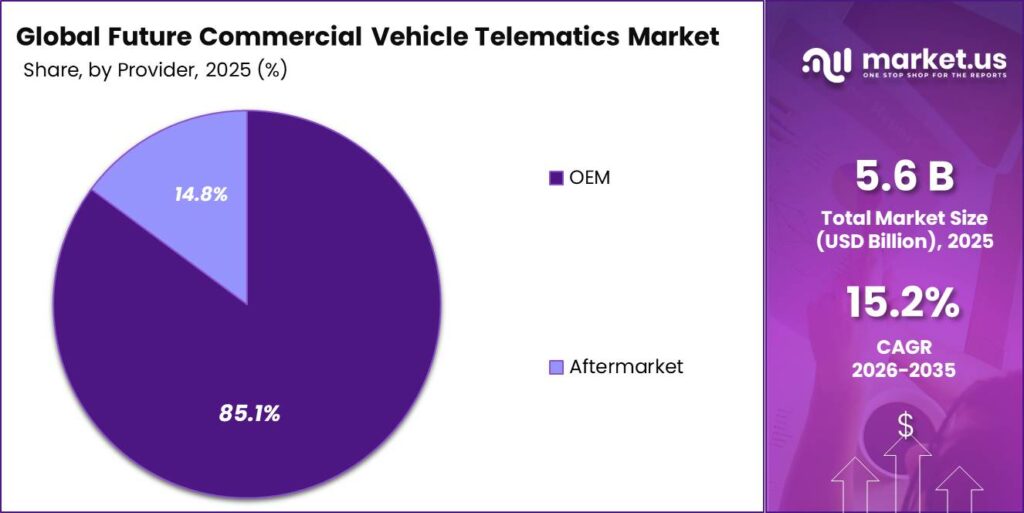
- OEM providers dominate delivery channels with an 85.12% share.
- Light Commercial Vehicles hold 67.56% of the By Vehicle Type segment.
- Leasing Companies lead the By End User Vertical segment with 56.34%.
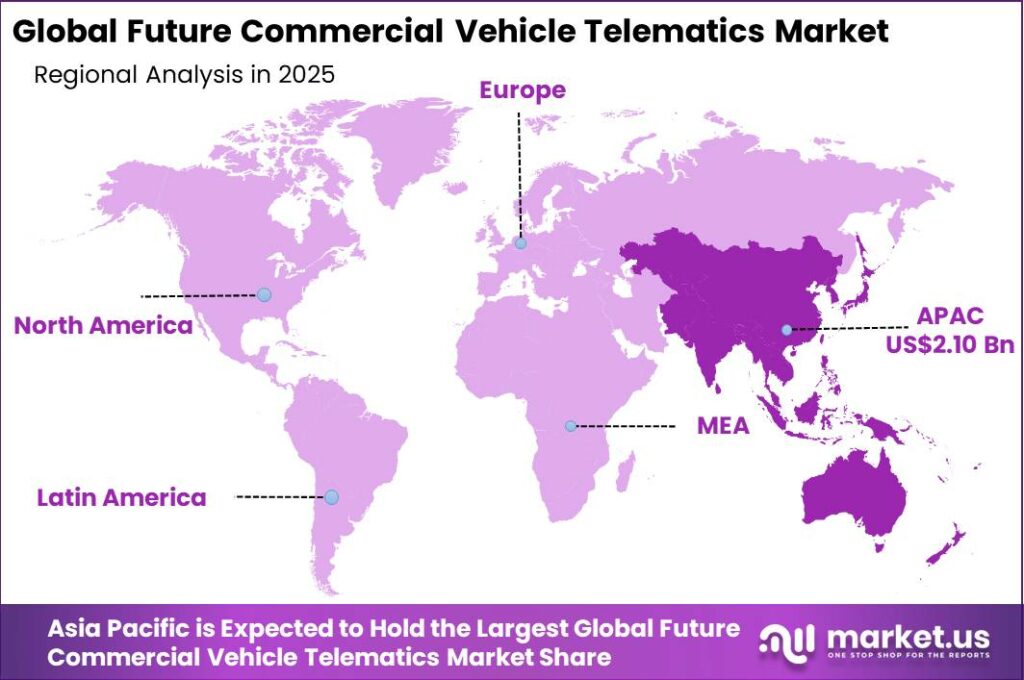
- Asia-Pacific dominates regionally with a 37.67% share, valued at USD 2.11 Billion.
Government mandates now anchor demand across major economies. Regulators treat digital fleet records as safety and audit tools, which converts optional software into required infrastructure. This means suppliers gain a predictable installed base and steady renewal revenue. As a result, telematics spending resists the usual cuts fleets make during weak freight cycles.
Fleet Management demand climbs as operators chase measurable savings, and connected data delivers proof. As reported by Samsara, its telematics and AI safety tools reduced harsh driving events by 84% in its 2025 Safety Report. Fewer harsh events lower insurance and repair costs. This creates a direct payback case that pushes hesitant fleets toward paid, multiyear subscriptions.
Rising vehicle counts on connected platforms deepen the case for scale. Data from Geotab shows United Utilities deployed GO9 telematics across more than 2,300 vehicles and improved driver-safety performance by 25%. Safer fleets face fewer claims and downtime days. Consequently, large asset owners standardize on single platforms, which raises switching costs and rewards incumbent vendors. A 2025 technical study also found IoT fleet-management deployments cut downtime by 25% through predictive maintenance.
Offerings Analysis
Software dominates with 43.45% due to recurring subscription and analytics value.
In 2025, Software held a dominant market position in the By Offerings segment of Commercial Vehicle Telematics Market, with a 43.45% share. Rising vehicle connectivity feeds this layer, since OICA recorded global motor vehicle production near 92.7 million units in 2024. Every connected vehicle needs analytics to create value. This means software vendors capture durable revenue while hardware becomes a commodity entry point.
Services support the software layer through installation, training, and managed monitoring, which explains their fastest-growing status. Fleet complexity drives this need, since ACEA reported EU van registrations fell 8.8% in 2025 as operators optimized existing assets harder. Tighter fleets demand expert tuning of data tools. Therefore service revenue expands even when new vehicle purchases slow, giving vendors a counter-cyclical income stream.
Hardware anchors the physical data connection through gateways, sensors, and cameras installed on each vehicle. Global commercial vehicle output supports this base, since ACEA data placed 2024 global van production in decline yet still in the millions of units. Devices open the customer relationship. This creates a land-and-expand model where cheap hardware seeds later software and service upsells across the vehicle life.
Provider Analysis
OEM dominates with 85.12% due to factory-embedded connectivity at production.
In 2025, OEM held a dominant market position in the By Provider segment of Commercial Vehicle Telematics Market, with an 85.12% share. Factory installation scales with output, since OICA figures show global vehicle production rose to about 96.4 million units in 2025, up 3.9% year on year. Embedded units ship with every new vehicle. This means OEMs capture the connectivity slot before aftermarket players reach the buyer.
Aftermarket providers serve older and mixed fleets that lack factory telematics, which drives their fastest-growing position. Existing parc size supports this, since global vehicle production added tens of millions of units annually across recent OICA reporting years. Legacy vehicles still need connectivity. Therefore aftermarket vendors win retrofit demand and extend platform reach into fleets OEM channels cannot easily serve.
Vehicle Type Analysis
Light Commercial Vehicles dominate with 67.56% due to dense last-mile delivery use.
In 2025, Light Commercial Vehicles held a dominant market position in the By Vehicle Type segment of Commercial Vehicle Telematics Market, with a 67.56% share. Van fleets form the largest addressable base, since ACEA recorded new EU van registrations near 1.4 million units in 2024 before the 2025 decline. High vehicle density lifts telematics demand. This means suppliers target vans first to maximize connected units per account.
Heavy and Medium Commercial Vehicles serve long-haul and construction roles, which explains their fastest-growing status. Freight recovery shapes this demand, since ACEA noted EU truck registrations fell 6.3% in 2024 amid a soft cycle. Higher-value trucks justify richer telematics packages. Therefore vendors earn larger per-vehicle revenue here, offsetting lower unit volumes with premium compliance and safety modules.
End User Vertical Analysis
Leasing Companies dominate with 56.34% due to large managed multi-client fleets.
In 2025, Leasing Companies held a dominant market position in the By End User Vertical segment of Commercial Vehicle Telematics Market, with a 56.34% share. Fleet scale drives adoption, since ACEA data showed EU commercial vehicle registrations totaling well over 1.6 million units in 2024. Leasing firms manage vehicles across many clients. This means they standardize telematics early to protect asset value and resale data.
Transportation and Logistics Companies run high-mileage fleets under tight margins, which explains their fastest-growing status. Freight volume shapes this need, since ACEA reported EU van market share shifts as diesel fell to about 82% in H1 2025. Route efficiency directly affects profit. Therefore logistics operators adopt telematics aggressively, making them the segment expanding quickest across the forecast.
Other verticals include construction, utilities, and public-sector fleets that use telematics for compliance and asset control. These operators hold the remaining share collectively. Specialized duty cycles shape their needs. This creates niche demand for rugged hardware and custom reporting, giving smaller vendors defensible footholds outside the leasing and logistics mainstream.
Key Market Segments
By Offerings
- Software
- Services
By Provider
- OEM
- Aftermarket
By Vehicle Type
- Light Commercial Vehicles
- Heavy and Medium Commercial Vehicles
By End User Vertical
- Transportation and Logistics Companies
- Leasing Companies
- Others
Regional Analysis
Asia-Pacific Dominates the Commercial Vehicle Telematics Market with a Market Share of 37.67%, Valued at USD 2.11 Billion
Asia-Pacific leads the market with a 37.67% share, valued at USD 2.11 Billion. Large commercial fleets and rapid e-commerce delivery drive this position. Dense urban logistics demand real-time tracking. This means suppliers prioritize the region for volume, since high vehicle counts translate into the largest connected installed base and the widest software subscription pool worldwide.
North America grows fastest as fleets deepen compliance and safety spending. Rising product launches accelerate adoption here. In July 2025, CalAmp launched the LMU-4350LB and LMU-4351LB edge-enabled in-cab telematics gateways for commercial fleets and telematics providers. Advanced edge hardware lifts per-vehicle value. Therefore North American operators upgrade quickly, expanding revenue faster than the mature European base.
Key Regions and Countries
North America
- US
- Canada
Europe
- Germany
- France
- The UK
- Spain
- Italy
- Rest of Europe
Asia Pacific
- China
- Japan
- South Korea
- India
- Australia
- Rest of APAC
Latin America
- Brazil
- Mexico
- Rest of Latin America
Middle East and Africa
- GCC
- South Africa
- Rest of MEA
Market dynamics
Market Opportunity Analysis - Underused segments and regions open clear entry points for new players
Aftermarket providers hold underexploited ground within the By Provider segment, since OEM channels control 85.12% of delivery. Millions of older vehicles still lack factory telematics. This means retrofit specialists can capture legacy fleets that OEM programs ignore. New entrants targeting aging parc vehicles gain a defensible niche without competing head-on for the new-vehicle production slot.
Heavy and Medium Commercial Vehicles remain underserved compared with Light Commercial Vehicles, which hold 67.56% of the vehicle-type segment. Higher-value trucks justify richer telematics packages. Therefore vendors focusing on premium safety and compliance modules for trucks can earn larger per-vehicle revenue. This creates room for specialist players to build margin-rich positions outside the crowded van market.
Transportation and Logistics Companies sit below Leasing Companies, which dominate the vertical with 56.34%. High-mileage logistics fleets face intense margin pressure. This means route-optimization and fuel-efficiency tools find eager buyers here. New entrants that tailor analytics to freight economics can win the fastest-growing vertical before incumbents lock in these accounts.
North America offers upside beyond Asia-Pacific, which leads with a 37.67% share worth USD 2.11 Billion. Rising compliance and safety spending accelerate regional demand. Instead of chasing the largest base, investors can target the fastest-expanding one. This signals that firms entering North America early can ride upgrade cycles and capture premium subscription growth ahead of saturation.
Technology and Innovation Landscape - AI safety, edge gateways, and integrated video redefine competitive edges
AI-powered safety analytics now anchor product differentiation across the market. As reported by Samsara, its AI safety tools reduced vehicle crash rates by 73% across more than 2,600 customer fleets. Fewer crashes cut insurance and downtime costs directly. This means vendors embedding proven AI safety win enterprise deals, since buyers pay premiums for tools that deliver measurable risk reduction.
Edge-enabled in-cab gateways push processing closer to the vehicle. In July 2025, CalAmp launched the LMU-4350LB and LMU-4351LB edge-enabled gateways for commercial fleets and telematics providers. Edge hardware lowers latency and data-transfer cost. Therefore fleets gain faster alerts and richer local analytics. This creates an upgrade cycle that rewards vendors shipping capable edge devices over basic tracking units.
Integrated video and driver-monitoring systems now merge safety and telematics into single platforms. In April 2025, Lytx unveiled Lytx+ with Geotab, combining video safety and commercial-vehicle telematics. Unified platforms reduce vendor sprawl for fleets. This signals that combined video and data offerings raise switching costs. Consequently, suppliers that bundle these layers defend accounts better against single-feature competitors.
AI fatigue and drowsiness detection extend safety innovation into driver wellbeing. In July 2025, Lytx launched AI-powered Fatigue Detection to identify early signs of driver drowsiness. Early fatigue alerts prevent high-cost collisions. This means safety-focused fleets adopt these tools quickly. As a result, vendors investing in behavioral AI open new premium modules that lift software revenue per vehicle.
Drivers
Mandatory compliance shifts telematics from optional software toward audit-critical infrastructure. The European Commission required older analogue or non-smart tachographs in international transport to be replaced by 31 December 2024, extended the second-generation retrofit deadline to 18 August 2025, and brought qualifying cross-border light commercial vehicles above 2.5 tonnes into scope from 1 July 2026. FMCSA positions electronic logging devices as safety and record tools, while UNECE Regulation No. 155 sets the cybersecurity framework for connected-vehicle systems.
These milestones support an estimated +2.4% incremental CAGR contribution by enlarging the installed base and shortening replacement cycles. Compliance converts hardware-led sales into software subscriptions for driver-hours monitoring, remote downloads, and audit retention. EU rules require driver-card downloads every 28 days, vehicle-unit downloads every 90 days, and records kept for 12 months. This means suppliers gain recurring, non-discretionary revenue that holds firm through weak freight cycles.
| Driver | (~) % Impact on CAGR Forecast | Geographic Relevance | Impact Timeline |
|---|---|---|---|
| Mandatory Digital Fleet Compliance | +2.4% | Europe, North America | Short term (2 years or less) |
| OEM-Embedded Connectivity Expansion | +2.1% | Global | Short term (2 years or less) |
| Fleet Cost Optimization | +1.8% | Global | Short term (2 years or less) |
| Usage-Based Insurance Adoption | +1.2% | North America, Europe | Medium term (2 to 4 years) |
| E-Commerce Delivery Digitization | +1.0% | Asia-Pacific, North America | Medium term (2 to 4 years) |
| Cross-Border Freight Visibility | +0.8% | Europe, Asia-Pacific, Latin America | Medium term (2 to 4 years) |
Restraints
Fleet operators face reduced capacity to fund devices, installation, and multiyear subscriptions while core costs absorb cash. The American Transportation Research Institute measured average US trucking cost at $2.260 per mile in 2024 and $2.336 per mile in 2025, a 3.4% annual rise, with non-fuel costs up 4.2% to $1.854 per mile. ATRI-linked benchmarks show insurance premiums and equipment costs had already risen about 6.8% and 3.8% in the prior cost cycle.
The resulting -2.2% CAGR deduction reflects deferred rollouts, fewer paid modules per vehicle, and tougher renewals. IRU evidence shows small road carriers stay exposed to thin liquidity and volatile freight demand. This forces suppliers to subsidize hardware, shorten contracts, or offer per-vehicle monthly pricing. As a result, early contract margins can compress by an estimated 4% to 8%, pressuring vendor profitability during weak cycles.
| Restraint | (~) % Impact on CAGR Forecast | Geographic Relevance | Impact Timeline |
|---|---|---|---|
| Fleet Capital Expenditure Scarcity | -2.2% | Global, strongest among small fleets | Short term (2 years or less) |
| Data-Localization Restrictions | -1.5% | Europe, China, India | Medium term (2 to 4 years) |
| Fragmented Privacy Consent Rules | -1.2% | Europe, North America | Short term (2 years or less) |
| Legacy Retrofit Economics | -1.0% | Latin America, Africa, South Asia | Medium term (2 to 4 years) |
| Carrier Business Failures | -0.9% | North America, Europe | Short term (2 years or less) |
| Procurement Vendor Lock-In | -0.6% | Global | Medium term (2 to 4 years) |
Challenges
Mixed fleets combine vehicles of different ages, OEM protocols, diagnostic interfaces, and powertrains, creating a persistent integration burden. The IEA shows electric vehicles exceeded 20% of new-car sales in 2024 and projects sales above 20 million in 2025, while European Commission rules require full interoperability across alternative-fuel infrastructure. Ericsson Mobility places cellular IoT connections on about an 11% CAGR through 2030, yet first RedCap products arrived only in 2024.
This protocol and architecture overlap creates an estimated -1.9% friction drag through longer integrations, duplicate gateways, and higher support costs. More than 10 major service providers were still testing RedCap technology. This means vendors must invest in vehicle-abstraction layers, standardized APIs, and over-the-air adapters. Consequently, firms that solve interoperability first unlock a new revenue stream selling unified combustion, battery, and route-data models across fragmented fleets.
| Challenge | (~) % CAGR Friction Drag | Geographic Relevance | Mitigation Horizon |
|---|---|---|---|
| Mixed-Fleet Data Interoperability | -1.9% | Global | Medium term (2 to 4 years) |
| Connected-Vehicle Cybersecurity Exposure | -1.7% | Global, strongest in regulated markets | Long term (4 years or more) |
| Rural Network Coverage Gaps | -1.3% | Latin America, Africa, South Asia | Long term (4 years or more) |
| Analytics Talent Deficit | -1.0% | Global | Medium term (2 to 4 years) |
| Sensor Data Quality Variance | -0.8% | Global | Medium term (2 to 4 years) |
| Driver Adoption Resistance | -0.7% | North America, Europe, Asia-Pacific | Short term (2 years or less) |
Opportunities
Electric-fleet energy orchestration remains future white space because electric trucks still form a limited part of the operating parc. IEA tracking recorded global electric-truck sales growth near 80% in 2024, yet electric models made up only about 2% of truck sales. The European Commission Alternative Fuels Infrastructure Regulation has applied since 13 April 2024 and sets mandatory national charging targets across member states.
IRU analysis specifies heavy-duty charging every 120 km on at least 15% of the trans-European network by end of 2025, moving toward 60 km spacing on the core network. Capturing this space through managed charging and route-level state-of-charge optimization could add about +2.3% to CAGR. This means early movers lift software gross margins by an estimated 5 to 9 points and cut fleet energy cost per vehicle by roughly 6% to 12%.
| Opportunity | (~) % Potential CAGR Upside | Geographic Relevance | Execution Window |
|---|---|---|---|
| Electric Fleet Energy Orchestration | +2.3% | Europe, China, North America | Medium term (2 to 4 years) |
| AI Predictive Maintenance Monetization | +2.0% | Global | Medium term (2 to 4 years) |
| Emerging-Market Fleet Digitization | +1.7% | South Asia, Africa, Latin America | Long term (4 years or more) |
| Freight Data Exchange Platforms | +1.3% | Europe, North America, Asia-Pacific | Long term (4 years or more) |
| Autonomous Logistics Integration | +1.1% | North America, China, Europe | Long term (4 years or more) |
| Regional Provider Roll-Ups | +0.8% | Latin America, Europe, Asia-Pacific | Medium term (2 to 4 years) |
Key Company Insights
Verizon Communications Inc. positions itself around integrated hardware and connectivity strength across large North American fleets. In January 2025, Verizon Connect launched Extended View Cameras including rear, cargo, and side cameras with a dash-mounted monitor. Video safety systems reduce safety-related events by more than 50% on average. This creates an advantage in safety-led sales, since bundled cameras and connectivity raise switching costs and lock fleets into recurring service contracts.
Geotab Inc. builds its edge around deep telematics analytics and measurable fleet outcomes. Data from Geotab shows TELUS improved fuel efficiency by up to 40% after deploying its telematics across more than 2,800 vehicles. Proven savings at this scale strengthen enterprise credibility. This creates a competitive moat, since large asset owners standardize on platforms with documented results, making it harder for smaller rivals to displace Geotab on price alone.
Key Players
- Verizon Communications Inc.
- Geotab Inc.
- Samsara Inc.
- Trimble Inc.
- Vontier Corporation
- Powerfleet Inc.
- Omnitracs LLC
- Lytx Inc.
- CalAmp Corp.
- Webfleet Solutions
- Other Key Players
Recent Developments
- January 2025: CalAmp launched Okta Single Sign-On integration across its iOn Fleet and Device Management applications.
- April 2025: Lytx unveiled Lytx+ with Geotab, an integrated fleet-management solution combining video safety and commercial-vehicle telematics.
- June 2025: Samsara and Element Fleet Management launched a unified fleet and operations management offering for customers in Canada and the United States.
- July 2025: Lytx launched its AI-powered Fatigue Detection technology for identifying early signs of driver drowsiness.
Geopolitical Impact Analysis
Global trade tensions raise input costs for telematics hardware built on semiconductors and connectivity modules. According to the WTO, world merchandise trade volume growth stayed near 2.7% in recent reporting, while tariff escalation lifted duties on some electronics components above 25%. Higher chip and module costs squeeze device margins. This means telematics suppliers face pricing pressure on hardware, pushing them toward software revenue to protect overall profitability.
Supply chain rerouting adds delay and cost to component shipments feeding telematics production. As reported by UNCTAD, longer shipping routes around conflict zones extended some transit times by more than 10 days and lifted container freight rates by over 100% during peak disruption. Delayed components slow device delivery and installation. Therefore vendors hold larger inventories, raising working-capital needs and reinforcing the shift toward asset-light software and subscription models.
Report Scope
| Report Features | Description |
|---|---|
| Market Value (2025) | USD 5.60 Billion |
| Forecast Revenue (2035) | USD 23.10 Billion |
| CAGR (2026-2035) | 15.2% |
| Base Year for Estimation | 2025 |
| Historic Period | 2020-2024 |
| Forecast Period | 2026-2035 |
| Report Coverage | Revenue Forecast, Market Dynamics, Market Opportunity Analysis, Technology and Innovation Landscape, Competitive Landscape, Recent Developments |
| Segments Covered | By Offerings (Software, Services), By Provider (OEM, Aftermarket), By Vehicle Type (Light Commercial Vehicles, Heavy and Medium Commercial Vehicles), By End User Vertical (Transportation and Logistics Companies, Leasing Companies, Others) |
| Regional Analysis | North America (US and Canada), Europe (Germany, France, The UK, Spain, Italy, and Rest of Europe), Asia Pacific (China, Japan, South Korea, India, Australia, and Rest of APAC), Latin America (Brazil, Mexico, and Rest of Latin America), Middle East and Africa (GCC, South Africa, and Rest of MEA) |
| Competitive Landscape | Verizon Communications Inc., Geotab Inc., Samsara Inc., Trimble Inc., Vontier Corporation, Powerfleet Inc., Omnitracs LLC, Lytx Inc., CalAmp Corp., Webfleet Solutions, Other Key Players |
| Customization Scope | Customization for segments, region / country-level will be provided. Additional customization can be done based on requirements. |
| Purchase Options | We have three licenses to opt for: Single User License | Multi-User License (Up to 5 Users) | Corporate Use License (Unlimited User and Printable PDF) |





































