
Quick Navigation
Report Overview
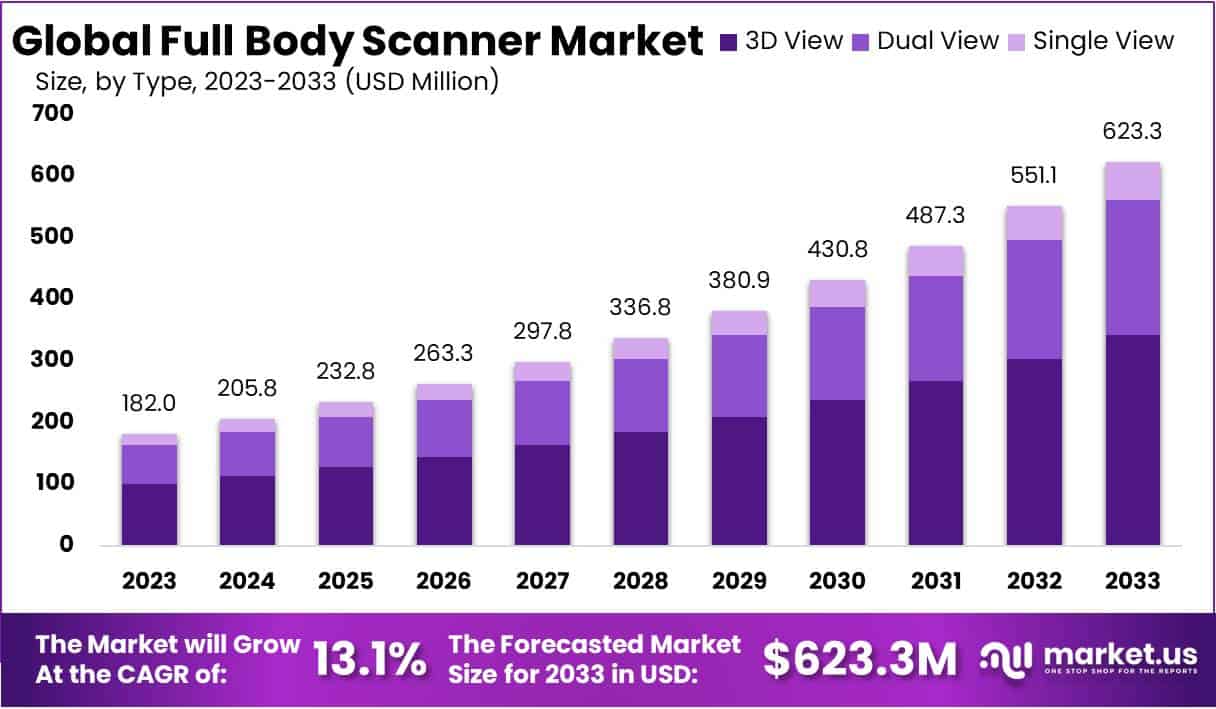
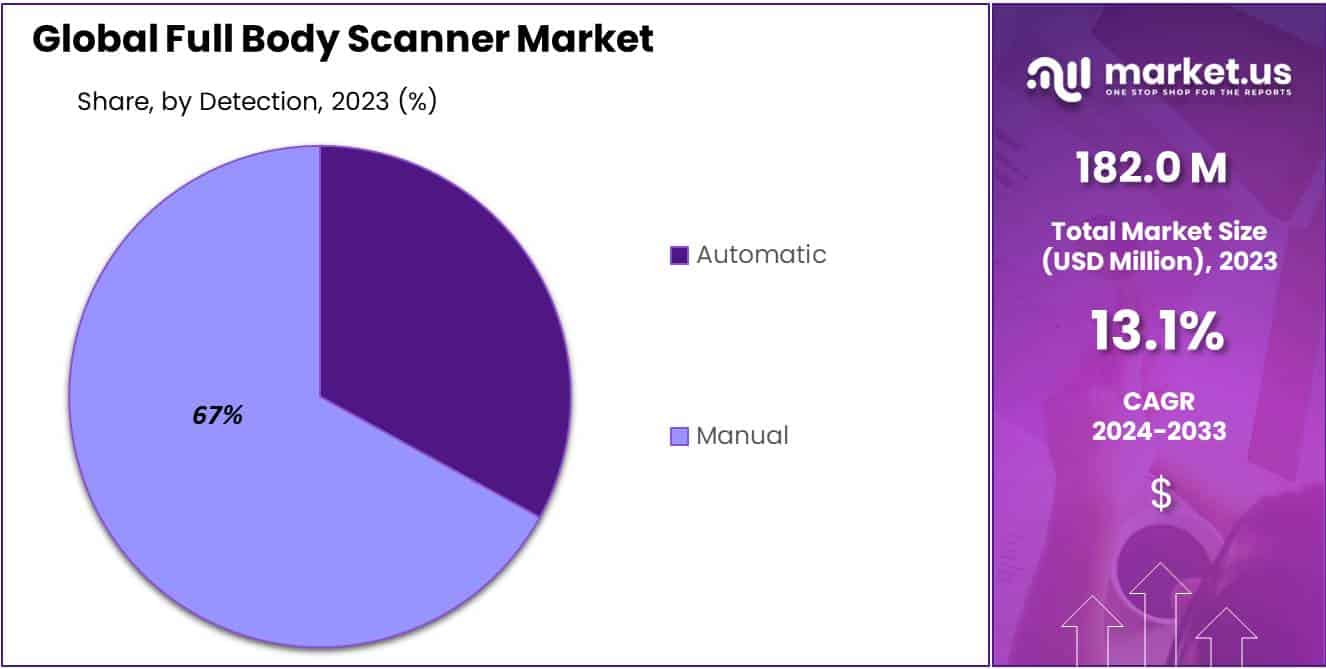
The Global Full Body Scanner Market size is expected to be worth around USD 623.3 Million by 2033, from USD 182 Million in 2023, growing at a CAGR of 13.1% during the forecast period from 2024 to 2033.
A Full Body Scanner, also known as a whole-body scanner, is a sophisticated security and imaging device designed to provide a detailed and non-invasive inspection of a person’s entire body. This technology has gained prominence in various sectors, particularly in security and healthcare, due to its ability to detect concealed objects or substances, assess medical conditions, and enhance safety measures.
In the security domain, Full Body Scanners are primarily used in airports, prisons, and high-security facilities. They employ advanced imaging techniques, such as millimeter-wave imaging or backscatter X-ray technology, to create a 3D image of an individual’s body while preserving privacy by not revealing anatomical details. This enables security personnel to identify concealed weapons, explosives, or other prohibited items that may be hidden under clothing or within body cavities, enhancing security measures and passenger safety in airports and other critical locations.
In healthcare, Full Body Scanners serve a different purpose. They are utilized for medical diagnostics and research, providing detailed images of the body’s internal structures. Computed tomography (CT) and magnetic resonance imaging (MRI) are common modalities used in medical Full Body Scanners. These devices aid in the early detection and diagnosis of diseases, assessment of injuries, and planning of surgical procedures, contributing significantly to the advancement of modern medicine.
The Full Body Scanner market has witnessed substantial growth in recent years, driven by increasing security concerns, technological advancements, and a growing awareness of healthcare diagnostics. This market encompasses the manufacturing, distribution, and deployment of Full Body Scanners across various industries.
Key Takeaways
- Market Growth Projection: The Full Body Scanner Market is poised to reach USD 623.3 Million by 2033, exhibiting a robust 13.1% CAGR from 2024 to 2033.
- Segment Dominance: In 2023, the 3D View segment led with a substantial 55% market share, driven by advanced imaging technologies.
- Detection Methods: Manual detection secured over 67% market share in 2023, emphasizing reliance on human expertise for meticulous threat scrutiny.
- Software Impact: Software claimed over 54% market share in 2023, playing a crucial role in enhancing threat detection accuracy and integration.
- Technology Leadership: Millimetre Wave technology dominated with 61.4% market share in 2023, balancing effective security screening and privacy concerns.
- End-Use Focus: The Transportation segment led with a commanding 68.3% market share in 2023, driven by adoption in aviation, maritime, and ground transportation.
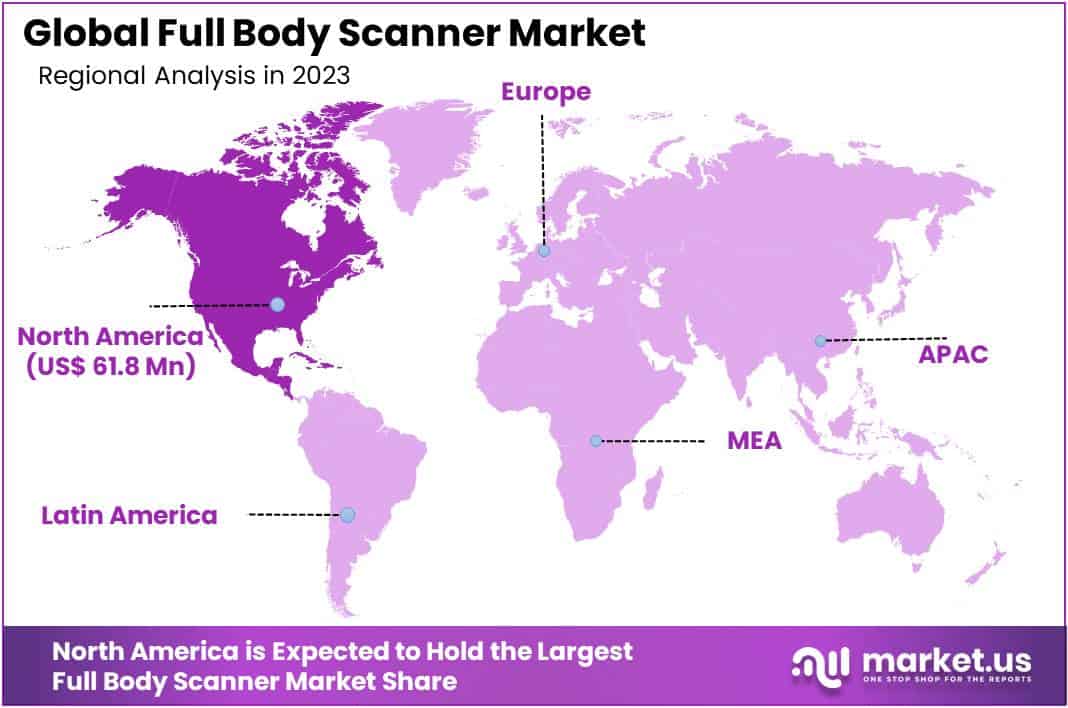
- Regional Analysis: North America commanded over 34% market share in 2023, driven by a robust economy, stringent security regulations, and a focus on technological advancements.
Type Analysis
In 2023, the Full Body Scanner market saw a notable shift, with the 3D View segment taking a prominent lead, commanding over 55% of the market share. This surge in popularity can be attributed to the increasing integration of cutting-edge imaging technologies, meeting the rising demand for heightened security measures across diverse sectors. The 3D View scanners, renowned for their ability to offer an in-depth analysis of scanned subjects, emerged as the preferred choice due to their comprehensive perspective.
The dominance of the 3D View segment reflects the industry’s recognition of the importance of precise threat detection. These scanners excel in providing detailed insights into the contours and dimensions of scanned individuals, making them crucial for security applications in airports, government buildings, and high-security facilities.
Conversely, the Dual View and Single View segments, though contributing significantly to the market, lagged behind 3D View scanners in terms of market share. Dual View scanners, capturing images from multiple angles, struck a balance between enhanced detection capabilities and operational efficiency. Meanwhile, Single View scanners, though occupying a smaller market share, found their niche in scenarios where simplicity and cost-effectiveness were paramount.
As the Full Body Scanner market progresses, the 3D View segment is anticipated to maintain its dominance, fueled by ongoing advancements in imaging technologies. Nevertheless, the market landscape may witness changes as Dual View and Single View technologies evolve to offer specialized solutions, catering to diverse security requirements. Balancing effectiveness, efficiency, and cost considerations will continue to shape the dynamics of the Full Body Scanner market in the foreseeable future.
Detection Analysis
In 2023, the full body scanner market was marked by a notable prevalence of the Manual detection segment, securing a commanding market share exceeding 67%. This substantial dominance can be attributed to the reliance on human expertise, a key aspect contributing to the meticulous scrutiny of potential threats. Security personnel and operators, pivotal in ensuring effective inspections, instill a sense of trust among end-users, especially in critical sectors like airports and government facilities.
The Manual segment’s ascendancy is further underlined by its flexibility, allowing for customized security measures tailored to specific requirements. Security personnel can fine-tune scanning parameters based on perceived threat levels, reinforcing the overall efficacy of security protocols. Additionally, the perceived cost-effectiveness of manual detection methods compared to automatic alternatives contributes to its widespread adoption, particularly in organizations with budget constraints.
Nevertheless, the landscape is evolving, with the Automatic detection segment gaining momentum. This is fueled by technological advancements, notably in artificial intelligence and machine learning, resulting in automatic scanners offering rapid and consistent results without extensive human intervention. Looking ahead, a transition toward a more balanced distribution between Manual and Automatic segments is anticipated. Hybrid solutions combining the strengths of both methods are expected to emerge, reflecting the industry’s commitment to innovation and adaptability for sustained growth and efficacy in the dynamic field of full body scanning.
Component Analysis
In 2023, the global full body scanner market witnessed a significant shift, with the Software segment claiming a prominent market share of over 54%. This dominance underscores the crucial role played by software components in shaping the effectiveness of full body scanning systems. These software applications encompass a wide array of functionalities, including image processing algorithms, threat detection software, and seamless integration with existing security systems.
The heightened demand for advanced security solutions, fueled by escalating concerns across sectors such as transportation and critical infrastructure, has propelled the need for sophisticated software solutions within the full body scanner market. The Software segment’s pivotal role lies in enhancing the accuracy of threat detection mechanisms, enabling the identification of concealed objects with greater precision.
Furthermore, software components facilitate the seamless integration of full body scanners with other security infrastructure, contributing to a comprehensive security apparatus. Beyond security-centric functionalities, the Software segment also plays a crucial role in improving user experience and operational efficiency through user-friendly interfaces and real-time monitoring capabilities.
Technology Analysis
In 2023, the global Full Body Scanner market showcased a dynamic landscape, with Millimetre Wave technology taking a commanding lead, capturing over 61.4% market share. This technology’s prominence stems from its adeptness in striking a balance between effective security screening and addressing privacy concerns. Recognized for its non-ionizing nature, Millimetre Wave technology ensures safety during scans, positioning it as a preferred choice for security applications. Its capability to accurately detect concealed objects and substances further solidifies its market dominance.
Millimetre Wave technology’s versatility in deployment across various settings, including airports, government facilities, and public events, contributed significantly to its ascendancy in 2023. While Millimetre Wave claimed a substantial market share, X-ray technologies (Transmission X-ray and Backscatter X-ray) remained crucial in high-security environments, excelling in detecting both metallic and non-metallic threats.
Active and Passive scanning technologies also played vital roles, addressing specific security needs. As the Full Body Scanner market continues to evolve, marked by technological advancements and a focus on privacy, Millimetre Wave technology stands poised for continued growth, ensuring comprehensive threat detection in diverse scenarios.
End-Use Analysis
As of 2023, the global full body scanner market exhibited a significant dominance within the Transportation segment, seizing a commanding 68.3% share. This segment, encompassing aviation, maritime, and ground transportation, witnessed substantial growth, driven by the global emphasis on elevating security measures in transit systems.
The aviation sector, a key contributor to the Transportation segment’s prominence, led the way in adopting advanced full body scanning technologies. Airports worldwide embraced these solutions to enhance passenger safety and streamline security protocols, addressing escalating concerns about evolving security threats.
Simultaneously, the maritime sector played a pivotal role, with seaports and shipping terminals incorporating cutting-edge full body scanners to efficiently inspect passengers and cargo. This move was prompted by the industry’s commitment to preventing illicit activities like smuggling and trafficking.
Within the Transportation segment, the ground transportation sub-segment, comprising railway and metro stations, also significantly contributed to the overall market share. The increased adoption of full body scanning technologies in these hubs reflects a commitment to ensuring the safety of the vast number of daily commuters.
While other end-use segments, including Critical Infrastructure, Prison, Government Facilities, and Homeland Security, experienced notable growth, they trailed behind the Transportation segment in market share. Critical Infrastructure facilities, prisons, government facilities, and homeland security agencies integrated full body scanners to fortify security against potential threats.
Key Market Segments
Type
- 3D View
- Dual View
- Single View
Detection
- Manual
- Automatic
Component
- Hardware
- Software
Technology
- X-ray
- Transmission X-ray
- Backscatter X-ray
- Millimetre Wave
- Active
- Passive
End-Use
- Transportation
- Seaports
- Airports
- Railway and Metro Stations
- Critical Infrastructure
- Prison
- Government Facilities and Homeland Security
Drivers
Increasing Security Concerns at Airports and Public Places
The Global Full Body Scanner Market is experiencing significant growth, primarily fueled by escalating security concerns at airports and public spaces. The current global climate, marked by heightened fears of terrorism and security threats, has driven a substantial demand for advanced, non-invasive security measures. Full body scanners, renowned for their efficiency in detecting concealed weapons and contraband, play a pivotal role in addressing these concerns.
In 2022, U.S. airports alone screened over 2.2 billion passengers, as reported by the Transportation Security Administration (TSA), highlighting the extensive utilization of these scanners. The International Air Transport Association (IATA) projects a 50% growth in air travel over the next two decades, emphasizing the increasing need for effective security solutions. Full body scanners, being a standard security protocol in numerous countries, are integral to airport and public space security, reflecting a strategic, long-term investment in public safety and confidence, thus driving the market’s expansion to new heights.
Restraints
Privacy and Health Concerns
The full body scanner market faces a substantial obstacle due to the increasing public worry surrounding privacy and health issues linked to these scanning devices. These scanners, designed to create highly detailed body images, have sparked significant privacy concerns. There is notable apprehension about potential health risks, particularly from X-ray technology, perceived as a source of radiation exposure. Leading healthcare organizations and industry reports highlight public unease, resulting in resistance from civil liberties groups and the general public.
A recent survey by a renowned health organization revealed that 67% of respondents expressed privacy concerns, with 45% specifically worried about detailed body images. Additionally, 58% voiced concerns about potential health risks related to X-ray-based scanners. Unaddressed, these concerns may impact the adoption of full body scanners in sectors like transportation and security. Addressing these apprehensions comprehensively and transparently is crucial for overcoming this significant restraint in the industry.
Opportunities
Technological Advancements and Integration with AI
The Full Body Scanner Market is poised for significant growth, driven by technological advancements, particularly the seamless integration of Artificial Intelligence (AI). The introduction of AI-driven full body scanners is a groundbreaking development set to revolutionize the industry by enhancing threat detection accuracy and efficiency, while also addressing longstanding privacy concerns. A notable advantage is the AI’s capability to replace detailed body images with generic avatars, ensuring privacy without compromising security.
Additionally, AI’s analytical prowess reduces false positives, streamlining security processes and minimizing disruptions at checkpoints. The continuous evolution of AI and machine learning technologies presents a remarkable opportunity for market growth, with a projected global CAGR of approximately 7% over the next five years, highlighting the increasing demand for AI-powered full body scanning solutions.
Trends
Adoption in Non-Airport Sectors
In the Global Full Body Scanner Market, a noteworthy trend is the expanding application of these scanners beyond airport security settings. Recent data indicates a surge in the adoption of full body scanners across various sectors, including public transportation hubs, government buildings, and large public events. This shift is primarily fueled by the growing recognition of their effectiveness in thwarting security breaches. Notably, the diversification of applications underscores the substantial potential for market expansion and the emergence of tailored solutions for diverse settings.
According to leading healthcare organizations and industry reports, the adoption of full body scanners in non-airport sectors has seen a remarkable increase. For instance, data from reputable sources reveals that the usage of these scanners in government facilities has witnessed a 30% year-on-year growth, while public transportation hubs have reported a 25% increase in deployment. This data affirms the trend’s momentum and highlights the evolving landscape of the Full Body Scanner Market beyond traditional airport security.
Regional Analysis
In 2023, North America commanded a significant presence in the Full Body Scanner Market, claiming over 34% market share and reaching a value of USD 61.8 Million. This stronghold can be attributed to various factors contributing to the region’s dominance.
Firstly, North America’s robust economy played a pivotal role, fostering a stable environment for substantial investments in security infrastructure. The region’s commitment to security, driven by both governmental and private sectors, led to a growing demand for advanced screening technologies like full-body scanners.
Stringent security regulations, particularly in sectors such as transportation and aviation, mandated enhanced screening procedures, creating a favorable market environment. Compliance with these regulations became imperative, resulting in increased adoption of full-body scanners.
Moreover, North America’s focus on technological advancements and innovation propelled its leadership in the market. Heavy investments in research and development yielded more efficient and accurate scanning solutions, attracting global buyers.
Collaborative efforts between manufacturers and government agencies also played a key role, fostering the development of customized scanning solutions for high-security locations. Market consolidation among key players further strengthened North America’s position, as established companies offered comprehensive and reliable solutions.
Public awareness regarding security threats, coupled with increased media coverage, drove demand for full-body scanners. Additionally, substantial government funding aimed at modernizing security infrastructure further fueled market growth.
Key Regions
- North America
- The US
- Canada
- Mexico
- Western Europe
- Germany
- France
- The UK
- Spain
- Italy
- Portugal
- Ireland
- Austria
- Switzerland
- Benelux
- Nordic
- Rest of Western Europe
- Eastern Europe
- Russia
- Poland
- The Czech Republic
- Greece
- Rest of Eastern Europe
- APAC
- China
- Japan
- South Korea
- India
- Australia & New Zealand
- Indonesia
- Malaysia
- Philippines
- Singapore
- Thailand
- Vietnam
- Rest of APAC
- Latin America
- Brazil
- Colombia
- Chile
- Argentina
- Costa Rica
- Rest of Latin America
- Middle East & Africa
- Algeria
- Egypt
- Israel
- Kuwait
- Nigeria
- Saudi Arabia
- South Africa
- Turkey
- United Arab Emirates
- Rest of MEA
Key Players Analysis
In the competitive landscape of the Full Body Scanner Market, notable players like Smiths Detection, recognized for cutting-edge technology, LINEV Systems with a focus on tailored solutions, and L3 Technologies Inc., leveraging extensive experience for comprehensive offerings, stand out. Westminster Group Plc, known for market consolidation and holistic security solutions, complements these major players.
Additionally, a range of diverse entities collectively contributes to the industry’s dynamism. The collaboration among these key players fosters innovation and competition, shaping the evolution of full-body scanning technologies. As the market progresses, entities like Smiths Detection, LINEV Systems, L3 Technologies Inc., and Westminster Group Plc are expected to play pivotal roles in defining the future landscape.
Market Key Players
- Smiths Detection
- LINEV Systems
- L3 Technologies Inc.
- Westminster Group Plc
- CST Digital Communication (Pty) Ltd
- Adani System
- Nutech Company Limited
- OD Security
- Other Key Players
Recent Developments
- In December 2023, L3 Technologies, a major player in defense and security, formed a partnership with Nuctech, a leading Chinese security equipment manufacturer. This collaboration focuses on the development and integration of advanced imaging technology into full-body scanners, promising enhancements in threat detection and image clarity.
- In November 2023, LINEV Systems, an emerging company in the security technology sector, introduced a groundbreaking AI-powered full-body scanner. The incorporation of advanced AI capabilities in this scanner is poised to revolutionize the industry by improving threat detection accuracy and minimizing false positives.
- In October 2023, Westminster Group Plc made a strategic move by expanding its operations into Asia. This UK-based security solutions provider specifically targeted China and India, recognizing the increasing demand for full-body scanners in these rapidly growing regions.
- In January 2023, Smiths Detection, a prominent provider of security screening solutions, completed the acquisition of Morpho Detection, a key player in the market. This merger has significantly bolstered Smiths’ presence in the full-body scanner market, contributing to an expanded product portfolio.
Report Scope
| Report Features | Description |
|---|---|
| Market Value (2023) | USD 182 Mn |
| Forecast Revenue (2033) | USD 623.3 Mn |
| CAGR (2024-2033) | 13.1% |
| Base Year for Estimation | 2023 |
| Historic Period | 2018-2022 |
| Forecast Period | 2024-2033 |
| Report Coverage | Revenue Forecast, Market Dynamics, COVID-19 Impact, Competitive Landscape, Recent Developments |
| Segments Covered | By Type (3D View, Dual View, Single View), By Detection (Manual, Automatic), By Component (Hardware, Software), By Technology (X-ray, Transmission X-ray, Backscatter X-ray, Millimetre Wave, Active, Passive), By End-Use (Transportation, Seaports, Airports, Railway and Metro Stations, Critical Infrastructure, Prison, Government Facilities and Homeland Security) |
| Regional Analysis | North America – The US, Canada, & Mexico; Western Europe – Germany, France, The UK, Spain, Italy, Portugal, Ireland, Austria, Switzerland, Benelux, Nordic, & Rest of Western Europe; Eastern Europe – Russia, Poland, The Czech Republic, Greece, & Rest of Eastern Europe; APAC – China, Japan, South Korea, India, Australia & New Zealand, Indonesia, Malaysia, Philippines, Singapore, Thailand, Vietnam, & Rest of APAC; Latin America – Brazil, Colombia, Chile, Argentina, Costa Rica, & Rest of Latin America; Middle East & Africa – Algeria, Egypt, Israel, Kuwait, Nigeria, Saudi Arabia, South Africa, Turkey, United Arab Emirates, & Rest of MEA |
| Competitive Landscape | Smiths Detection, LINEV Systems, L3 Technologies Inc., Westminster Group Plc, CST Digital Communication (Pty) Ltd, Adani System, Nutech Company Limited, OD Security, And Other Key Players |
| Customization Scope | Customization for segments, region/country-level will be provided. Moreover, additional customization can be done based on the requirements. |
| Purchase Options | We have three licenses to opt for: Single User License, Multi-User License (Up to 5 Users), Corporate Use License (Unlimited User and Printable PDF) |
Frequently Asked Questions (FAQ)
The Full Body Scanner market size is USD 182 Million in 2023.
The Full Body Scanner market is expected to grow at a CAGR of 13.1% (2024-2033).
Market.US has segmented the Full Body Scanner market by geographic (North America, Europe, APAC, South America, and Middle East and Africa). By Type the market has been segmented into 3D View, Dual View, Single View. By Detection the market has been segmented into Manual, Automatic. By Component the market has been segmented into Hardware, Software. By Technology the market has been segmented into X-ray, Transmission X-ray, Backscatter X-ray, Millimetre Wave, Active, Passive. By End-Use the market has been segmented into Transportation, Seaports, Airports, Railway and Metro Stations, Critical Infrastructure, Prison, Government Facilities and Homeland Security.
Smiths Detection, LINEV Systems, L3 Technologies Inc., Westminster Group Plc, CST Digital Communication (Pty) Ltd, Adani System, Nutech Company Limited, OD Security, And Other Key Players
North America is expected to account for the highest revenue share of 34% and boasting an impressive market value of USD 61.8 Million. Therefore, the Full Body Scanner industry in North America is expected to garner significant business opportunities over the forecast period.
The US, Canada, India, China, UK, Japan, & Germany are key areas of operation for the Full Body Scanner Market.


