


Report Overview
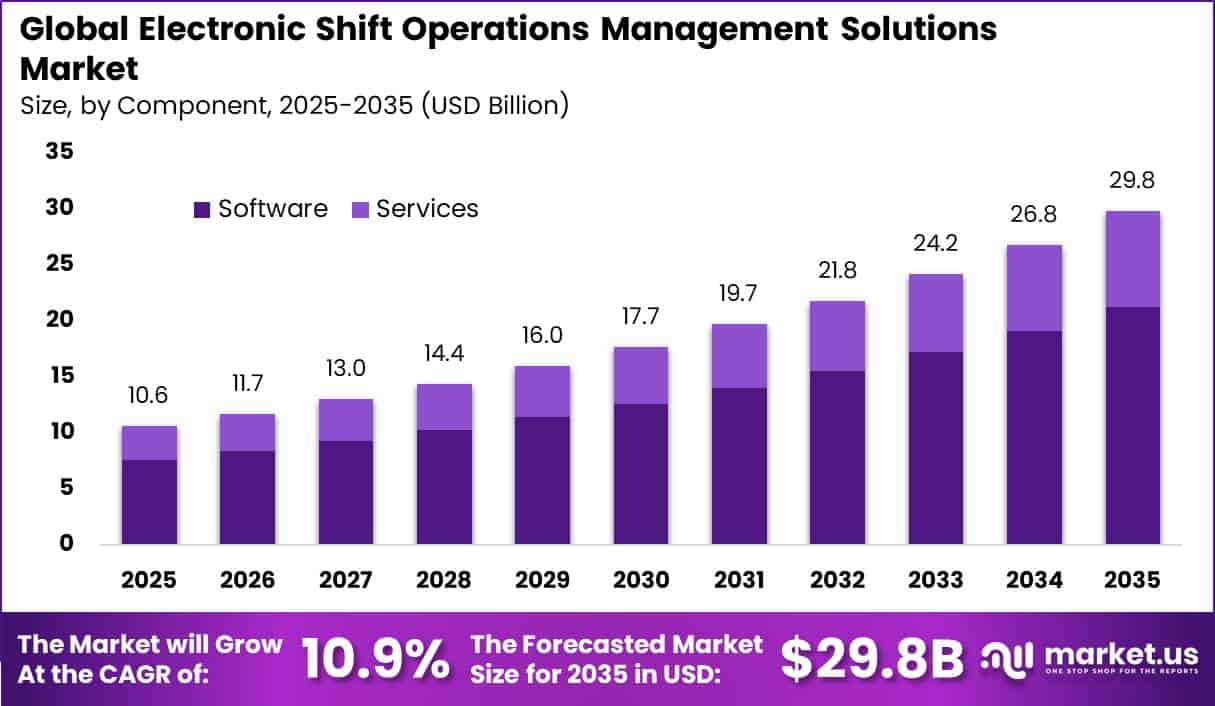
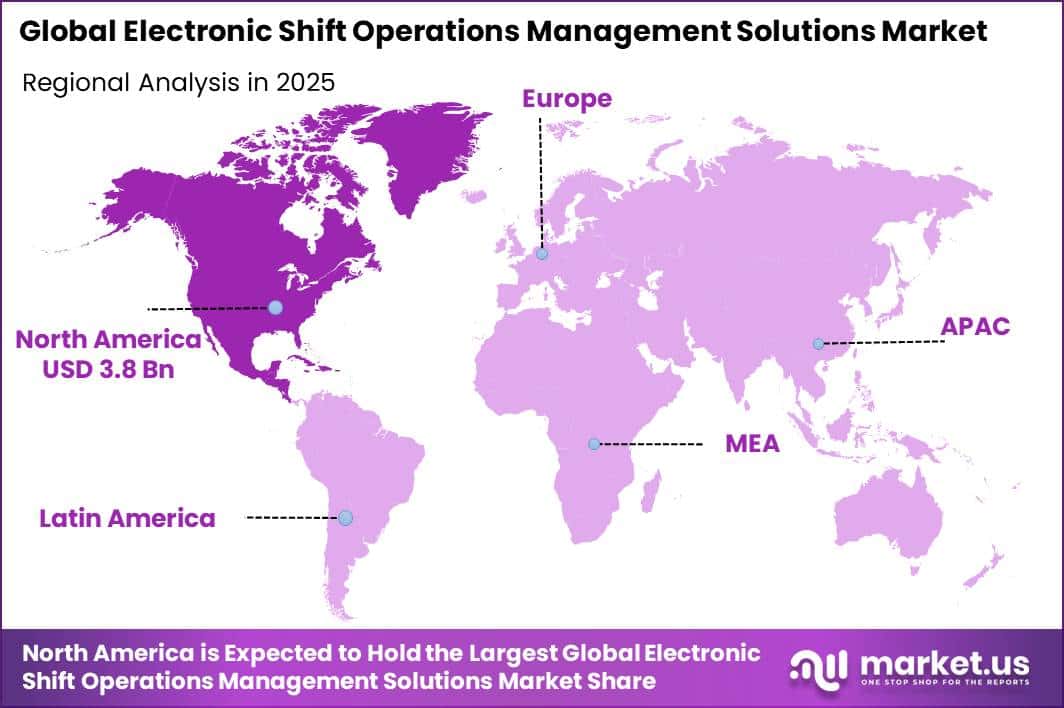
In 2025, the Global Electronic Shift Operations Management Solutions (eSOMS) Market was valued at USD 10.6 billion. The market is projected to grow at a CAGR of 10.9% during 2026–2035, reaching approximately USD 29.8 billion by 2035. North America dominated the global market in 2025, accounting for more than 35.1% of the total market share and generating approximately USD 3.8 billion in revenue.
Market growth is supported by the continued expansion of power generation and grid infrastructure, where eSOMS platforms help utilities and power plants manage shift handovers, equipment status, operating records, and compliance activities. Global electricity demand increased by 4.3% in 2024, adding more than 1,080 TWh of consumption.
Global electricity generation also rose by over 1,200 TWh in 2024, with renewable and nuclear power contributing more than 80% of this increase. Renewable capacity additions grew by 25% to nearly 700 GW in 2024, marking the 22nd consecutive year of record expansion. Nuclear power also remains an important operating base, with 417 reactors, representing 377 GW of installed capacity and producing 2,617.5 TWh in 2024, while another 77 reactors were under construction.
The growing number of power assets increases the need for digital control-room and shift-management systems. In the United States alone, around 20.2 GW of new generating capacity was added during the first half of 2024, supporting stronger adoption of eSOMS solutions for operational coordination, safety, and regulatory compliance.
Key Takeaway
- The Electronic Shift Operations Management Solutions Market was valued at USD 10.6 billion in 2025 and is projected to reach USD 29.8 billion by 2035, growing at a CAGR of 10.9%.
- The Software segment was dominated by Component with a 71.3% share, driven by real-time digital shift-management adoption.
- The On-premises segment was led by Deployment with a 57.2% share, supported by strict cybersecurity and regulatory isolation requirements.
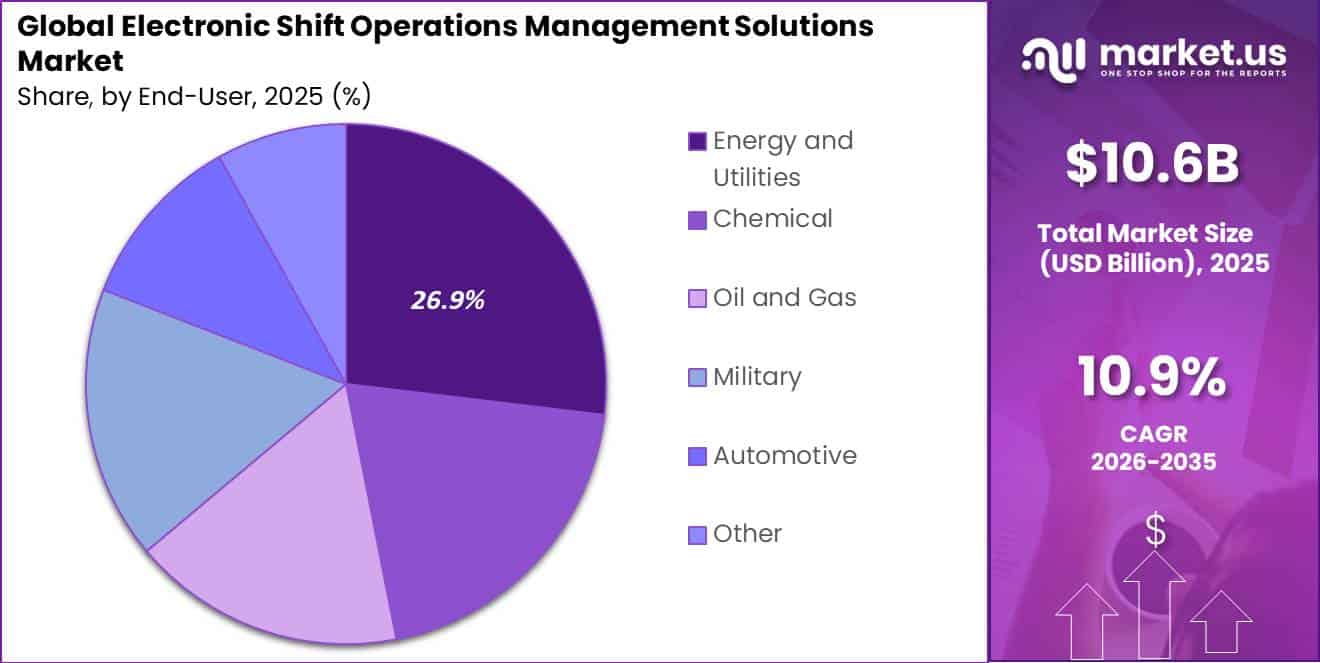
- Energy and Utilities was the leading End-User segment with a 26.9% share, reflecting the sector’s large operating workforce.
- North America led the market in 2025 with a 35.1% share, generating around USD 3.8 billion in revenue.
By Component
The Software segment held a dominant 71.3% share, supported by the growing use of digital control-room platforms for shift management, analytics, equipment tracking, and regulatory compliance. Unlike hardware, software enables operators to update records in real time, manage complex workflows, and improve coordination between shifts.
The U.S. operates more than 12,538 utility-scale power plants across 25,378 generators, creating a large operating base that requires continuous monitoring and digital record management. Investment in grid digitalization is also strengthening demand for eSOMS software. Global digital grid investment reached USD 47 billion in 2016 and has increased by more than 20% annually since then.
Around 75% of this investment has been directed toward distribution-grid software and monitoring solutions. At the same time, global grid investment is expected to rise from USD 330 billion to nearly USD 750 billion by 2030. This expansion increases the need for software that can manage operating data, compliance records, and shift handovers.
By Deployment
The On-premises segment held a dominant 57.2% share, mainly because critical power infrastructure requires strong cybersecurity, controlled access, and reliable local operations. Under 10 CFR 73.54, the U.S. Nuclear Regulatory Commission requires nuclear power plants to isolate safety, security, and emergency-preparedness computer systems from external networks.
Cybersecurity rules across the wider power sector also support on-premises deployment. The North American Electric Reliability Corporation enforces Critical Infrastructure Protection standards across more than 1,492 registered U.S. bulk-power entities, including requirements for defined electronic security perimeters around important control systems.
By End-User
The Energy and Utilities segment held a dominant 26.9% share, supported by the sector’s large workforce and continuous operating requirements. Global power sector employment exceeded 21 million workers in 2023, including around 9.7 million workers involved in operating and maintaining existing power plants and grid infrastructure.
Each shift change requires accurate transfer of equipment status, alarms, maintenance updates, and safety information. Digital shift management systems help utilities reduce errors and maintain clear operating records between teams. Nearly 92% of the global population has access to electricity, increasing pressure on utilities to maintain stable and uninterrupted power supply.
Key Market Segments
By Component
- Software
- Services
By Deployment
- On-premises
- Cloud-based
By End-User
- Energy and Utilities
- Chemical
- Oil and Gas
- Military
- Automotive
- Other
Geopolitical Impact Analysis
Rising US-China semiconductor tariffs are increasing hardware and server costs for eSOMS providers. China supplies about 30% of global mature-node semiconductor chips, while the United States has imposed a 50% tariff on semiconductors and a 25% Section 232 duty on certain chip-containing derivative products, effective from January 2026.
In addition, a 15% tariff on imported polysilicon took effect in August 2026, adding further cost pressure on components used in data centers, servers, and on-premises eSOMS infrastructure. These measures can increase procurement costs for vendors that depend on imported electronic components.
Global shipping disruptions are creating additional pressure. UNCTAD reported that ship tonnage passing through the Red Sea remained around 70% below 2023 averages through early 2025. Rerouting vessels around the Cape of Good Hope contributed to higher freight costs, while the Shanghai Containerized Freight Index increased 149% year-on-year in 2024.
Trade conditions may also affect utility-sector investment. The World Trade Organization expects global merchandise trade growth to slow to 1.9% in 2026, compared with 4.6% in 2025, and potentially fall to 1.4% if oil and LNG prices remain high. Together, higher tariffs, freight costs, and energy prices are encouraging eSOMS vendors to strengthen regional sourcing, reduce hardware dependence, and adjust software and service pricing to protect margins.
Regional Analysis
North America held the leading position in the global eSOMS market in 2025, accounting for 35.1% of total revenue and generating around USD 3.8 billion. The region benefits from strict NRC and NERC compliance requirements, which encourage utilities and nuclear operators to replace paper-based processes with digital shift-logging and control-room systems.
Continuous investment in grid modernization also supports demand. The region added around 20.2 GW of new generating capacity during the first half of 2024, increasing the need for modern operating software across power facilities. Europe remains another important market, supported by strong nuclear safety standards and grid regulations, although its growth is relatively slower.
Asia Pacific is expected to be the fastest-growing regional market, driven by strong electricity demand and rapid expansion of generation capacity. China’s installed power generation capacity reached 3,349 GW in 2024, increasing 14.6% year-on-year, while electricity consumption rose 7%, adding more than 550 TWh in a single year.
India’s electricity demand increased 5.8% in 2024 and is projected to grow by 6.3% annually through 2027. China alone is expected to contribute nearly 50% of global electricity demand growth through 2027. This rapid expansion of power plants and grid assets is increasing the need for digital shift management, equipment monitoring, and compliance platforms, positioning Asia Pacific as a major growth center for the eSOMS market.
Key Regions and Countries
North America
- US
- Canada
Europe
- Germany
- France
- The UK
- Spain
- Italy
- Rest of Europe
Asia Pacific
- China
- Japan
- South Korea
- India
- Australia
- Rest of APAC
Latin America
- Brazil
- Mexico
- Rest of Latin America
Middle East & Africa
- GCC
- South Africa
- Rest of MEA
Market Dynamics
Drivers
| Driver | (~) % CAGR | Geographic Relevance | Impact Timeline |
|---|---|---|---|
| Grid modernization capex cycle | +2.8% | North America, Europe | Short term (2 years or less) |
| Mandatory NERC CIP shift-logging compliance | +2.1% | North America | Short term (2 years or less) |
| Nuclear fleet digitalization push | +1.9% | North America, Asia Pacific | Medium term (2 to 4 years) |
| Renewable capacity connection surge | +1.6% | Asia Pacific, Europe | Short term (2 years or less) |
| SaaS licensing transition among utilities | +1.3% | Global | Medium term (2 to 4 years) |
| Aging utility workforce replacement pressure | +1.2% | North America, Europe | Medium term (2 to 4 years) |
Grid modernization capex cycle
Global utility capital spending on grid infrastructure is around USD 400 billion annually and is expected to rise by about 50% by 2030. A growing share is being directed toward control-room and operations software, expanding demand for eSOMS platforms. The addition of nearly 700 GW of renewable capacity in 2024 has further increased the need for digital monitoring and shift-handover systems.
The move toward SaaS-based eSOMS can shorten deployment cycles from several months to a few weeks, reducing customer acquisition costs by an estimated 15% to 20% per contract. It may also improve gross margins by around 300 to 500 basis points, while helping utilities lower upfront software costs and adopt digital shift-management tools more easily.
Restraints
| Restraint | (~) % CAGR | Geographic Relevance | Impact Timeline |
|---|---|---|---|
| Elevated interest rate financing costs | -1.4% | Global | Short term (2 years or less) |
| Air-gapped network isolation mandates | -1.1% | North America | Short term (2 years or less) |
| Semiconductor and server hardware tariffs | -0.9% | North America, Asia Pacific | Short term (2 years or less) |
| Legacy SCADA integration lock-in | -0.7% | Global | Medium term (2 to 4 years) |
Elevated interest rate financing costs
Publicly owned and cooperative utilities, which often finance infrastructure and IT modernization through municipal or project bonds, continue to face higher borrowing costs than before 2022. This increases the cost of capital for discretionary software investments such as eSOMS.
Utility CFOs are therefore prioritizing mandatory grid-hardening and generation projects, especially when expected project returns fall below around 8% to 9%, which can delay eSOMS purchasing decisions by an estimated 6 to 12 months among small and mid-sized municipal utilities.
As utilities spread investments over longer periods, average deal sizes in rate-constrained segments may decline by an estimated 10% to 15%. Until financing conditions improve, higher borrowing costs are likely to remain a key barrier to faster eSOMS adoption.
Challenges
| Challenge | (~) % CAGR | Geographic Relevance | Mitigation Horizon |
|---|---|---|---|
| Skilled OT-IT talent shortage | -1.3% | Global | Long term (4 years or more) |
| Cybersecurity threat surface expansion | -1.0% | North America, Europe | Medium term (2 to 4 years) |
| Fragmented regional compliance standards | -0.8% | Asia Pacific, Europe | Medium term (2 to 4 years) |
| Freight and component lead-time volatility | -0.6% | Global | Short term (2 years or less) |
| Multi-vendor system interoperability gaps | -0.5% | Global | Medium term (2 to 4 years) |
Skilled OT-IT talent shortage
Global power-sector employment exceeded 21 million workers in 2023, with nearly 9.7 million working in operations and maintenance. However, an aging control-room workforce is creating a shortage of employees who understand both operational technology and modern digital shift-management systems.
This skills gap can make eSOMS deployments take an estimated 20% to 30% longer than typical enterprise software rollouts and may raise professional-services costs by around 200 to 400 basis points. Vendors are responding with simpler low-code interfaces and AI-assisted handover tools, while utilities continue investing in training and apprenticeship programs.
Opportunities
| Opportunity | (~) % CAGR | Geographic Relevance | Execution Window |
|---|---|---|---|
| AI-driven predictive handover analytics | +2.0% | Global | Medium term (2 to 4 years) |
| Emerging-market electrification white space | +1.7% | Asia Pacific, Africa | Long term (4 years or more) |
| Adjacent process-industry cross-sell | +1.3% | Global | Medium term (2 to 4 years) |
| Mid-market utility roll-up consolidation | +1.0% | North America, Europe | Long term (4 years or more) |
| Outcome-based pricing monetization models | +0.8% | Global | Medium term (2 to 4 years) |
AI-driven predictive handover analytics
Current eSOMS platforms are still mainly used for record-keeping and shift logging. Predictive analytics remains a largely untapped area, with fewer than an estimated 15% of installed platforms using machine-learning-based anomaly forecasting.
Adding predictive analytics could move eSOMS from a passive compliance tool to an active decision-support platform. Premium analytics tiers could carry an estimated 25% to 35% price premium over basic licenses and improve blended gross margins by around 400 to 600 basis points, supporting higher-value software revenue with limited additional delivery cost.
Key Players Analysis
The eSOMS market is led by large industrial automation companies with strong capabilities in process control, digital operations, and industrial software. ABB Ltd. reported USD 33.2 billion in FY2025 revenue, up 9%, while its Automation business generated USD 8.08 billion. ABB also invested USD 1.3 billion, equal to 4.0% of revenue, in non-order-related R&D.
Siemens AG recorded EUR 78.9 billion in FY2025 revenue, while its Digital Industries software business contributed EUR 6.1 billion. Its digital business expanded at a 12% five-year CAGR to reach EUR 9.4 billion.
Emerson Electric reported USD 18.0 billion in 2025 sales, with Control Systems & Software representing 24% of sales and Automation contributing 88% of segment EBITA. Honeywell generated USD 37.4 billion in FY2025 sales, including USD 6.4 billion from its Process Automation and Technology segment.
Enterprise software companies are also strengthening competition. IBM reported USD 67.5 billion in FY2025 revenue, with Software contributing USD 29.9 billion, or 44% of total revenue. IBM invested USD 8.3 billion, equal to 12.3% of revenue, in R&D. Oracle generated USD 57.4 billion in FY2025 revenue, with cloud services accounting for 43%, while R&D spending reached USD 9.8 billion, up 10.6% year-over-year.
Top Key Players in the Market
- Hexagon AB
- ABB Ltd.
- Siemens AG
- Conmitto, Inc.
- Globorise Technologies LLC
- Hitachi Energy Ltd
- Yokogawa Electric Corporation
- Schneider Electric SE
- Emerson Electric Co.
- Honeywell International Inc.
- IBM Corporation
- Oracle Corporation
Recent Developments
- In 2026, Cadence Design Systems completed the acquisition of Hexagon AB’s Design & Engineering business. The transaction was originally valued at approximately EUR 2.7 billion, with 70% of the consideration structured in cash and 30% in Cadence shares. The acquired business generated around USD 280 million in 2024 revenue and employed more than 1,100 people.
- In 2025, ABB signed an agreement to sell its Robotics division to SoftBank Group for an enterprise value of USD 5.3 billion. ABB decided to discontinue its earlier plan to separately list the robotics business and instead concentrate its portfolio more strongly around electrification, process automation, and related digital technologies. The transaction is expected to generate approximately USD 5.3 billion in net cash proceeds and was targeted for completion during mid-to-late 2026.
Report Scope
| Report Features | Description |
|---|---|
| Market Value (2025) | USD 10.6 Billion |
| Forecast Revenue (2035) | USD 29.8 Billion |
| CAGR (2026-2035) | 10.9% |
| Base Year for Estimation | 2025 |
| Historic Period | 2020-2024 |
| Forecast Period | 2026-2035 |
| Report Coverage | Revenue Forecast, Market Dynamics, Competitive Landscape, Recent Developments |
| Segments Covered | By Component (Software, Services), By Deployment (On-premises, Cloud-based), By End-User (Energy and Utilities, Chemical, Oil and Gas, Military, Automotive, Other) |
| Regional Analysis | North America – US, Canada; Europe – Germany, France, The UK, Spain, Italy, Rest of Europe; Asia Pacific – China, Japan, South Korea, India, Australia, Singapore, Rest of APAC; Latin America – Brazil, Mexico, Rest of Latin America; Middle East & Africa – GCC, South Africa, Rest of MEA |
| Competitive Landscape | Hexagon AB, ABB Ltd., Siemens AG, Conmitto, Inc., Globorise Technologies LLC, Hitachi Energy Ltd., Yokogawa Electric Corporation, Schneider Electric SE, Emerson Electric Co., Honeywell International Inc., IBM Corporation, Oracle Corporation |
| Customization Scope | Customization for segments, region/country-level will be provided. Moreover, additional customization can be done based on the requirements. |
| Purchase Options | We have three licenses to opt for: Single User License, Multi-User License (Up to 5 Users), Corporate Use License (Unlimited Users and Printable PDF) |





























