


Quick Navigation
Report Overview
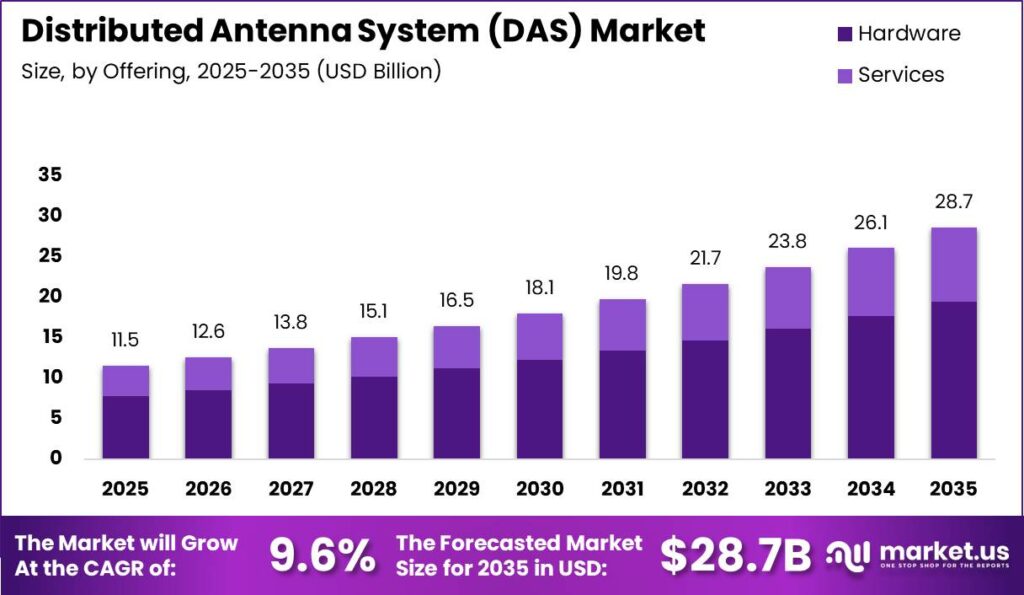
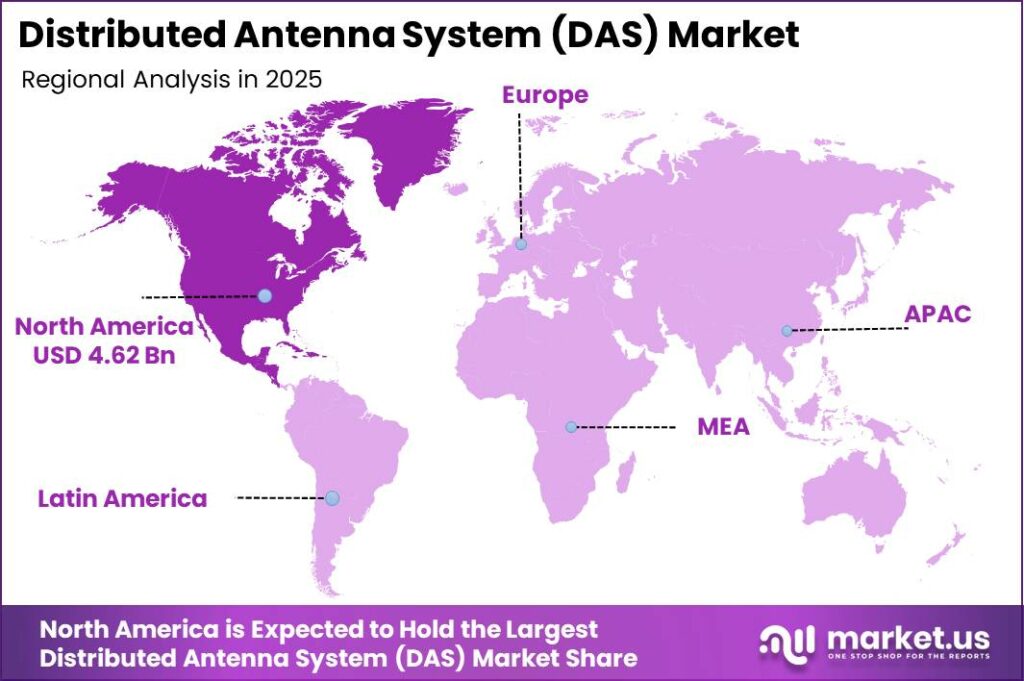
In 2025, the Global Distributed Antenna System (DAS) Market was valued at USD 11.5 billion. The market is projected to grow at a CAGR of 9.6% from 2026 to 2035, reaching approximately USD 28.7 billion by 2035. North America dominated the global market in 2025, accounting for more than 40.02% of the total market share and generating approximately USD 4.62 billion in revenue.
The growth of the DAS market is mainly driven by the rapid adoption of 5G technology and the increasing requirement for strong indoor wireless connectivity. According to the International Telecommunication Union (ITU), 5G networks covered approximately 55% of the global population in 2025, showing significant expansion from early deployments in 2019.
In addition, the GSMA Global Mobile Trends 2026 report highlights that global 5G connections reached nearly 2.8 billion, representing more than 30% of total mobile connections worldwide. As 70% to 80% of mobile data traffic is generated inside buildings, according to Ericsson’s Mobility Report, demand for DAS solutions is increasing to overcome indoor signal challenges caused by concrete, glass, and steel structures.
North America maintains a leading market position due to strong telecom investments, government funding, and regulatory requirements for in-building connectivity. The U.S. Infrastructure Investment and Jobs Act (IIJA) allocated USD 65 billion for broadband deployment and connectivity improvements, supporting wireless infrastructure expansion. Additionally, the FCC C-band Spectrum Auction 107 generated USD 81.2 billion in winning bids, reflecting strong investment in next-generation networks.
Many U.S. cities and counties also require Public Safety DAS systems to achieve 95% to 99% in-building coverage for emergency responders in large structures. Furthermore, GSMA estimates that mobile technologies in North America contribute nearly USD 1.6 trillion in economic value, equivalent to approximately 5% of GDP, supporting continued DAS investments through 2035.
Key Takeaway
- The Global Distributed Antenna System (DAS) Market was valued at USD 11.5 Billion in 2025 and is projected to reach USD 28.7 Billion by 2035, growing at a CAGR of 9.6%.
- Hardware dominated the offering segment with a 67.89% market share, driven by increasing demand for DAS equipment and infrastructure deployment.
- Active DAS led the technology segment with a 46.30% share, owing to its superior coverage, scalability, and performance capabilities.
- Carrier Ownership accounted for the largest ownership segment with a 38.67% share, supported by telecom operators’ investments in network enhancement.
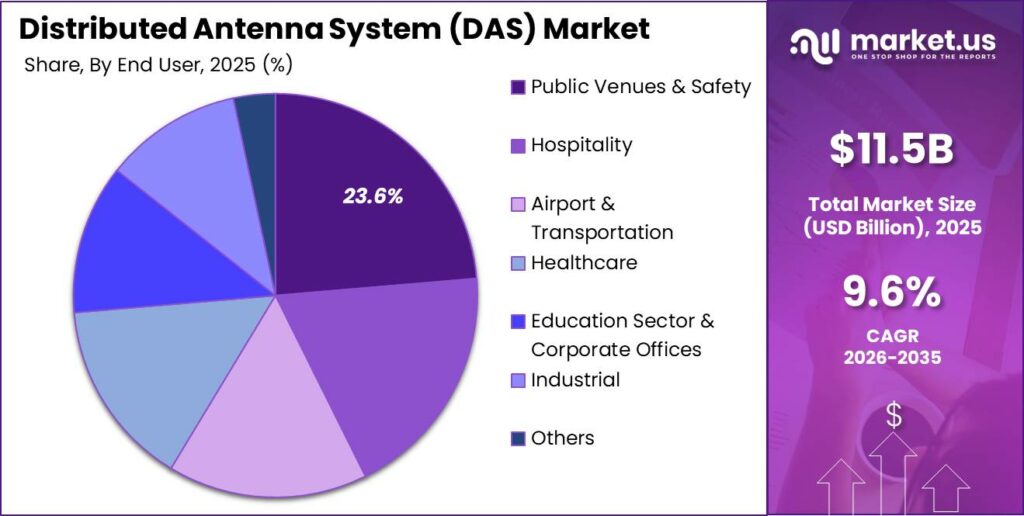
- Public Venues & Safety represented the leading end-user segment with a 23.65% share, driven by the need for reliable indoor connectivity and emergency communication systems.
- North America held the largest regional market share at 40.02%, generating approximately USD 4.62 Billion in 2025, supported by advanced wireless infrastructure adoption.
By Offering
The Hardware segment leads the Distributed Antenna System (DAS) market with 67.89%, as DAS deployments rely heavily on physical infrastructure, including antennas, remote radio units, head-end equipment, cabling, power systems, and network enclosures. These components represent the largest portion of project investment for in-building and large venue connectivity upgrades.
The broader in-building wireless infrastructure market is valued at USD 20.72 billion in 2026, with infrastructure components such as DAS, small cells, repeaters, and Wi-Fi access points accounting for a major share of spending. Enterprises, commercial buildings, stadiums, transportation hubs, and industrial facilities are increasingly investing in hardware upgrades to support reliable high-capacity cellular coverage.
Growing mobile data consumption is further strengthening demand for DAS hardware. Global mobile data traffic reached approximately 210 exabytes per month in Q1 2026 and continues to grow at more than 20% annually, encouraging operators and building owners to expand network capacity through hardware-intensive distributed architectures.
By Technology
The Active DAS segment leads DAS technology with 46.30% adoption due to its ability to support the higher capacity and coverage requirements of modern 4G and 5G networks, particularly in large and complex indoor environments. Active DAS systems use powered components such as remote radio units and digital or optical repeaters to maintain signal quality over long distances and multiple floors, reducing signal loss compared with passive architectures.
This makes active DAS highly suitable for high-traffic locations such as stadiums, airports, metro stations, hospitals, and commercial buildings where consistent connectivity and higher data capacity are critical. The growing demand is supported by rising mobile data consumption, with global mobile data traffic expected to reach 0.38 zettabytes per month by 2029, driven by video streaming, cloud applications, and enterprise digital services.
By Ownership
The Carrier ownership segment leads the Distributed Antenna System (DAS) market, accounting for 38.6% of global DAS deployments, as mobile network operators continue to control critical infrastructure required for network performance, spectrum efficiency, and service reliability in high-value locations.
Growing mobile data consumption is a key factor supporting carrier-owned DAS adoption. Global mobile data traffic reached approximately 135 exabytes per month in 2024 and is projected by the ITU and GSMA to more than triple by 2030, driven by 5G adoption, video streaming, and enterprise digital transformation. This growth is encouraging operators to expand indoor network capacity across stadiums, airports, metro systems, and large corporate campuses.
Mobile operators also remain major investors in wireless infrastructure, with CTIA and GSMA reporting that carriers collectively spend more than USD 500 billion per decade on mobile network CAPEX. An increasing portion of this investment is directed toward small cells and in-building connectivity solutions such as DAS, as traditional macro networks cannot effectively support traffic demand in facilities exceeding 500,000 square feet.
By End User
The Public Venues & Safety segment leads the Distributed Antenna System (DAS) market with 23.65% due to the growing requirement for reliable in-building wireless coverage across high-occupancy facilities. Large public spaces such as airports, metro stations, stadiums, malls, and convention centers require strong cellular and emergency communication networks because dense construction materials and complex building layouts often weaken traditional macro-cell signals.
Increasing urbanization and the expansion of public infrastructure are creating sustained demand for DAS deployments. In 2023, more than 41,000 commercial airports operated worldwide, serving millions of passengers and requiring reliable communication systems for daily operations and safety management. Similarly, global sports venues host hundreds of millions of spectators annually, creating a need for distributed antenna networks to eliminate coverage gaps across seating areas, concourses, and operational zones.
Key Market Segments
Offering
- Hardware
- Services
Technology
- Active DAS
- Passive DAS
- Hybrid DAS
Ownership
- Carrier Ownership
- Enterprise Ownership
- Neutral-Host Ownership
End User
- Public Venues & Safety
- Hospitality
- Airport & Transportation
- Healthcare
- Education Sector & Corporate Offices
- Industrial
- Others
Market Dynamics
Drivers
| Driver | (~) % Impact on CAGR | Geographic Relevance | Impact Timeline |
|---|---|---|---|
| 5G densification in high-traffic venues | +2.0% | North America, Europe, Asia-Pacific | Short term (≤ 2 years) |
| Indoor coverage compliance in critical buildings | +1.4% | US, Canada, EU-27, India | Short term (≤ 2 years) |
| Escalating mobile data traffic per user | +1.2% | Global | Medium term (2 to 4 years) |
| Enterprise neutral-host adoption | +1.0% | North America, Western Europe | Medium term (2 to 4 years) |
| Smart stadia and transport hubs build-out | +0.8% | Global tier-1 cities | Long term (≥ 4 years) |
5G densification in high-traffic venues
5G macro network rollout has reached a point where operators must densify coverage in stadiums, airports, metros, and large campuses to sustain peak traffic loads exceeding 5 to 10 TB per event day and user throughput expectations above 200 Mbps, making distributed antenna systems a structural requirement in RF design rather than an optional add-on in these environments.
Between 2024 and 2026, major mobile network operators have increased capex allocations toward in-building and venue-centric infrastructure, with some reporting that over 25% to 30% of mobile data now originates in large indoor venues, which pushes DAS from project-based deployments to programmatic portfolios with multi-year master service agreements.
Commercially, this densification converts one-time hardware sales into recurring multi-tenant O&M contracts with annual service values per venue often exceeding 10% to 15% of initial deployment cost, raising effective lifetime margins by 5 to 8 percentage points and supporting the incremental DAS market CAGR uplift of about 2.0 percentage points embedded in the baseline growth trajectory through 2026.
Restraints
| Restraint | (~) % Impact on CAGR | Geographic Relevance | Impact Timeline |
|---|---|---|---|
| High upfront capex and financing costs | -1.8% | Global | Short term (≤ 2 years) |
| Complex multi-operator approval processes | -1.3% | North America, Europe, Asia-Pacific | Short term (≤ 2 years) |
| Building owner reluctance on revenue sharing | -1.1% | Global commercial real estate | Medium term (2 to 4 years) |
| Limited availability of skilled RF integrators | -0.9% | Emerging markets | Medium term (2 to 4 years) |
| Spectrum coordination constraints for DAS | -0.7% | US, EU-27, selected APAC | Long term (≥ 4 years) |
High upfront capex and financing costs
Distributed antenna deployments in large buildings and transport hubs typically require upfront project capex in the range of US$1 to 3 million per complex when including RF design, equipment, cabling, and installation, and the current interest rate environment in 2024 to 2026 has pushed weighted average cost of capital for infrastructure owners up by roughly 150 to 250 basis points versus the pre-2022 period, materially tightening payback thresholds.
This capital intensity means many mid-tier property portfolios defer DAS installation unless mandated, with internal hurdle rates often above 12% to 15% and build-operate-transfer models requiring minimum contract terms of 7 to 10 years to be viable, which delays a meaningful share of potential projects and suppresses near-term order intake volumes by an estimated 10% to 15% compared with unconstrained capex scenarios.
Strategically, vendors are forced to compress hardware margins by 3 to 5 percentage points or to bundle financing to keep deals moving, and this combination of higher funding cost and margin erosion translates into an effective drag of around 1.8 percentage points on the otherwise technology-driven DAS CAGR embedded in the 2026 baseline forecast window.
Challenges
| Challenge | (~) % CAGR | Geographic Relevance | Mitigation Horizon |
|---|---|---|---|
| Complex multi-band RF design | -1.6% | Global | Medium term (2 to 4 years) |
| Integration with private cellular networks | -1.2% | North America, Europe | Medium term (2 to 4 years) |
| Evolving in-building safety standards | -1.0% | US, EU-27, Australia | Long term (≥ 4 years) |
| Ongoing O&M cost burden for venue owners | -0.9% | Global | Long term (≥ 4 years) |
| Interference management with macro network | -0.8% | Global urban cores | Medium term (2 to 4 years) |
Complex multi-band RF design
Modern distributed antenna systems must simultaneously support multiple frequency bands across 4G and 5G, often exceeding 6 to 8 active bands per venue and requiring sophisticated design to avoid passive intermodulation and uplink saturation, which increases engineering hours per project by 30% to 50% compared with single- or dual-band legacy systems and stretches typical design-deployment cycles from around 4 to 6 months to 8 to 12 months.
This complexity also raises bill-of-materials costs by 10% to 20% due to additional combiners, filters, and sectorisation hardware, while RF optimization iterations can delay acceptance testing and revenue recognition by at least one quarter for multi-operator venues, effectively lowering the annualized throughput of projects a systems integrator can complete by roughly 15% to 20% at a fixed headcount.
Over the 2 to 4-year horizon, vendors are forced to invest in advanced design tools and standardized multi-band architectures, but until those are fully industrialized, the structural friction embedded in multi-band RF design translates into an estimated drag of about 1.6 percentage points on the market’s attainable growth ceiling relative to the technology-demand pull visible in primary traffic and coverage data.
Opportunities
| Opportunity | (~) % CAGR | Geographic Relevance | Execution Window |
|---|---|---|---|
| Neutral-host multi-tenant monetization models | +1.9% | North America, Europe, Asia-Pacific | Medium term (2 to 4 years) |
| Expansion into smart city IoT infrastructure | +1.5% | Global tier-1 and tier-2 cities | Long term (≥ 4 years) |
| DAS-as-a-service OPEX subscription offerings | +1.3% | Global | Medium term (2 to 4 years) |
| Retrofit of aging in-building systems | +1.1% | North America, Europe, Japan | Short term (≤ 2 years) |
| Vertical-specific solutions for healthcare and manufacturing | +0.9% | Global | Long term (≥ 4 years) |
Neutral-host multi-tenant monetization models
Neutral-host DAS operators that aggregate multiple mobile network tenants on a single infrastructure can convert what was historically a one-time capex sale with gross margins around 25% to 30% into recurring access-fee revenues per operator, with typical per-tenant monthly charges that, when annualized, yield lifetime project margins closer to 40% to 45% and shorten effective payback periods from 7 to 10 years to roughly 4 to 6 years on well-utilized venues.
Because many existing deployments are still single-operator or underutilized, the shift toward neutral-host models represents untapped white space: converting just an additional 2 to 3 operators per venue can increase revenue per site by 60% to 100% with only 15% to 25% incremental opex, improving unit economics such that cost per covered square meter can fall by around 20% to 30% for property owners while operators gain access to high-traffic locations without full capex burden.
Over a 2 to 4-year execution window, systematic deployment of neutral-host contracts across transport hubs, stadia, and large commercial real estate could add roughly 1.9 percentage points of upside to the baseline DAS CAGR by converting under-monetized installed base currently into higher-margin multi-tenant assets and expanding addressable venues that become economically viable under the improved unit-economics profile.
Geopolitical Impact Analysis
Geopolitical fragmentation is reshaping the economics of the Distributed Antenna System (DAS) market by increasing hardware costs, disrupting supply chains, and extending deployment timelines. WTO data indicates that global merchandise trade growth is slowing, with a projected 0.2% contraction in 2025 after 2.9% growth in 2024, mainly due to new tariffs and policy uncertainties affecting intermediate electronics trade.
Energy price volatility is adding further pressure on DAS manufacturing costs. According to the IEA, natural gas prices remained approximately 50% above historical averages in 2024 following the 2022 supply shock, increasing electricity cost fluctuations for energy-intensive production processes such as RF front-end components and printed circuit boards.
Supply chain disruptions caused by geopolitical conflicts and trade route changes are also affecting DAS deployment schedules. UNCTAD reported that freight rates increased significantly in 2024 due to rerouting, port congestion, and higher operational expenses, with some Asia-Europe shipping routes experiencing high double-digit container cost increases and 10 to 20 additional sailing days due to Red Sea diversions.
Studies on US-China supply chain shifts show indirect dependence on China through suppliers in Vietnam and Mexico increased by approximately 21% and 5.5%, respectively, highlighting continued reliance on Chinese upstream capacity for DAS sub-components.
Regional Analysis
North America leads with a 40.02% share and a USD 4.62 billion market value. Distributed Antenna System (DAS) market is being shaped by the growing need for reliable indoor connectivity and the shift from traditional macro networks toward dedicated in-building and shared wireless infrastructure.
According to Ericsson’s Mobility Report, users spend nearly 90% of their time indoors, while around 70% to 80% of mobile data traffic is generated inside buildings. This is increasing demand for DAS solutions across offices, hospitals, airports, stadiums, and transportation facilities to ensure consistent 4G and 5G performance.
The region is also seeing strong adoption of neutral-host networks, where shared DAS infrastructure supports multiple telecom operators. 5G Americas highlights that neutral-host architectures are gaining traction, with the global neutral hosting market expected to reach around USD 8.7 billion by 2028.
Asia Pacific is experiencing similar growth trends at a larger scale, driven by rapid 5G expansion, smart-city initiatives, and increasing enterprise digitalization. Ericsson and GSMA analyses indicate that up to 80% of mobile data usage in Asia Pacific occurs indoors, making in-building coverage a major priority for telecom operators and businesses.
Key Regions and Countries
- North America
- US
- Canada
- Europe
- Germany
- France
- The UK
- Spain
- Italy
- Rest of Europe
- Asia Pacific
- China
- Japan
- South Korea
- India
- Australia
- Rest of APAC
- Latin America
- Brazil
- Mexico
- Rest of Latin America
- Middle East & Africa
- GCC
- South Africa
- Rest of MEA
Key Players Analysis
The Distributed Antenna System (DAS) market is led by a limited group of Tier-1 players with strong positions across fiber infrastructure, in-building wireless systems, and neutral-host networks. Corning, CommScope, and American Tower collectively account for an estimated 15% to 18% of global DAS revenues, supported by their extensive connectivity portfolios, carrier relationships, and large-scale enterprise deployments.
Corning’s Optical Communications business, which supports DAS fiber backhaul and in-building connectivity solutions, generated approximately USD 4.66 billion in sales in 2024 and is expected to approach USD 6 billion in 2025. This growth strengthens Corning’s position as a key DAS infrastructure provider, particularly in optical connectivity and multi-operator fiber networks.
CommScope remains a major DAS technology supplier through its Networking, Intelligent Cellular and Security Solutions (NICS) portfolio. The company reported USD 1.112 billion in net sales in Q1 2025 and USD 1.63 billion in Q3 2025, while NICS segment sales increased 51% year-over-year. Its 2025 core adjusted EBITDA guidance of USD 1.0 to 1.05 billion supports continued expansion in enterprise, venue, and carrier-led DAS deployments.
Tier-2 challengers, including JMA Wireless, Comba Telecom Systems, Zinwave, and regional system integrators, collectively hold approximately 11.5% of the DAS market. These companies compete through specialized digital DAS platforms, radio solutions, and flexible deployment models rather than large-scale infrastructure ownership.
The leading five vendors, including Corning, CommScope, JMA Wireless, Comba Telecom, and Zinwave, capture a significant share of specialized DAS deployments. Corning alone is estimated to account for more than 4.5% of global DAS revenues, supported by its optical connectivity leadership.
Top Key Players in the Market
- American Tower Corporation
- AT&T Inc.
- Bird Technologies Inc.
- Boingo Wireless Inc.
- BTI Wireless
- CAES (Cobham Limited)
- Comba Telecom Systems Holdings Ltd.
- CommScope Holdings Company Inc.
- KATHREIN Digital Systems GmbH
- Corning Incorporated
- Crown Castle Inc.
- Advanced RF Technologies, Inc.
- GALTRONICS (Baylin Technologies Inc.)
- Rosenberger Hochfrequenztechnik GmbH & Co. KG.
- Other Key Players
Recent Developments
- In February 2026, Amphenol Corporation stated that the acquired Outdoor Wireless Networks (OWN) and Distributed Antenna Systems (DAS) businesses from CommScope are expected to generate approximately USD 1.3 billion in full-year 2025 sales within its Communications Solutions Segment, strengthening its wireless connectivity portfolio.
- In February 2025, Amphenol completed the acquisition of CommScope’s OWN and DAS businesses for approximately USD 2.1 billion in cash. The deal was expected to add around USD 1.3 billion in 2025 sales and contribute approximately USD 0.06 to 2025 earnings per share.
- In July 2025, CommScope announced that its divested OWN and DAS businesses were expected to generate approximately USD 1.3 billion in annual sales in 2025, marking its strategic shift away from DAS and outdoor wireless infrastructure operations.
- In August 2025, Boingo Wireless was selected to deploy a multi-carrier neutral-host DAS solution at Comerica Bank Tower, Dallas, covering more than 72,000 square meters (780,000+ square feet) to enhance 5G and LTE indoor coverage.
Report Scope
| Report Features | Description |
|---|---|
| Market Value (2025) | USD 11.5 Billion |
| Forecast Revenue (2035) | USD 28.7 Billion |
| CAGR (2026-2035) | 9.6% |
| Base Year for Estimation | 2025 |
| Historic Period | 2020-2024 |
| Forecast Period | 2026-2035 |
| Report Coverage | Revenue Forecast, Market Dynamics, Competitive Landscape, Recent Developments |
| Segments Covered | By Offering (Hardware and Services), By Technology (Active DAS, Passive DAS, and Hybrid DAS), By Ownership (Carrier Ownership, Enterprise Ownership, and Neutral-Host Ownership), By End User (Public Venues & Safety, Hospitality, Airport & Transportation, Healthcare, Education Sector & Corporate Offices, Industrial, and Others) |
| Regional Analysis | North America – US, Canada; Europe – Germany, France, The UK, Spain, Italy, Rest of Europe; Asia Pacific – China, Japan, South Korea, India, Australia, Singapore, Rest of APAC; Latin America – Brazil, Mexico, Rest of Latin America; Middle East & Africa – GCC, South Africa, Rest of MEA |
| Competitive Landscape |
American Tower Corporation, AT&T Inc., Bird Technologies Inc., Boingo Wireless Inc., BTI Wireless, CAES (Cobham Limited), Comba Telecom Systems Holdings Ltd., CommScope Holdings Company Inc., KATHREIN Digital Systems GmbH, Corning Incorporated, Crown Castle Inc., Advanced RF Technologies, Inc., GALTRONICS (Baylin Technologies Inc.), Rosenberger Hochfrequenztechnik GmbH & Co. KG., Other Key Players.
|
| Customization Scope | Customization for segments and region/country-level will be provided. Moreover, additional customization can be done based on the requirements. |
| Purchase Options | We have three licenses to opt for: Single User License, Multi-User License (Up to 5 Users), Corporate Use License (Unlimited Users and Printable PDF) |





























