


Report Overview
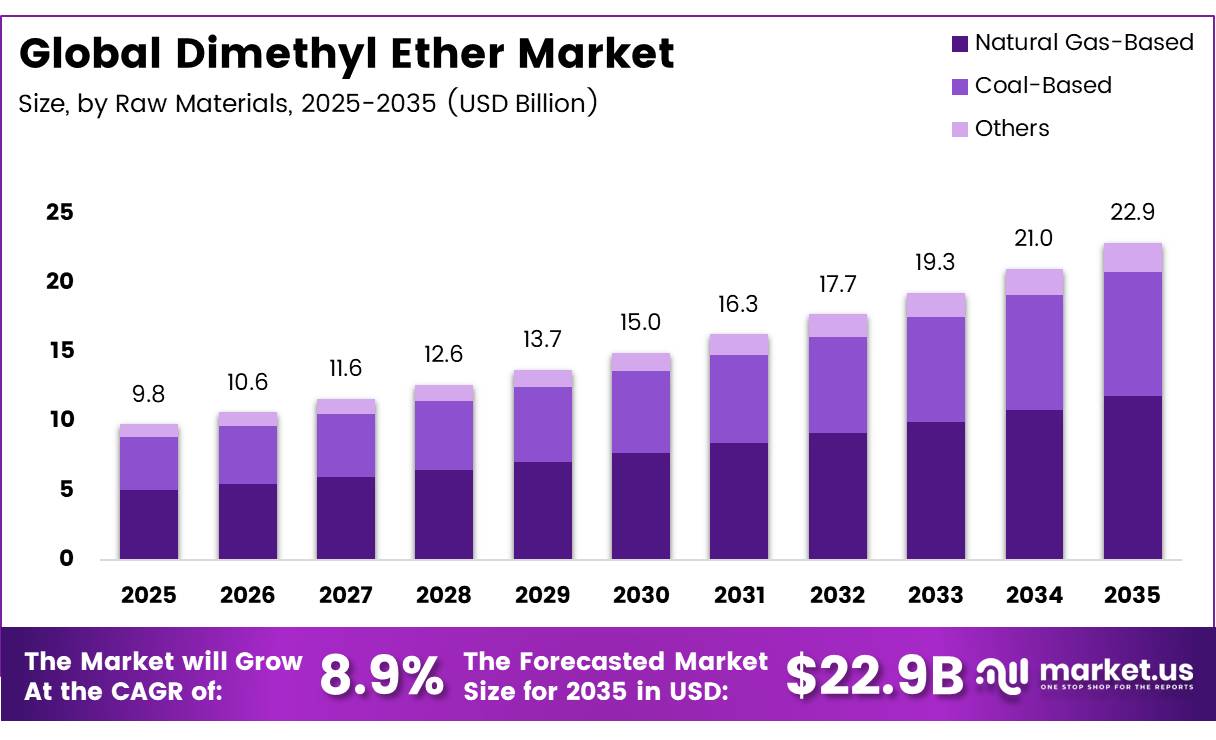
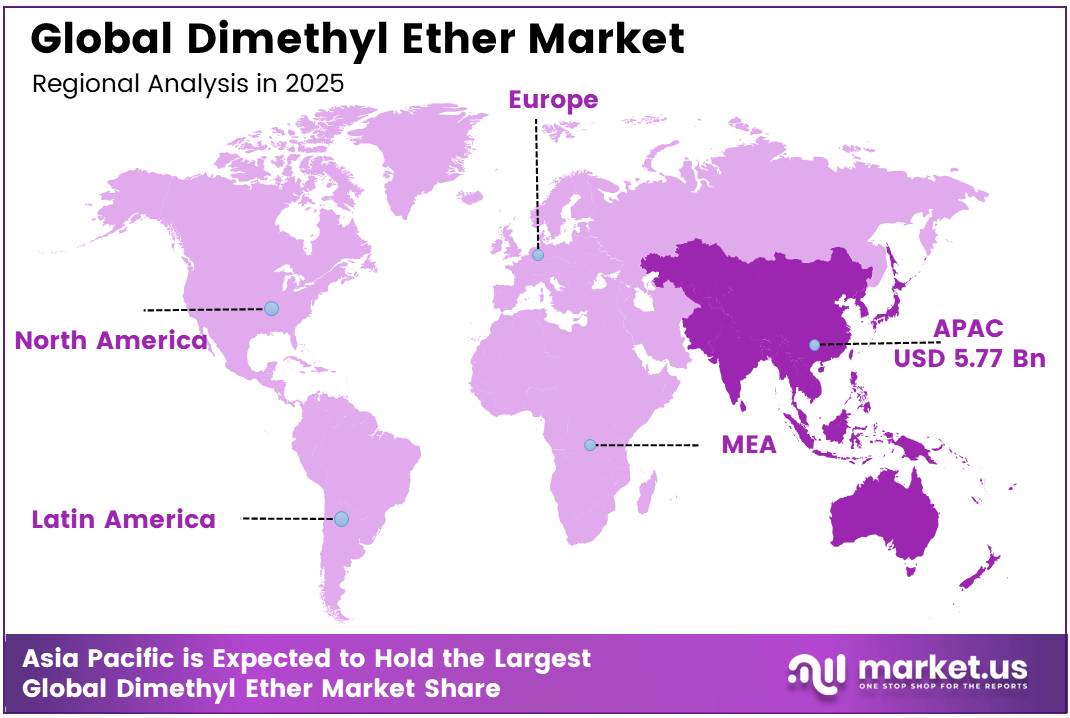
In 2025, the Global Dimethyl Ether Market was valued at USD 9.8 billion, and between 2026 and 2035, this market is estimated to register a CAGR of 8.9%, reaching about USD 22.9 billion by 2035. In 2025, Asia Pacific led the market, achieving over 58.9% share with a revenue of USD 5.77 Billion.
Dimethyl Ether (DME) is emerging as a multifunctional chemical and alternative fuel molecule used across aerosol propellants, LPG replacement applications, transportation fuels, and industrial energy systems. DME is produced mainly through methanol dehydration routes, where feedstocks such as natural gas, coal, and biomass can be converted into synthesis gas and subsequently methanol before DME production.
- The IEA Advanced Motor Fuels programme reports that DME has a boiling point of -25°C, a cetane number of 55–60, and requires about 6 bar of pressure to remain liquid. These characteristics support storage, ignition, and handling through infrastructure comparable with LPG systems.
Its industrial appeal is linked to efficient combustion and low soot formation. Oak Ridge National Laboratory reports that DME contains 34.8% oxygen and has a lower heating value of 27.6 MJ/kg, compared with 42.6 MJ/kg for conventional diesel. Despite its lower energy density, its oxygen-rich molecular structure and absence of carbon-carbon bonds help suppress particulate formation, strengthening its potential in heavy-duty, off-road, industrial heating, and distributed power applications.
Future growth opportunities are emerging through cleaner engines and hydrogen-carrier systems. The U.S. Department of Energy awarded USD 2.5 million for developing a medium-duty off-road DME engine. A separate DOE-supported programme is demonstrating renewable DME reforming at 25 kilograms of hydrogen per day and generating design data for scale-up to 500 kilograms daily, supporting broader fuel-cell, transport, and energy-storage applications.
Key Takeaways
- The global dimethyl ether market was valued at US$9.8 billion in 2025.
- The global market is projected to grow at a CAGR of 8.9% and is estimated to reach US$22.9 billion by 2035.
- On the basis of raw material, natural gas-based dimethyl ether dominated the market, constituting 51.6% of the total market share.
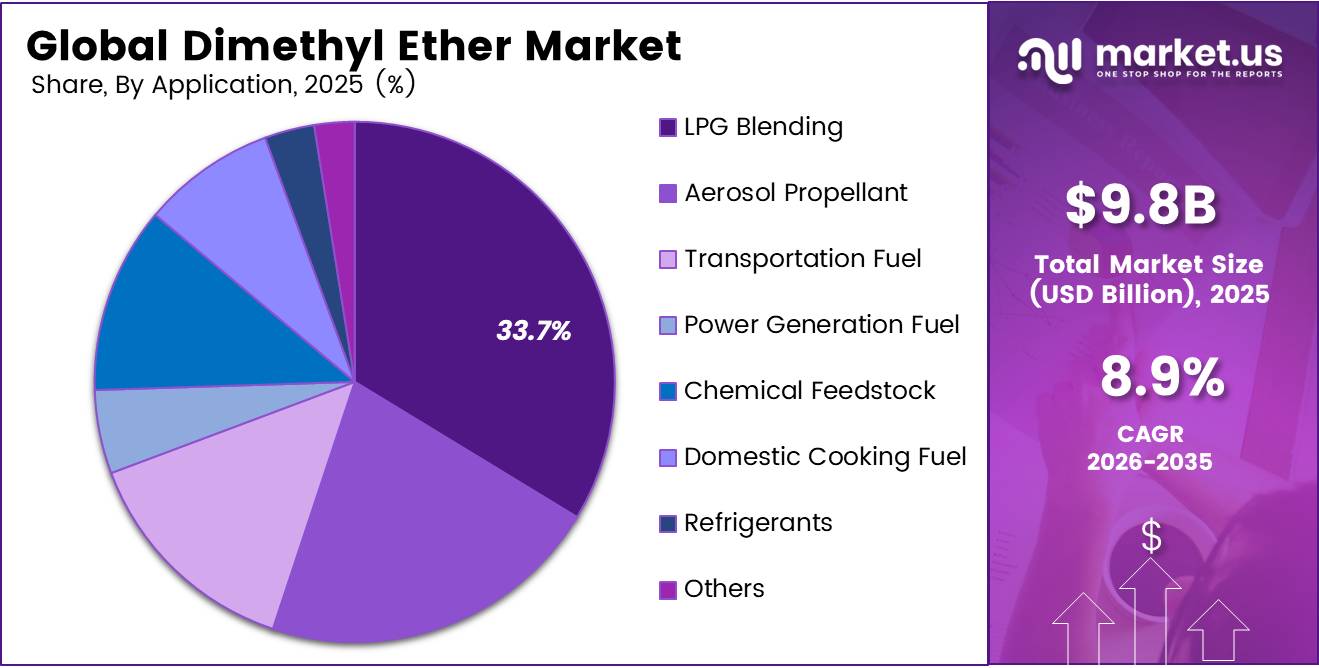
- Based on the application, LPG blending dominated the dimethyl ether market, with a substantial market share of around 33.7%.
- Among the end-user industries, the energy & power sector held a major share in the dimethyl ether market, accounting for 34.6% of the market share.
- In 2025, the Asia Pacific was the most dominant region in the dimethyl ether market, accounting for 58.9% of the total global consumption.
Raw Material Analysis
Natural Gas-Based represents dominant Segment in the Market.
In 2025, natural gas-based DME held a dominant 51.6% market share, supported by cleaner synthesis-gas conversion, reliable feedstock quality, and compatibility with large chemical plants. The U.S. Department of Energy identifies natural gas as the likely preferred feedstock for large-scale DME production in the United States. In 2025, U.S. dry natural gas production reached a record 39 trillion cubic feet, increasing by more than 4%.
Coal-based DME is gaining attention in coal-rich economies with established gasification and coal-chemical infrastructure. In 2025, China produced 4.83 billion tonnes of raw coal, representing 1.2% annual growth. December output alone reached 440 million tonnes, with average daily production of 14.10 million tonnes. This large domestic resource base can support integrated coal-to-syngas and DME facilities, particularly where natural gas access remains limited.
Application Analysis
LPG Blending Maintains the Largest Share of DME Utilization
LPG blending dominated DME applications with a 33.7% market share. DME can be mixed with LPG to expand fuel supply while using similar pressurised distribution and cylinder-handling systems. In March 2026, the U.S. Energy Information Administration reported that U.S. propane exports averaged a record 1.8 million barrels per day during 2025, increasing 3% annually. It also noted that three of the five largest export destinations were in Asia, demonstrating the scale and international reach of existing LPG infrastructure that could support blended DME fuels.
Transportation fuel is developing as a promising DME application because the fuel can support compression-ignition engines while limiting soot formation. In December 2024, the U.S. Department of Energy selected a DME non-road engine programme targeting a 10% improvement in engine efficiency, compliance with proposed 2028 Tier 5 emission requirements, and completion of a 200-hour engine demonstration. These technical goals could encourage DME adoption in construction, agricultural, mining, and other medium-duty off-road equipment.
End Use Analysis
Dimethyl Ether Are Mostly Utilized in the Energy & Power.
Energy & power dominates with 34.6% in the dimethyl ether (DME) end‑user segment. DME’s strong position in energy and power is underpinned by its suitability as a clean-burning LPG substitute and as an emerging fuel for power and industrial heat applications, directly aligning with global decarbonization agendas. The International Energy Agency reports that global electricity generation exceeded 29,000 TWh, with over 60% still derived from fossil fuels, creating a large addressable base for cleaner, drop‑in or co‑firing fuels such as DME that require minimal modifications to existing infrastructure.
The chemical industry is the fastest-growing end-user segment, driven by DME’s expanding role as a methanol substitute in specialty chemical synthesis, a dimethyl sulfate precursor in pharmaceutical manufacturing, and a process fuel in facilities subject to tightening emission limits. Under the EU’s revised Industrial Emissions Directive taking effect progressively from 2025, chemical manufacturers face increasingly stringent process emission caps that make DME’s cleaner combustion profile commercially relevant as a direct substitute for heavier fuel alternatives, a procurement decision driven by regulatory compliance cost avoidance that creates captive industrial demand structurally decoupled from fuel commodity pricing.
Key Market Segments
Raw Material
- Natural Gas-Based
- Coal-Based
- Others
Application
- LPG Blending
- Aerosol Propellant
- Transportation Fuel
- Power Generation Fuel
- Chemical Feedstock
- Domestic Cooking Fuel
- Refrigerants
- Others
By End Use
- Energy & Power
- Chemical Industry
- Automotive & Transportation
- Household Fuel Sector
- Cosmetics & Personal Care
- Pharmaceutical Industry
- Industrial Manufacturing
- Others
Driver Analysis
LPG blend substitution economics
LPG blending remains the clearest volume driver because DME can enter an already scaled household and commercial fuel chain without waiting for a fully new end-use ecosystem, and multiple public sources continue to identify LPG blending as the largest application segment in 2026. The strongest current-year policy-style signal is India’s estimate that a 20% DME-LPG blend could cut LPG imports by about 6.3 million tonnes per year and save roughly $4.04 billion, which materially changes the procurement case for import-dependent markets facing volatile propane and butane prices.
Strategically, this driver improves offtake certainty for new plants because it shifts demand formation away from discretionary specialty chemicals and toward utility-like fuel replacement, letting producers contract against distributors and public-sector energy programs rather than relying only on merchant sales. That is why this driver carries the highest near-term CAGR uplift: it combines large addressable volumes, limited customer retraining relative to new fuel systems, and direct macroeconomic value capture through avoided imports.
Drivers Impact Analysis
| Driver | (~) % Impact on CAGR Forecast | Geographic Relevance | Impact Timeline |
|---|---|---|---|
| LPG blend substitution economics | +2.4% | India core, China core, APAC LPG importers, MENA spill-over | Short term |
| Low-carbon fuel compliance pull | +1.9% | EU core, North America projects, Japan, South Korea, coastal China | Medium term |
| Methanol-to-DME cost and carbon optimization | +1.6% | China core, U.S. Gulf Coast, Middle East, Southeast Asia | Short term |
| Diesel and heavy-transport fuel switching | +1.3% | China inland fleets, India pilot corridors, industrial off-grid APAC | Medium term |
| Aerosol and chemical propellant replacement | +0.9% | North America, EU, Japan, ASEAN manufacturing hubs | Short term |
| Domestic energy-security and import reduction policy | +2.1% | India core, China core, import-dependent Asia | Medium term |
Restraint Analysis
High conversion and energy costs
The first major restraint is the structural cost of synthesizing DME, especially via methanol dehydration routes that demand substantial thermal energy and catalyst management, which inflates operating expenditure and dampens project IRR in a high-interest-rate environment. Conventional dehydration processes require reaction temperatures commonly in the 240–320 °C range and significant heat integration, so in regions where industrial power costs have risen 15–30% between 2021 and 2025, fuel and steam costs can add an extra 20–25% to cash operating costs versus more established LPG supply chains, forcing producers to chase scale and integration to stay competitive.
In parallel, direct syngas-to-DME plants must maintain carefully controlled CO/H2 ratios and deal with CO2 content generally kept below about 3% in the synthesis mix, which increases capital intensity for gas conditioning, compression, and recycling, and can push total installed costs well above $1,500–2,000 per tonne of annual capacity in markets without cheap legacy equipment.
Restraint Impact Analysis
| Restraint | (~) % Impact on CAGR Forecast | Geographic Relevance | Impact Timeline |
|---|---|---|---|
| High conversion and energy costs | -2.3% | China core, India, EU, Middle East | Medium term |
| Methanol and syngas feedstock volatility | -1.9% | China core, APAC corridors, EU, North America | Short term |
| Safety, storage, and handling constraints | -1.6% | EU, North America, Japan, Korea | Medium term |
| Infrastructure and appliance lock-in | -1.4% | Asia LPG users, global transport fleets | Long term |
| Policy uncertainty and fuel classification gaps | -1.8% | IMO-linked shipping, EU, emerging APAC | Medium term |
| Technology and skills-capital bottlenecks | -1.2% | Emerging Asia producers, MENA, Latin America | Long term |
Opportunity Analysis
Bio-DME from CO₂ and green H₂
Bio-DME production using captured CO₂ and green hydrogen represents an untapped opportunity that sits above today’s baseline, which is still dominated by natural-gas and fossil methanol pathways; while sources note that bio-based DME output is expanding at around the mid-to-high single-digit pace and largely remains a niche, the real upside lies in scaling integrated thermochemical systems that convert green methanol into renewable DME with lifecycle emissions reductions exceeding 70–80% versus conventional LPG.
By 2035, if even 10–15% of global DME capacity shifted to bio-DME routes co-located with renewable H₂ and CO₂ capture, the addressable low-carbon TAM in markets with explicit carbon-credit regimes (EU, parts of North America, Japan, Korea) could exceed several billion dollars annually, unlocking margin expansion of 5–10 percentage points through green premiums and avoided carbon-cost liabilities that are trending toward €80–100 per tonne CO₂ in Europe.
This is not yet a driver because projects are still at pilot and early commercial scale, electrolyzer capex is only beginning to fall below $500–700 per kW, and CO₂ capture costs remain in the $40–80 per tonne range, but as these unit economics improve and policy frameworks embed lifecycle credits for fuel molecules, bio-DME can move from demonstration into mainstream low-carbon fuel portfolios, potentially adding roughly 2–3 percentage points of upside CAGR on top of current forecasts if aggressively pursued in the 2026–2030 window.
Opportunity Impact Analysis
| Opportunity | (~) % Potential CAGR Upside | Geographic Relevance | Execution Window |
|---|---|---|---|
| Bio-DME from CO₂ and green H₂ | +2.7% | EU, North America, Japan, Korea, APAC industrial hubs | Medium term |
| Modular DME plants at hard-to-abate sites | +2.2% | EU steel/cement, China industrial clusters, India corridors | Medium term |
| Marine fuel portfolio bundling with methanol | +1.9% | EU, IMO-aligned shipping lanes, East Asia ports | Long term |
| Distributed off-grid power and mini-grid solutions | +1.5% | Emerging APAC, Africa, Latin America remote regions | Medium term |
| Premium-certified low-carbon LPG blend brands | +1.8% | India, China, ASEAN, Middle East | Short term |
| Digital trading, guarantees-of-origin, and carbon services | +1.6% | EU, UK, North America, advanced APAC markets | Medium term |
Challenges Analysis
Competing low-carbon fuel narratives
Between 2020 and 2025, announced hydrogen and battery-electric vehicle projects have attracted tens of billions of dollars globally, and hydrogen roadmaps in regions like the EU and Japan target multi-million-tonne annual H₂ demand by 2030, while electric vehicles already account for more than 10–20% of new light-duty sales in key markets, crowding the attention of policymakers and investors and often relegating DME to secondary roles in decarbonization portfolios.
Strategically, companies need to recalibrate their go-to-market mechanics—positioning DME as a complementary rather than rival molecule, bundling it with methanol portfolios or using it in niche applications like dedicated bus fleets and industrial off-grid power—which absorbs management bandwidth and marketing budget and shaves roughly 1–1.5 percentage points off the market’s unconstrained CAGR, as capital and policy support are spread across multiple competing low-carbon narratives rather than fully concentrated on DME.
Challenges Impact Analysis
| Challenge | (~) % CAGR Friction Drag | Geographic Relevance | Mitigation Horizon |
|---|---|---|---|
| Competing low-carbon fuel narratives | -1.4% | EU regulatory hubs, North America core, APAC transport corridors | Long term |
| Volatile project finance and capex discipline | -1.2% | Global emerging producers, Asia-Pacific, MENA | Medium term |
| Supply chain and logistics complexity | -1.0% | APAC industrial belts, EU ports, India LPG networks | Medium term |
| Talent, skills, and OEM ecosystem gaps | -0.9% | Emerging APAC, Africa, Latin America, MENA | Long term |
| Standards harmonization and certification lag | -1.1% | EU, North America, Japan, Korea, IMO-linked shipping | Medium term |
| Data transparency and market intelligence deficits | -0.8% | Global, especially emerging markets and second-tier players | Long term |
Geopolitical Impact Analysis
Sustained Red Sea Disruptions Have Permanently Repriced Methanol Logistics and Shifted DME Feedstock Competitiveness Across Regions
The protracted disruption to Red Sea shipping corridors, initiated by Houthi maritime attacks on commercial vessels from late 2023 through 2025, has imposed structural and compounding cost increases on the methanol trade flows that directly underpin DME production economics across Europe and East Asia. Methanol moves in bulk chemical tanker routes connecting major Middle Eastern producers in Oman and Saudi Arabia with downstream consumers in Europe and Northeast Asia.
- The enforced rerouting of these shipments around the Cape of Good Hope added an average of 10 to 14 transit days and elevated freight insurance premiums on chemical tanker lanes, cost increases formally documented in UNCTAD’s Review of Maritime Transport 2024, which identified chemical tanker route disruptions as among the most commercially significant consequences of the Red Sea security deterioration.
For European DME producer’s dependent on imported Middle Eastern methanol as primary feedstock, the elevated delivered cost basis has permanently altered their production economics relative to domestic alternatives, accelerating investment decisions toward local bio-methanol and waste methanol sourcing that would not have been competitive under pre-disruption freight conditions. For Chinese coal-to-DME operators insulated from maritime methanol freight exposure by domestic feedstock integration, the disruption has functioned as an unintended competitive subsidy.
As European DME production costs rose, Chinese producers were able to offer more competitive pricing on DME exports to South and Southeast Asian markets, consolidating China’s positional advantage in regional fuel trade with a structural tailwind that has nothing to do with production efficiency improvements and everything to do with geopolitical freight economics. This asymmetry is now embedded in regional pricing differentials that will persist as long as Red Sea security conditions remain unresolved.
Regional Analysis
Asia Pacific Held the Largest Share of the Global Dimethyl Ether Market.
Asia Pacific holds 58.9% of global DME demand, a position structurally anchored by China’s coal-to-chemical industrial base and India’s sovereign blending infrastructure. China Energy Investment Corporation, for instance, integrates coal gasification and downstream DME production at a scale that reflects the National Development and Reform Commission’s policy directive designating DME a strategic coal utilization output, ensuring sustained domestic production volumes that are effectively insulated from international commodity price signals by state investment directives.
The Middle East and Africa is the fastest-growing DME geography, propelled by gas monetization imperatives among Gulf Cooperation Council producers and nascent clean cooking fuel programmes across Sub-Saharan Africa. Saudi Basic Industries Corporation’s strategic alignment with Saudi Vision 2030’s downstream chemical diversification objectives positions natural gas-to-methanol-to-DME conversion as a structural priority investment, with direct capital allocation consequences for DME production capacity across the Arabian Peninsula.
Key Regions and Countries Covered
- North America
- The US
- Canada
- Europe
- Germany
- France
- The UK
- Spain
- Italy
- Russia & CIS
- Rest of Europe
- APAC
- China
- Japan
- South Korea
- India
- ASEAN
- Rest of APAC
- Latin America
- Brazil
- Mexico
- Rest of Latin America
- Middle East & Africa
- GCC
- South Africa
- Rest of MEA
Key Players Analysis
DME market competition is increasingly shaped by technological differentiation, feedstock security, and supply chain integration rather than production capacity alone. Leading producers are improving catalyst technologies, modular production systems, and feedstock flexibility to reduce costs and maintain profitability across changing natural gas, coal, and bio-methanol price environments. Process automation and scale efficiencies also support consistent product quality, helping companies secure long-term supply agreements with fuel and chemical customers.
Competitive advantage is further strengthened through vertical integration with methanol suppliers and downstream distribution networks, improving cost stability and supply reliability. Mitsubishi Gas Chemical Company maintains a strong position through proprietary DME catalyst technologies that generate licensing and engineering revenues independent of commodity market fluctuations. Meanwhile, Nouryon and Akzo Nobel compete in the high-purity aerosol-grade DME segment through certification standards and established customer relationships.
A key emerging competitive shift is the expansion of renewable DME production, where access to low-cost renewable electricity and green hydrogen could enable producers in regions such as Western Australia, Chile, and the Nordic countries to gain an advantage through eligibility for premium low-carbon fuel incentives under policies such as RED III and GX Program.
The Major Players In The Industry
- Mitsubishi Gas Chemical Company
- Akzo Nobel
- Royal Dutch Shell
- China Energy Investment Corporation
- Jiutai Energy Group
- Fuel DME Production
- Korea Gas Corporation
- Grillo-Werke AG
- Nouryon
- Oberon Fuels
- SHV Energy
- Zagros Petrochemical Company
- Saudi Basic Industries Corporation
- Haldor Topsoe
- The Chemours Company
- Other Key Players
Key Development
- In February 2026, SHV Energy was referenced in renewable LPG and rDME discussions via European market initiatives, where collaborations with renewable DME producers help reduce emissions in LPG distribution, though specific SHV‑branded DME projects are mainly described through partner communications.
- In July 2024, Royal Dutch Shell, cited as Shell International B.V. in DME market studies, enhanced its presence in cleaner fuels value chains, leveraging integrated gas and chemicals assets that support dimethyl ether production and usage in LPG blending and fuel applications across key regions.
Report Scope
| Report Features | Description |
|---|---|
| Market Value (2025) | USD 9.8 Bn |
| Forecast Revenue (2035) | USD 22.9 Bn |
| CAGR (2026-2035) | 8.9% |
| Base Year for Estimation | 2025 |
| Historic Period | 2020-2024 |
| Forecast Period | 2026-2035 |
| Report Coverage | Revenue Forecast, Market Dynamics, Competitive Landscape, Recent Developments |
| Segments Covered | By Raw Material (Natural Gas-Based, Coal-Based, and Others), By Application (LPG Blending, Aerosol Propellant, Transportation Fuel, Power Generation Fuel, Chemical Feedstock, Domestic Cooking Fuel, Refrigerants, and Others), By End User Industry (Energy & Power, Chemical, Automotive & Transportation, Household Fuel, Cosmetics & Personal Care, Pharmaceutical, Industrial Manufacturing, and Others) |
| Regional Analysis | North America – The US & Canada; Europe – Germany, France, The UK, Spain, Italy, Russia & CIS, Rest of Europe; APAC– China, Japan, South Korea, India, ASEAN & Rest of APAC; Latin America– Brazil, Mexico & Rest of Latin America; Middle East & Africa– GCC, South Africa, & Rest of MEA |
| Competitive Landscape | Mitsubishi Gas Chemical Company Akzo Nobel Royal Dutch Shell China Energy Investment Corporation Jiutai Energy Group Fuel DME Production Korea Gas Corporation Grillo-Werke AG Nouryon Oberon Fuels SHV Energy Zagros Petrochemical Company Saudi Basic Industries Corporation Haldor Topsoe The Chemours Company Other Key Players |
| Customization Scope | Customization for segments, region/country-level will be provided. Moreover, additional customization can be done based on the requirements. |
| Purchase Options | We have three licenses to opt for: Single User License, Multi-User License (Up to 5 Users), Corporate Use License (Unlimited Users and Printable PDF) |





































