Report Overview
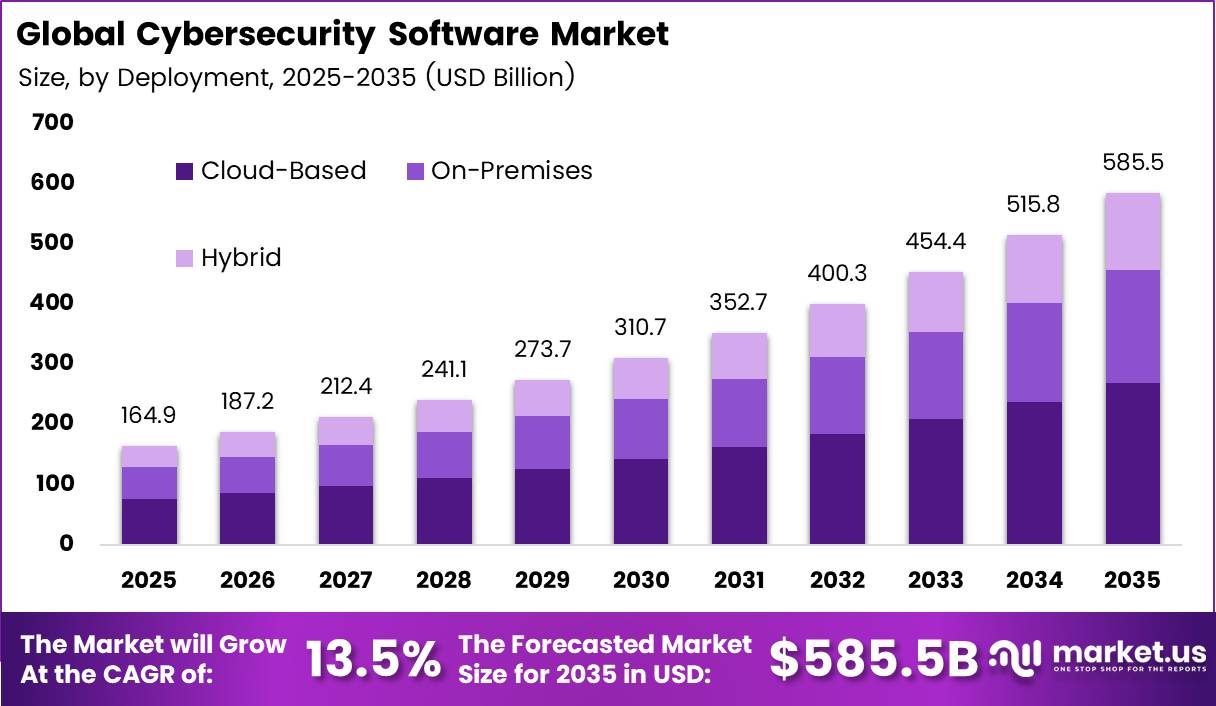
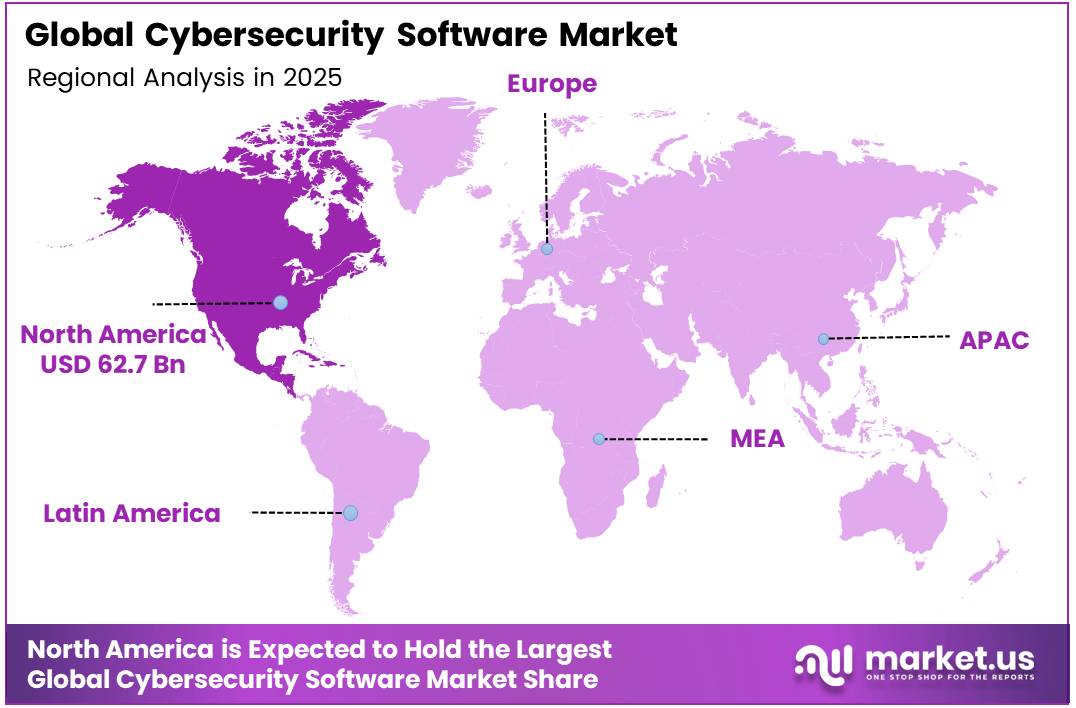
In 2025, the Global Cybersecurity Software Market was valued at USD 164.9 billion. The market is projected to grow at a CAGR of 13.5% during 2026–2035, reaching approximately USD 585.5 billion by 2035. North America dominated the global market in 2025, accounting for more than 38.0% of the total market share and generating approximately USD 62.7 billion in revenue.
Demand rises because organizations must protect expanding digital estates across cloud platforms, remote workforces, connected devices, and AI systems. The WTO reported that trade in around 100 AI-related product lines, including semiconductors, processors, servers, and telecommunications equipment, reached USD 1.92 trillion in the first half of 2025, up more than 20% year on year.
More servers, cloud workloads, and connected devices create more attack surfaces, so enterprises increase spending on endpoint security, cloud security, IAM, and threat detection. BFSI, which holds a 22.0% application share, faces strict data-protection and fraud-prevention requirements. Large enterprises account for 68.0% of demand because they manage complex networks, regulatory obligations, and high-value data.
The North America region benefits from a large base of financial institutions, technology firms, healthcare providers, and government agencies that face frequent cyberattacks and strict compliance rules. The United States also hosts major vendors, cloud providers, and security research centers, which support early adoption of AI-driven detection, zero-trust access, and managed security services.
Key Takeaways
- The Cybersecurity Software Market is expected to rise from USD 164.9 billion in 2025 to USD 585.5 billion by 2035. at a 13.5% CAGR from 2026 to 2035.
- Software leads the component segment with a 72.0% share.
- Endpoint security leads the security type segment with a 21.0% share.
- Cloud-based deployment leads the deployment mode segment with a 46.0% share.
- Large enterprises lead the organization size segment with a 68.0% share.
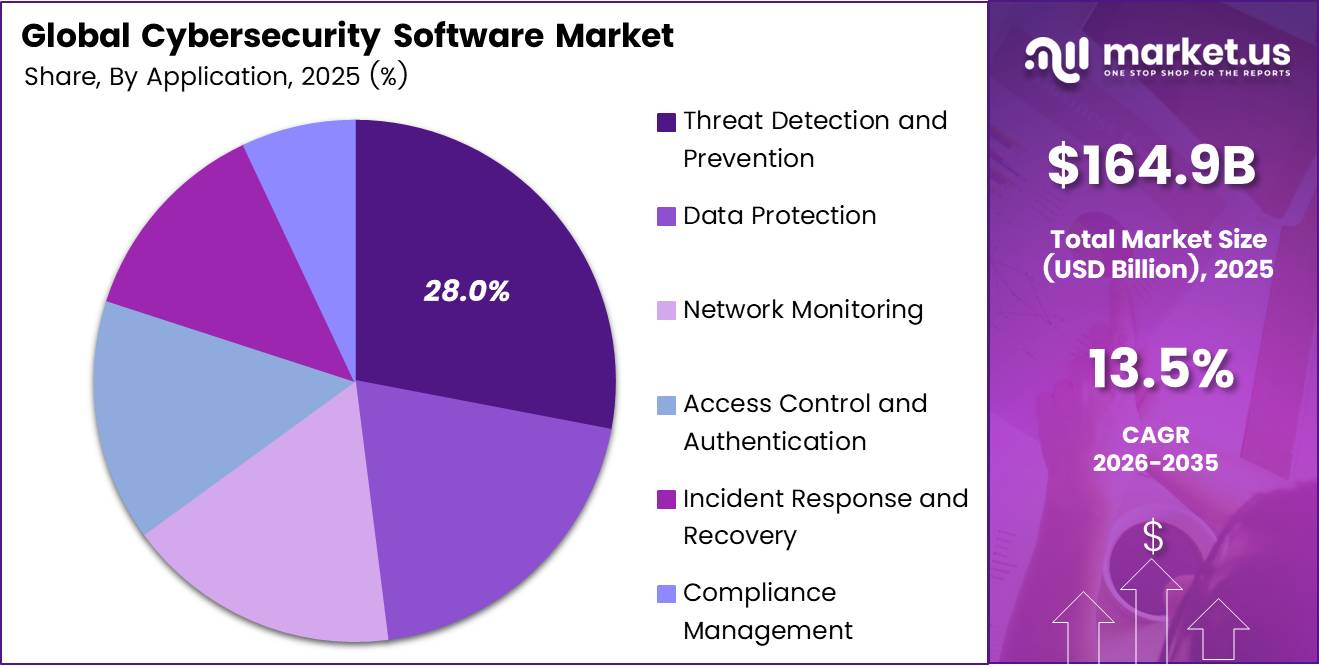
- Threat detection and prevention leads the application segment with a 28.0% share.
- BFSI leads the end-use industry segment with a 22.0% share.
- North America dominates the market with a 38.0% share and revenue of USD 62.7 billion.
By Component
Software dominates with 72.0% due to scalable automated protection across enterprise systems.
Software leads because organizations need always-on tools that find threats, block attacks, and protect data without adding large teams. Security software can cover endpoints, networks, cloud workloads, and applications through one platform. This makes it easier for firms to manage many devices and users.
The demand is strong because global average data-breach costs reached USD 4.44 million, pushing companies to invest in prevention rather than only cleanup. Software also updates quickly, which helps firms respond to new attack methods.
By Security Type
Endpoint Security dominates with 21.0% due to widespread laptop and mobile device exposure.
Endpoint Security leads because every laptop, phone, server, and workstation can become an entry point for attackers. Companies use endpoint tools to stop malware, control device access, and detect unusual behavior. This sub-segment stays ahead because hybrid work keeps employees connected from many locations.
Attackers often target user devices first, so firms treat endpoint protection as a basic security layer. The importance of this category is clear because ransomware appeared in 44% of breaches reviewed in Verizon’s 2025 study, up from 32% in the prior year.
Cloud security tools monitor configurations, control access, and protect workloads across public and private cloud environments. IBM X-Force found that identity abuse occurred in 30% of intrusions, showing why firms also need stronger controls around users, credentials, and cloud resources. As more workloads move online, protection must follow them.
By Deployment Mode
Cloud-Based deployment dominates with 46.0% due to lower upfront cost and rapid scalability.
Cloud-Based deployment leads because organizations can start quickly, pay as they use services, and expand protection without buying new hardware. This model suits companies with remote workers, multiple offices, and growing digital operations. Cloud platforms also receive frequent updates, helping users gain new threat protections faster.
IBM reported that breaches involving multiple environments cost an average of USD 5.05 million, compared with USD 4.01 million for breaches limited to on-premises systems. This cost gap encourages firms to secure mixed environments carefully.
By Organization Size
Large Enterprises dominate with 68.0% due to complex systems and higher regulatory obligations.
Large Enterprises lead because they operate many offices, thousands of employees, wide supplier networks, and large volumes of sensitive data. They face more attack surfaces and stricter compliance duties, so they invest heavily in security software, monitoring, and response teams.
Small and Medium-Sized Enterprises are the fastest-growing group because digital tools are now central to their sales, payments, inventory, and customer communication. SMEs increasingly face the same threats as larger firms but often have fewer security specialists.
By Application
Threat Detection and Prevention dominates with 28.0% due to rising phishing and ransomware attacks.
Threat Detection and Prevention leads because organizations want to stop attacks before they disrupt operations or expose data. These tools scan emails, endpoints, networks, and cloud activity to identify suspicious behavior.
They also help security teams respond quickly to malware, unauthorized access, and account misuse. Demand remains high because phishing was the most frequent initial attack vector, involved in 16% of breaches, and carried an average breach cost of USD 4.8 million, according to IBM.
ENISA reported that ransomware incidents remained at high volumes, with more than 1,000 claims per quarter, while attackers increasingly used double and triple extortion methods. These tactics make recovery planning essential.
By End-Use Industry
BFSI dominates with 22.0% due to high-value financial data and strict regulation.
Banking, Financial Services, and Insurance leads because these firms handle payment data, customer identities, transaction records, and large financial assets. A security failure can cause direct financial loss, fraud, regulatory penalties, and loss of customer trust.
Healthcare is the fastest-growing end-use industry because hospitals, clinics, and health technology firms hold sensitive patient records and depend on connected medical systems. Cyberattacks can interrupt appointments, delay treatment, and expose personal health data.
ENISA found that health accounted for 8% of ransomware events, while manufacturing accounted for 17% and business services accounted for 18%. Although healthcare’s share is smaller, its operational impact and data sensitivity make security investment urgent.
Key Market Segments
By Component
- Software
- Services
- Professional Services
- Managed Security Services
By Security Type
- Endpoint Security
- Network Security
- Cloud Security
- Application Security
- Identity and Access Management (IAM)
- Data Security
- Security Information and Event Management (SIEM)
- Vulnerability Management
- Others
By Deployment Mode
- Cloud-Based
- On-Premises
- Hybrid
By Organization Size
- Small and Medium-Sized Enterprises (SMEs)
- Large Enterprises
By Application
- Threat Detection and Prevention
- Data Protection
- Network Monitoring
- Access Control and Authentication
- Incident Response and Recovery
- Compliance Management
By End-Use Industry
- Banking, Financial Services, and Insurance (BFSI)
- IT and Telecommunications
- Healthcare
- Government and Public Sector
- Retail and E-commerce
- Manufacturing
- Energy and Utilities
- Aerospace and Defense
- Others
Geopolitical Impact Analysis
Geopolitical tension affects cybersecurity software through chip supply, cloud infrastructure, and cross-border data rules. Security software depends on semiconductors for endpoints, network appliances, servers, and AI accelerators.
The WTO reported that trade in AI-related products, including semiconductors and servers, reached USD 1.92 trillion in the first half of 2025, an increase of more than 20% year on year. This demand raises competition for advanced chips and can extend lead times for hardware-based security platforms. Export controls and tariff changes also raise procurement costs for vendors that build firewalls, secure gateways, and on-premises appliances.
Trade policy uncertainty changes pricing and distribution. The WTO raised its 2025 forecast for world merchandise trade volume growth to 2.4%, while global trade in the first half of 2025 rose 4.9% compared with the same period in 2024. However, tariff measures and shipping disruption can still delay hardware shipments and increase landed costs.
Sanctions, data-localization rules, and vendor-risk policies also reshape distribution. Governments and regulated industries increasingly require local data storage, vetted suppliers, and resilient supply chains. This encourages hybrid deployment, where organizations keep sensitive data on-premises while using cloud tools for analytics and threat intelligence.
Regional Analysis
North America dominates the Cybersecurity Software Market, holding a 38.0% share and generating USD 62.7 billion in revenue. The United States leads regional demand through its large BFSI, healthcare, technology, and government sectors. These sectors manage sensitive financial, patient, and national-security data, so they invest heavily in endpoint protection, IAM, SIEM, and incident response.
Canada adds demand through banking, telecommunications, energy, and public-sector digital programs. The region also benefits from a dense vendor ecosystem, advanced cloud infrastructure, and strong cybersecurity talent.
Asia Pacific is the fastest-growing region in the cybersecurity software market. China, Japan, South Korea, India, and Australia drive demand through rapid digitalization, expanding e-commerce, smart manufacturing, and large public digital programs. India’s growing IT and telecommunications sector creates strong demand for cloud security and managed services.
Europe holds a strong position due to strict privacy and cybersecurity rules, especially across Germany, France, the UK, Spain, and Italy. Germany drives demand from manufacturing, automotive, and industrial firms that must secure operational technology. The UK leads in financial services, insurance, and managed security services. France and Italy invest in public-sector and critical-infrastructure protection.
Key Regions and Countries
North America
- US
- Canada
Europe
- Germany
- France
- The UK
- Spain
- Italy
- Rest of Europe
Asia Pacific
- China
- Japan
- South Korea
- India
- Australia
- Rest of APAC
Latin America
- Brazil
- Mexico
- Rest of Latin America
Middle East and Africa
- GCC
- South Africa
- Rest of MEA
Market Dynamics
Drivers
| Driver | (~) % Impact on CAGR Forecast | Geographic Relevance | Impact Timeline |
|---|---|---|---|
| Regulatory Compliance Mandates | +2.8% | Global, led by EU and North America | Short term (2 years or less) |
| Cloud-Native Security Adoption | +2.4% | North America, Europe, Asia-Pacific | Short term (2 years or less) |
| AI-Enabled Threat Detection | +2.1% | Global | Short term (2 years or less) |
| Ransomware and Cyber-Insurance Pressure | +1.7% | North America, Europe, Middle East | Short term (2 years or less) |
| Zero-Trust Architecture Rollouts | +1.5% | North America, Europe, Asia-Pacific | Medium term (2 to 4 years) |
| OT and IoT Security Expansion | +1.2% | Asia-Pacific, Europe, North America | Medium term (2 to 4 years) |
Regulatory compliance mandates are the largest active growth driver.
The root cause is the shift from voluntary security frameworks to enforceable product-security, breach-notification, and software-supply-chain obligations: the EU Cyber Resilience Act is scheduled to become fully enforceable in December 2027, while U.S. federal policy under NIST and CISA continues to advance secure-software-development and machine-readable policy requirements.
This converts cybersecurity software from a discretionary IT purchase into a compliance-linked operating expense, supporting higher renewal rates and expanding seat, asset, and workload-based licensing. Per ISC2’s 2025 workforce study, 41% of security teams cite AI skills and 36% cite cloud security as top needs, while 28% already use AI tools operationally.
Commercially, vendors able to package policy mapping, SBOM management, evidence collection, and audit reporting can reduce customer implementation cost per compliance workload and defend premium pricing; a vendor that automates even 30% of manual control-evidence work can materially improve gross margin while capturing a meaningful share of compliance-driven demand.
Restraints
| Restraint | (~) % Impact on CAGR Forecast | Geographic Relevance | Impact Timeline |
|---|---|---|---|
| Security Budget Constraints | -1.9% | Global | Short term (2 years or less) |
| Fragmented Security Tool Stacks | -1.4% | Global | Short term (2 years or less) |
| Procurement and Approval Delays | -1.1% | North America, Europe, public sector | Short term (2 years or less) |
| Data Residency and Export Controls | -0.9% | EU, China, India, Middle East | Medium term (2 to 4 years) |
| SME Affordability Barrier | -0.8% | Global | Medium term (2 to 4 years) |
Security budget constraints are the most immediate structural restraint.
The root cause is persistent macro pressure on discretionary technology spending, which forces security leaders to protect incident-response and compliance-critical line items while delaying platform consolidation and new-tool purchases.
Per ISC2’s 2025 workforce study, 33% of organizations say they lack resources to adequately staff security teams, 29% cannot afford the skilled hires they need, and 36% reported budget cuts—creating a direct bottleneck in which software demand is present but purchasing capacity is constrained.
The quantitative effect is longer sales cycles, greater discounting, and lower net revenue retention: if budget approval cycles extend by 20% to 30%, vendors face deferred bookings, weaker cash conversion, and higher customer-acquisition cost per closed deal.
Challenges
| Challenge | (~) % CAGR Friction Drag | Geographic Relevance | Mitigation Horizon |
|---|---|---|---|
| Cybersecurity Talent Scarcity | -1.6% | Global | Medium term (2 to 4 years) |
| AI Governance Immaturity | -1.2% | Global | Medium term (2 to 4 years) |
| Alert Fatigue and Integration Debt | -1.0% | North America, Europe, Asia-Pacific | Medium term (2 to 4 years) |
| Adversarial AI Threat Evolution | -0.9% | Global | Long term (4 years or more) |
| Post-Quantum Migration Complexity | -0.7% | Global | Long term (4 years or more) |
Cybersecurity talent scarcity is the most significant ongoing friction drag.
The structural vulnerability is not merely a shortage of analysts but a mismatch between increasingly automated security platforms and the specialized skills required to deploy, tune, and govern them.
According to ISC2’s 2025 workforce study, 95% of respondents report at least one skill need, 88% have experienced a significant cybersecurity consequence due to skills shortages, and 41% identify AI as their most pressing skill gap—while ISACA’s 2026 State of Cybersecurity report highlights underdeveloped AI governance and incident-response maturity.
Firms must therefore shift from labor-intensive professional services toward guided onboarding, managed detection and response, low-code workflows, and outcome-based pricing; reducing time-to-value by 25% and support tickets by 20% would be necessary to protect margins while serving customers with constrained internal expertise.
Opportunities
| Opportunity | (~) % Potential CAGR Upside | Geographic Relevance | Execution Window |
|---|---|---|---|
| AI Security Governance Platforms | +2.2% | Global | Medium term (2 to 4 years) |
| SME Managed Security Services | +1.8% | Asia-Pacific, Latin America, Europe | Medium term (2 to 4 years) |
| Compliance Automation Suites | +1.6% | EU, North America | Short term (2 years or less) |
| Identity Security Consolidation | +1.4% | Global | Medium term (2 to 4 years) |
| Post-Quantum Readiness Services | +1.1% | North America, Europe, Asia-Pacific | Long term (4 years or more) |
| OT Security Monetization | +1.0% | Asia-Pacific, Europe, Middle East | Long term (4 years or more) |
AI security governance platforms represent the largest untapped upside.
This is future white space rather than a current driver because most organizations have begun adopting AI-enabled security tools but have not yet standardized controls for model inventory, prompt and data leakage, agent permissions, adversarial testing, and audit-ready AI risk evidence.
ISC2 found that 28% of security professionals had integrated AI tools into operations by 2025, while 41% named AI their top skills need and 73% expected AI to create more specialized security requirements—indicating substantial unmet demand for governance, not just detection.
A vendor that reduces AI-risk assessment effort by 40% and audit-preparation effort by 30% can expand contract value while improving gross margin, because governance workflows are highly repeatable and can be delivered through software rather than scarce specialist labor. Capturing this white space would add upside above the baseline CAGR without relying on incremental headcount growth.
Key Players Analysis
Microsoft, Palo Alto Networks, Cisco, and Fortinet form the market’s leading tier. Microsoft operates one of the largest security businesses through its cloud, productivity, and identity platforms; its total FY2025 revenue reached USD 281.7 billion, up 15%, giving it major distribution power across enterprises. Palo Alto Networks reported FY2025 revenue of about USD 9.2 billion, with next-generation security ARR above USD 5.6 billion.
Cisco generated FY2025 revenue of USD 56.7 billion, and its security product category revenue rose 59%, or USD 3.0 billion, supported by Splunk and threat-detection offerings. Fortinet reported FY2025 revenue of USD 6.80 billion, up 14%, with product revenue of USD 2.22 billion.
CrowdStrike, Zscaler, Check Point, Trend Micro, and SentinelOne form a strong challenger tier with focused cloud-native platforms. CrowdStrike reported FY2025 ARR of USD 4.24 billion, up 23%, driven by its Falcon endpoint and workload protection platform. Zscaler reported FY2025 revenue of USD 2,673.1 million, up 23%, showing strong demand for cloud and zero-trust network security.
Fortinet invested USD 815.5 million in R&D in FY2025, equal to about 12% of revenue, to expand AI-driven network and security operations capabilities. Cisco allocated USD 9.3 billion to R&D in FY2025, supporting security, networking, and observability innovation.
Consolidation is changing the competitive hierarchy. Palo Alto Networks agreed in July 2025 to acquire CyberArk for about USD 25 billion, strengthening its identity-security position. Zscaler acquired Red Canary for USD 675 million in 2025 to expand managed detection and response. SentinelOne acquired Observo AI for USD 225 million in 2025 to add AI-based security data capabilities.
Top Key Players in the Market
- Microsoft Corporation
- Palo Alto Networks, Inc.
- Cisco Systems, Inc.
- Fortinet, Inc.
- CrowdStrike Holdings, Inc.
- Broadcom Inc. (Symantec)
- Check Point Software Technologies Ltd.
- Trend Micro Incorporated
- Gen Digital Inc.
- IBM Corporation
- Sophos Limited
- Trellix
- SentinelOne, Inc.
- Zscaler, Inc.
- Qualys, Inc.
Recent Developments
- In July 2025, Palo Alto Networks announced an agreement to acquire CyberArk for approximately USD 25 billion in cash and stock to expand its identity security capabilities.
- In August 2025, Zscaler announced the acquisition of Red Canary for USD 675 million to strengthen managed detection and response services.
- In May 2025, SentinelOne announced the acquisition of Observo AI for USD 225 million to enhance AI-driven security data management and analytics.
- In March 2025, Google announced an agreement to acquire cloud security company Wiz for USD 32 billion, highlighting major investment in cloud workload protection.
Report Scope
| Report Features | Description |
|---|---|
| Market Value (2025) | USD 164.9 Billion |
| Forecast Revenue (2035) | USD 585.5 Billion |
| CAGR (2026-2035) | 13.5% |
| Base Year for Estimation | 2025 |
| Historic Period | 2020-2024 |
| Forecast Period | 2026-2035 |
| Report Coverage | Revenue Forecast, Market Dynamics, Competitive Landscape, Recent Developments |
| Segments Covered | By Component (Software, Services, Professional Services, Managed Security Services); By Security Type (Endpoint Security, Network Security, Cloud Security, Application Security, Identity and Access Management (IAM), Data Security, Security Information and Event Management (SIEM), Vulnerability Management, Others); By Deployment Mode (Cloud-Based, On-Premises, Hybrid); By Organization Size (Small and Medium-Sized Enterprises (SMEs), Large Enterprises); By Application (Threat Detection and Prevention, Data Protection, Network Monitoring, Access Control and Authentication, Incident Response and Recovery, Compliance Management); By End-Use Industry (Banking, Financial Services, and Insurance (BFSI), IT and Telecommunications, Healthcare, Government and Public Sector, Retail and E-commerce, Manufacturing, Energy and Utilities, Aerospace and Defense, Others) |
| Regional Analysis | North America – US, Canada; Europe – Germany, France, The UK, Spain, Italy, Rest of Europe; Asia Pacific – China, Japan, South Korea, India, Australia, Singapore, Rest of APAC; Latin America – Brazil, Mexico, Rest of Latin America; Middle East & Africa – GCC, South Africa, Rest of MEA |
| Competitive Landscape | Microsoft Corporation, Palo Alto Networks, Inc., Cisco Systems, Inc., Fortinet, Inc., CrowdStrike Holdings, Inc., Broadcom Inc. (Symantec), Check Point Software Technologies Ltd., Trend Micro Incorporated, Gen Digital Inc., IBM Corporation, Sophos Limited, Trellix, SentinelOne, Inc., Zscaler, Inc., Qualys, Inc. |
| Customization Scope | Customization for segments and region/country-level will be provided. Moreover, additional customization can be done based on the requirements. |
| Purchase Options | We have three licenses to opt for: Single User License, Multi-User License (Up to 5 Users), Corporate Use License (Unlimited Users and Printable PDF) |