Report Overview
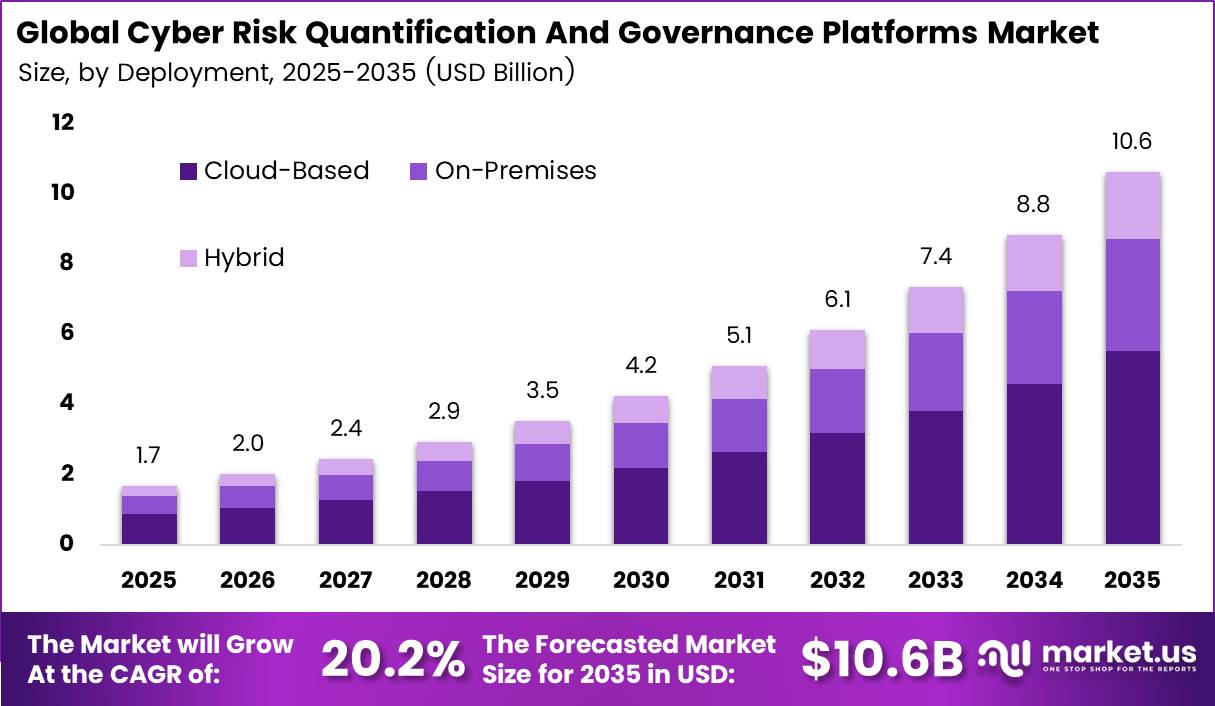
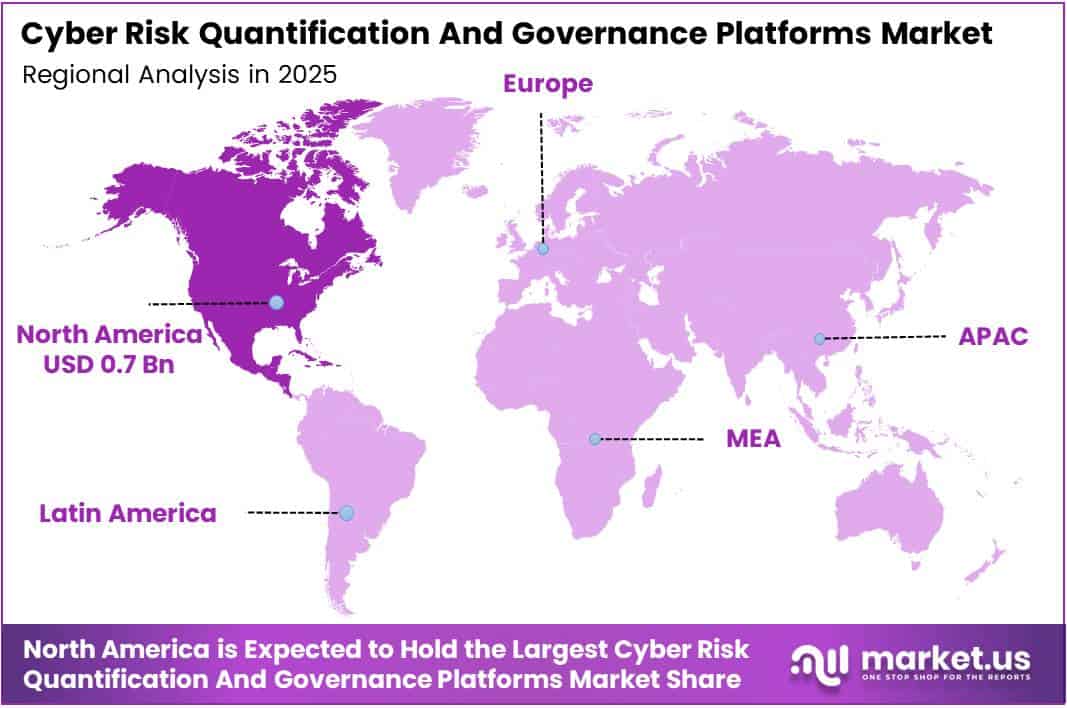
In 2025, the Global Cyber Risk Quantification And Governance Platforms Market was valued at USD 1.7 billion. The market is projected to grow at a CAGR of 20.2% during 2026–2035, reaching approximately USD 10.6 billion by 2035. North America dominated the global market in 2025, accounting for more than 39.0% of the total market share and generating approximately USD 0.7 billion in revenue.
Rising cyber losses drive this demand. The FBI Internet Crime Complaint Center (IC3) reported losses of USD 20.877 billion in 2025, up 26% from 2024. The IC3 also logged 1,008,597 complaints, its first year above one million.
Cyber-enabled fraud alone caused USD 17.697 billion in losses, or 85% of the total. Banks, insurers, and other large firms now need to turn these threats into dollar figures for their boards. That need creates direct demand for platforms that measure cyber risk in money terms, track compliance, and rank exposures by business impact.
The North America region faces the highest reported attack pressure among mature markets. According to the FBI IC3, ransomware complaints rose to 3,611 in 2025, up from 3,156 in 2024. Reported ransomware losses climbed 259% to USD 32.32 million. Business email compromise generated USD 3.046 billion in losses, the second-largest loss category.
Key Takeaways
- The Cyber Risk Quantification And Governance Platforms Market stood at USD 1.7 billion in 2025 and will reach USD 10.6 billion by 2035. at a CAGR of 20.2% from 2026 to 2035.
- By Component, Software / Platforms lead with a 68.0% share.
- By Platform Type, Cybersecurity Governance, Risk, and Compliance (GRC) Platforms lead with a 26.0% share.
- By Deployment Mode, Cloud-Based solutions lead with a 52.0% share.
- By Organization Size, Large Enterprises lead with a 66.0% share.
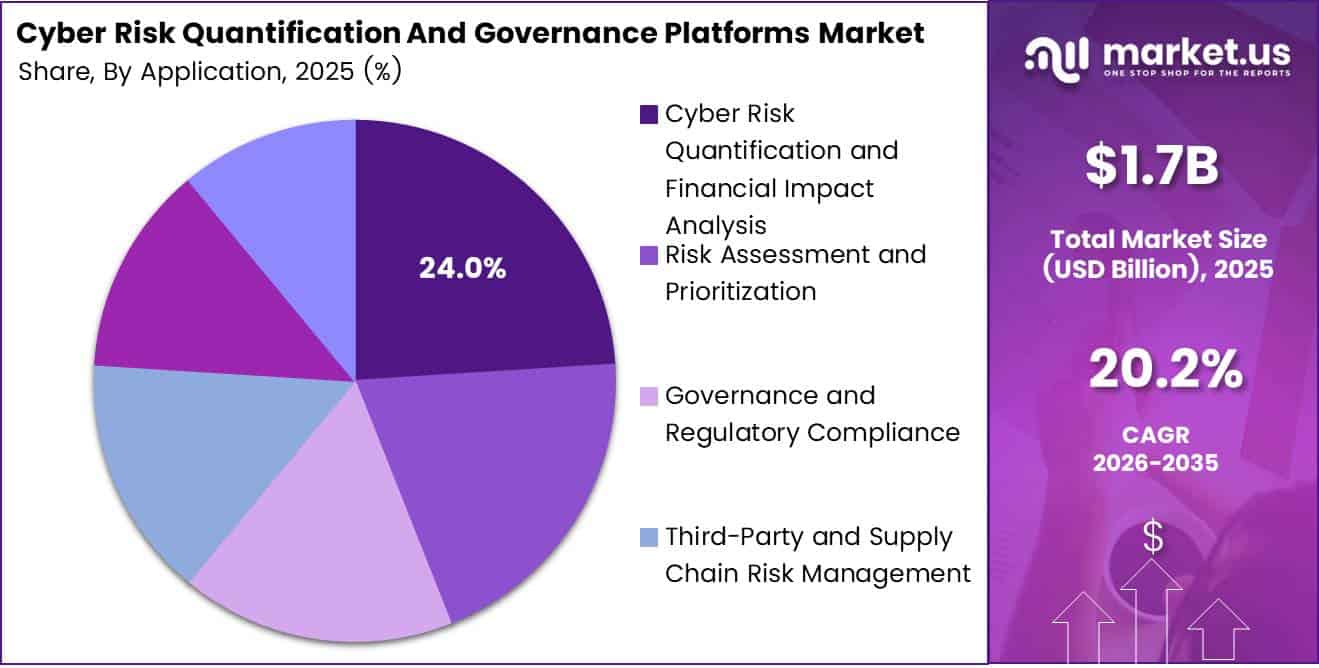
- By Application, Cyber Risk Quantification and Financial Impact Analysis lead with a 24.0% share.
- By End-Use Industry, BFSI leads with a 25.0% share.
- North America dominates with a 39.0% share and USD 0.7 billion in revenue.
By Component
Software / Platforms dominates with 68.0% due to automated, always-on risk scoring dashboards.
Software / Platforms lead the market because buyers want one place to see, score, and track cyber risk without hiring large teams. Rising losses push firms toward automated tools. The FBI’s Internet Crime Complaint Center logged 859,532 complaints in 2024, with reported losses of $16.6 billion, a 33% jump over 2023.
Services, led by Managed Services, form the fastest-growing area. Many firms buy software but lack the people to run it well. ISC2 puts the global cybersecurity workforce gap at 4.8 million people in 2024, up 19% in one year, while the active workforce grew only 0.1%. Managed service providers close this gap. They run models, tune data feeds, and prepare board reports for clients.
By Platform Type
Cybersecurity Governance, Risk, and Compliance (GRC) Platforms dominate with 26.0% due to rising mandatory cyber disclosure rules.
Cybersecurity GRC Platforms hold the largest share because regulators now require firms to prove they control cyber risk. Regulators ask for written policies, audit trails, and timely incident reports. GRC tools store this evidence in one system and map it to many frameworks at once.
Breach levels explain why boards keep funding these tools. The UK government’s Cyber Security Breaches Survey 2025 polled 2,180 businesses and found that 43% had faced a breach or attack in the past 12 months. Firms use GRC platforms to show auditors that they track these threats.
Cyber Risk Quantification Platforms grow fastest. Leaders no longer accept “high, medium, low” ratings. They want a dollar figure. IBM’s Cost of a Data Breach Report 2025 puts the global average breach cost at $4.44 million and the US average at a record $10.22 million. Figures like these let finance teams weigh cyber risk against other business risks.
By Deployment Mode
Cloud-Based dominates with 52.0% due to fast setup and lower upfront cost.
Cloud-Based deployment leads because firms can launch it within weeks, skip hardware costs, and get updates without extra work. Cloud tools also link easily with other software-as-a-service security products, which feed them risk data in real time.
Wider business habits support this lead. Eurostat reports that 52.74% of EU enterprises used paid cloud computing services in 2025, up 7.42 percentage points from 2023. Among medium-sized firms, the share reached 66.78%. As core systems move to the cloud, risk teams prefer platforms that sit in the same place.
By Organization Size
Large Enterprises dominate with 66.0% due to complex assets and bigger security budgets.
Large Enterprises control most of the spending because they run thousands of assets, work with many vendors, and operate in several countries. Spreadsheets cannot track risk at this scale. Boards and regulators also press large firms directly, and these firms have the budgets for full platform suites and in-house risk teams.
Digital maturity also works in their favor. The European Commission notes that 77.6% of large EU enterprises used cloud services in 2023, compared with 41.7% of small businesses. Large firms that already run modern IT systems can connect risk platforms faster and pull in richer data.
SMEs form the fastest-growing group. Attackers now go after smaller firms because they often have weaker defenses. FBI IC3 data shows 256,256 complaints with actual losses in 2024, with an average loss of $19,372 per complaint. A loss that size can badly hurt a small business.
By Application
Cyber Risk Quantification and Financial Impact Analysis dominates with 24.0% due to boards demanding cyber risk in dollars.
Cyber Risk Quantification and Financial Impact Analysis leads because boards and CFOs want cyber risk stated in money, not color codes. Dollar values help leaders set budgets, choose insurance limits, and rank projects. The FBI’s IC3 recorded business email compromise losses of about $2.77 billion in 2024, which shows how a single threat type can hit the balance sheet.
Third-Party and Supply Chain Risk Management grows fastest. Firms now depend on hundreds of vendors, cloud providers, and software suppliers, and each one gives attackers a new way in. Verizon’s 2025 Data Breach Investigations Report reviewed more than 22,000 incidents across 139 countries.
It found that third-party involvement in breaches doubled from 15% to 30% in one year, and that vulnerability exploitation rose 34%. These findings push firms to score vendors all the time instead of once a year. The EU’s Digital Operational Resilience Act also requires financial firms to manage technology supplier risk.
By End-Use Industry
Banking, Financial Services, and Insurance (BFSI) dominates with 25.0% due to strict regulators and high-value data.
BFSI holds the largest share because banks and insurers handle huge sums of money and sensitive customer data. Regulators require them to test cyber resilience, report incidents quickly, and set a clear risk appetite. These duties make quantification and governance platforms a core need, not an option.
Failure is also expensive. IBM’s Cost of a Data Breach Report 2025 shows that financial services firms faced an average breach cost of $5.56 million, the second-highest of any industry. Banks use risk platforms to tie these losses to capital planning and insurance decisions.
Healthcare grows fastest. Hospitals and clinics now run connected devices, electronic records, and AI tools, and attackers see them as easy, high-value targets. The same IBM study shows that healthcare had the highest breach cost for the 14th year in a row, at $7.42 million per breach. Healthcare firms also took 279 days on average to find and contain a breach, the longest of any sector.
Key Market Segments
By Component
- Software / Platforms
- Services
- Professional Services
- Managed Services
By Platform Type
- Cyber Risk Quantification Platforms
- Cybersecurity Governance, Risk, and Compliance (GRC) Platforms
- Third-Party Cyber Risk Management Platforms
- Cyber Risk Analytics and Reporting Platforms
- Cyber Exposure Management Platforms
By Deployment Mode
- Cloud-Based
- On-Premises
- Hybrid
By Organization Size
- Small and Medium-Sized Enterprises (SMEs)
- Large Enterprises
By Application
- Cyber Risk Quantification and Financial Impact Analysis
- Risk Assessment and Prioritization
- Governance and Regulatory Compliance
- Third-Party and Supply Chain Risk Management
- Cyber Insurance Risk Assessment
- Board-Level Risk Reporting and Decision Support
By End-Use Industry
- Banking, Financial Services, and Insurance (BFSI)
- IT and Telecommunications
- Healthcare
- Government and Public Sector
- Manufacturing
- Retail and E-commerce
- Energy and Utilities
- Others
Geopolitical Impact Analysis
Geopolitical conflict shapes this market through two channels: the hardware that runs these platforms and the threats they measure. Cloud and on-premises deployments depend on servers, chips, and network gear that move by sea. UNCTAD reported that Suez Canal transits stayed about 70% below 2023 levels as of May 2025, because carriers avoided the Red Sea.
Rerouting around the Cape of Good Hope turned voyages that once took days into trips of several weeks, according to UNCTAD. This delay slows data center hardware deliveries for hybrid and on-premises buyers. It also raises vendor costs for appliance-based exposure management tools. Freight volatility adds to this cost pressure. UNCTAD noted that spot rates from Shanghai to Jebel Ali rose 55% from May to June 2025.
The Strait of Hormuz adds a second risk. UNCTAD notes that this chokepoint handles 11% of global maritime trade. Energy shocks raise power costs for data centers, and that cost flows into cloud subscription prices for buyers in the Gulf and South Asia. Bulk shipping costs also rose. Capesize one-year charter rates averaged USD 22,953 per day in 2024, up from USD 16,389 in 2023.
These tensions also fuel demand. State-linked cyber activity rises when conflicts heat up. Insurers, banks, and suppliers then ask firms for hard numbers on their exposure. This shift helps third-party risk and cyber insurance assessment tools gain budget, even as hardware logistics grow more costly.
Regional Analysis
North America dominates the Cyber Risk Quantification and Governance Platforms Market, holding a 39.0% share and generating USD 0.7 billion in revenue. The US drives most of this demand. The country has a dense base of banks, insurers, tech firms, and federal agencies that must report cyber risk to boards and regulators.
Fraud data shows why buyers act fast. The FBI IC3 found that reported phishing losses jumped from USD 70 million in 2024 to USD 215 million in 2025. Adults aged 60 and older filed 201,266 complaints in 2025, up 37%. Their losses reached USD 7.748 billion, a 59% jump. Crypto-related complaints carried USD 11.366 billion in losses.
Asia Pacific is the fastest-growing region in this market. Fast digital growth widens the attack surface across China, Japan, South Korea, India, and Australia. ITU data shows internet use in Asia Pacific rose from 50% in 2019 to 77% in 2025. In India, CERT-In tracked 20,41,360 cybersecurity incidents in 2024, up from 15,92,917 in 2023.
Europe holds a strong position, led by Germany, France, the UK, Spain, and Italy. The EU NIS2 Directive covers 18 sectors, up from about 7 under the first NIS Directive. The expanded scope pulls an estimated 160,000 entities into stricter cyber risk rules. ITU data shows internet use in Europe at 92% in 2025. Firms must now prove supply chain security and report incidents quickly.
Key Regions and Countries
North America
- US
- Canada
Europe
- Germany
- France
- The UK
- Spain
- Italy
- Rest of Europe
Asia Pacific
- China
- Japan
- South Korea
- India
- Australia
- Rest of APAC
Latin America
- Brazil
- Mexico
- Rest of Latin America
Middle East and Africa
- GCC
- South Africa
- Rest of MEA
Market Dynamics
Drivers
| Driver | (~) % Impact on CAGR Forecast | Geographic Relevance | Impact Timeline |
|---|---|---|---|
| Mandatory Cyber Incident and Governance Disclosure Rules | +3.1% | North America, Europe | Short term (2 years or less) |
| EU NIS2 and DORA Board Accountability Enforcement | +2.6% | Europe | Short term (2 years or less) |
| Cyber Insurance Underwriting Data Requirements | +1.9% | North America, Europe | Medium term (2 to 4 years) |
| Rising Ransomware and Breach Loss Severity | +1.7% | Global | Short term (2 years or less) |
| Adoption of FAIR-Based Financial Risk Modeling | +1.2% | North America, Europe, APAC | Medium term (2 to 4 years) |
| Consolidation of GRC Tooling into Unified SaaS Platforms | +1.0% | Global | Medium term (2 to 4 years) |
Mandatory Cyber Incident and Governance Disclosure Rules
The U.S. Securities and Exchange Commission’s cybersecurity disclosure rule, effective December 2023, requires registrants to file Form 8-K Item 1.05 within 4 business days of determining an incident is material, and to describe board oversight and risk management processes annually under Regulation S-K Item 106.
This turned cyber risk from a technical metric into something that must be stated in financial terms. Per SEC EDGAR filing records, dozens of material-incident 8-K filings appeared in 2024 alone, and annual 10-K cybersecurity sections became standard for roughly 7,000+ domestic filers. The rule changed how buyers purchase.
Earnings-call commentary from listed security vendors in 2024–2025 shows multi-year platform ARR contracts replacing perpetual-license assessment tools, with net revenue retention commonly reported above 110%. Because the governance mandate creates demand on its own, customer acquisition costs are falling.
As reflected in NIST Cybersecurity Framework 2.0 (released February 2024), which added a dedicated “Govern” function, boards now need audit-ready, defensible loss-exposure figures, which pushes vendors toward recurring SaaS revenue with gross margins of 75–80%.
Restraints
| Restraint | (~) % Impact on CAGR Forecast | Geographic Relevance | Impact Timeline |
|---|---|---|---|
| Constrained Security Budgets Amid Elevated Interest Rates | -1.8% | Global | Short term (2 years or less) |
| Data Residency and Cross-Border Transfer Restrictions | -1.2% | Europe, China, India, Middle East | Medium term (2 to 4 years) |
| Legal Liability Concerns Over Quantified Risk Disclosure | -0.9% | North America | Short term (2 years or less) |
| Low SME Affordability and Procurement Capacity | -0.8% | APAC, Latin America, Africa | Medium term (2 to 4 years) |
| Public Sector Procurement Certification Barriers | -0.6% | North America, Europe | Medium term (2 to 4 years) |
Constrained Security Budgets Amid Elevated Interest Rates
The root cause is monetary tightening. Policy rates held at multi-decade highs through 2024, per Federal Reserve and European Central Bank rate decisions, and easing since then have only partly lowered corporate borrowing costs. IMF World Economic Outlook projections put global growth near 3%, so CFOs are scrutinizing discretionary software spending.
Cyber risk quantification is still often treated as optional analytics rather than core defense. When security budgets grow only 8–10% a year, as company-level security vendor disclosures suggest, spending goes to endpoint, identity, and detection tools first. The bottleneck shows up in sales cycles.
Listed security vendors have described longer deal cycles and more approval layers on earnings calls, with enterprise sales cycles stretching by 1–2 quarters. Mid-cap buyers are delaying platform rollouts, and BIS credit condition data show tighter lending standards for smaller firms. For vendors, the result is pressure on margins: discounts of 15–25% to close deals, deferred multi-year commitments, and slower conversion of pipeline into ARR.
Challenges
| Challenge | (~) % CAGR Friction Drag | Geographic Relevance | Mitigation Horizon |
|---|---|---|---|
| Cyber Risk Talent Shortage | -1.5% | Global | Long term (4 years or more) |
| Sparse Actuarial Loss Data | -1.1% | Global | Long term (4 years or more) |
| Fragmented Telemetry Integration Complexity | -0.9% | North America, Europe | Medium term (2 to 4 years) |
| Model Standardization Gaps | -0.7% | Global | Medium term (2 to 4 years) |
| Board-Level Risk Literacy Deficit | -0.5% | APAC, Middle East, Latin America | Medium term (2 to 4 years) |
Cyber Risk Talent Shortage
The weak point is people. These platforms need staff who combine security operations, actuarial statistics, and financial reporting skills, and very few professionals have all three. Per ISC2 workforce study data, the global cybersecurity workforce gap was about 4.8 million in 2024, and fewer than 10% of practitioners report formal training in quantitative risk methods.
The European Union Agency for Cybersecurity (ENISA) has also flagged risk management roles as among the hardest to fill. Over the long term, vendors will need to build AI copilots that automate scenario calibration, run certification programs with professional bodies, and bundle managed quantification services. These steps protect retention but cut blended gross margin by 3–5 percentage points.
Opportunities
| Opportunity | (~) % Potential CAGR Upside | Geographic Relevance | Execution Window |
|---|---|---|---|
| Third-Party and Supply Chain Risk Quantification | +2.2% | Global | Medium term (2 to 4 years) |
| AI Model Risk and AI Governance Quantification | +1.9% | Europe, North America | Short term (2 years or less) |
| Embedded Quantification for Insurers and Brokers | +1.4% | North America, Europe, APAC | Medium term (2 to 4 years) |
| Mid-Market and MSP Channel Packaging | +1.1% | APAC, Latin America | Medium term (2 to 4 years) |
| OT and Critical Infrastructure Risk Modeling | +0.9% | Global | Long term (4 years or more) |
Third-Party and Supply Chain Risk Quantification
This opportunity is still largely untapped. Most current deployments model a company’s own internal exposure, while vendor portfolio risk is still handled with qualitative questionnaires. That leaves a large share of demand unaddressed, even though DORA’s ICT third-party risk register requirements and NIS2 supply chain security obligations now push regulated entities to assess concentration risk across their vendors.
Each additional assessed vendor uses shared data models, so marginal delivery cost could fall 40–60% per assessment compared with consultant-led reviews. Vendors that capture this white space through network-effect data exchanges or roll-ups of security ratings providers could expand gross margin by 5–8 percentage points and raise average contract value by 25–35%.
Key Players Analysis
Tier 1 market leaders include Tenable, OneTrust, Bitsight, and SecurityScorecard. Tenable stands out as the largest public player. Its 10-K filing shows revenue of USD 999.4 million in 2025, up from USD 900.0 million in 2024. Tenable spent USD 223.7 million on research and development in 2025, about 22.4% of revenue and up 23% from USD 181.6 million.
Tenable also buys capability. It paid about USD 150 million for Vulcan Cyber, made up of USD 147 million in cash and USD 3 million in stock, to strengthen exposure prioritization. OneTrust leads in governance and compliance. It has raised USD 1.1 billion, holds a USD 4.5 billion valuation, and serves more than 14,000 companies.
Bitsight and SecurityScorecard lead in security ratings and third-party risk. Bitsight agreed to buy Cybersixgill for USD 115 million to add threat intelligence. It now serves more than 3,500 enterprises. SecurityScorecard says more than 25,000 organizations use its platform.
Tier 2 challengers hold strong niche positions. SAFE Security leads in financial risk quantification. It raised a USD 70 million Series C round, bringing total funding above USD 170 million, and then acquired Balbix to add exposure management. CyberCube, Kovrr, Axio, and C-Risk focus on insurance-grade loss modeling. UpGuard, Panorays, Black Kite, and Prevalent compete in vendor risk. MetricStream competes in enterprise GRC.
Top Key Players in the Market
- Bitsight Technologies, Inc.
- SecurityScorecard, Inc.
- SAFE Security, Inc.
- CyberCube Analytics, Inc.
- Axio Global, LLC
- Kovrr Ltd.
- Balbix, Inc.
- UpGuard, Inc.
- Panorays Ltd.
- Black Kite, Inc.
- C-Risk SAS
- OneTrust, LLC
- MetricStream, Inc.
- Prevalent, Inc.
- Tenable Holdings, Inc.
Recent Developments
- In February 2025, Tenable Holdings closed its acquisition of Vulcan Cyber for about USD 150 million, adding risk prioritization and remediation tools to its Tenable One exposure management platform.
- In June 2025, Tenable Holdings completed its acquisition of Apex Security for a total purchase price of USD 47.8 million, extending exposure management to the AI attack surface.
- In July 2025, SAFE Security raised USD 70 million in Series C funding led by Avataar Ventures and launched an autonomous Continuous Threat Exposure Management solution.
- In November 2025, SAFE Security acquired Balbix to build a unified platform for cyber risk quantification and exposure management, backed by more than USD 170 million in total funding.
- In May 2026, SecurityScorecard completed its acquisition of Driftnet, an internet scanning and threat intelligence firm, to strengthen third-party risk monitoring for its base of more than 25,000 organizations.
Report Scope
| Report Features | Description |
|---|---|
| Market Value (2025) | USD 1.7 Billion |
| Forecast Revenue (2035) | USD 10.6 Billion |
| CAGR (2026-2035) | 20.2% |
| Base Year for Estimation | 2025 |
| Historic Period | 2020-2024 |
| Forecast Period | 2026-2035 |
| Report Coverage | Revenue Forecast, Market Dynamics, Competitive Landscape, Recent Developments |
| Segments Covered | By Component (Software / Platforms, Services, Professional Services, Managed Services); By Platform Type (Cyber Risk Quantification Platforms, Cybersecurity Governance, Risk, and Compliance (GRC) Platforms, Third-Party Cyber Risk Management Platforms, Cyber Risk Analytics and Reporting Platforms, Cyber Exposure Management Platforms); By Deployment Mode (Cloud-Based, On-Premises, Hybrid); By Organization Size (Small and Medium-Sized Enterprises (SMEs), Large Enterprises); By Application (Cyber Risk Quantification and Financial Impact Analysis, Risk Assessment and Prioritization, Governance and Regulatory Compliance, Third-Party and Supply Chain Risk Management, Cyber Insurance Risk Assessment, Board-Level Risk Reporting and Decision Support); By End-Use Industry (Banking, Financial Services, and Insurance (BFSI), IT and Telecommunications, Healthcare, Government and Public Sector, Manufacturing, Retail and E-commerce, Energy and Utilities, Others) |
| Regional Analysis | North America – US, Canada; Europe – Germany, France, The UK, Spain, Italy, Rest of Europe; Asia Pacific – China, Japan, South Korea, India, Australia, Singapore, Rest of APAC; Latin America – Brazil, Mexico, Rest of Latin America; Middle East & Africa – GCC, South Africa, Rest of MEA |
| Competitive Landscape | Bitsight Technologies, Inc., SecurityScorecard, Inc., SAFE Security, Inc., CyberCube Analytics, Inc., Axio Global, LLC, Kovrr Ltd., Balbix, Inc., UpGuard, Inc., Panorays Ltd., Black Kite, Inc., C-Risk SAS, OneTrust, LLC, MetricStream, Inc., Prevalent, Inc., Tenable Holdings, Inc. |
| Customization Scope | Customization for segments, region/country-level will be provided. Moreover, additional customization can be done based on the requirements. |
| Purchase Options | We have three licenses to opt for: Single User License, Multi-User License (Up to 5 Users), Corporate Use License (Unlimited Users and Printable PDF) |