Report Overview
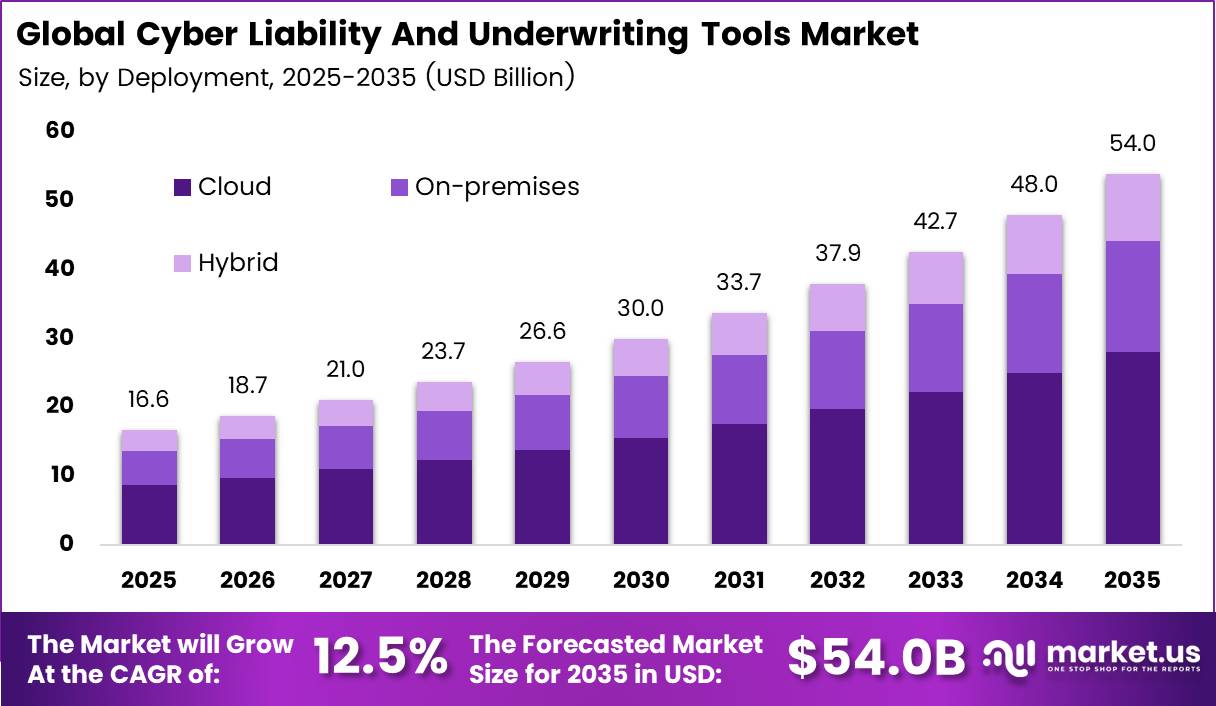
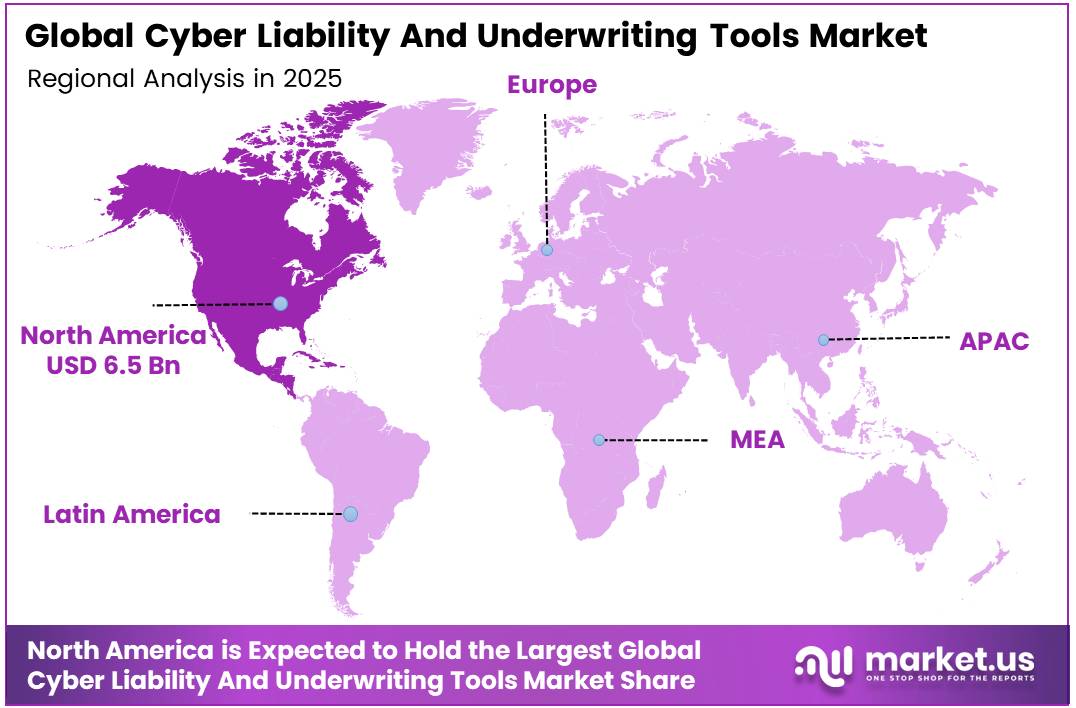
In 2025, the Global Cyber Liability And Underwriting Tools Market was valued at USD 16.6 billion. The market is projected to grow at a 12.5% CAGR during 2026–2035, reaching approximately USD 54.0 billion by 2035. North America dominated the global market in 2025, accounting for more than 39.0% of the total market share and generating approximately USD 6.5 billion in revenue.
The NAIC reported that global cyber insurance premiums reached nearly USD 15 billion in 2024, up 7% from the year before. In the US, total direct written premium climbed to about USD 9.46 billion in 2025, a 3.5% rise. Domestic policies in force jumped 33% to 5.84 million. At the same time, claims rose 20%, the loss ratio climbed to 53, and rates fell for an eighth straight quarter.
The US holds the world’s deepest cyber insurance pool. According to the NAIC, premiums written by US-based insurers grew from about USD 2.75 billion in 2020 to USD 7.46 billion in 2025, so the market almost tripled in five years. Losses are also growing fast.
For firms with at least USD 1 billion in annual revenue, the average claim hit USD 4.4 million in 2025, double the 2024 figure and up 586% since 2021. Primary cyber policies make up about 64% of US premiums. These big standalone policies need detailed, data-driven underwriting, which keeps US insurers, brokers, and MGAs as the largest buyers of these tools.
Key Takeaways
- The Global Cyber Liability And Underwriting Tools Market reached USD 16.6 billion in 2025 and will reach USD 54.0 billion by 2035. at a CAGR of 12.5% from 2026 to 2035.
- By Component, Software / Platforms leads with a 68.0% share.
- By Platform Type, Cybersecurity Governance, Risk, and Compliance (GRC) Platforms lead with a 26.0% share.
- By Deployment Mode, Cloud-Based leads with a 52.0% share.
- By Organization Size, Large Enterprises lead with a 66.0% share.
- By Application, Cyber Risk Quantification and Financial Impact Analysis lead with a 24.0% share.
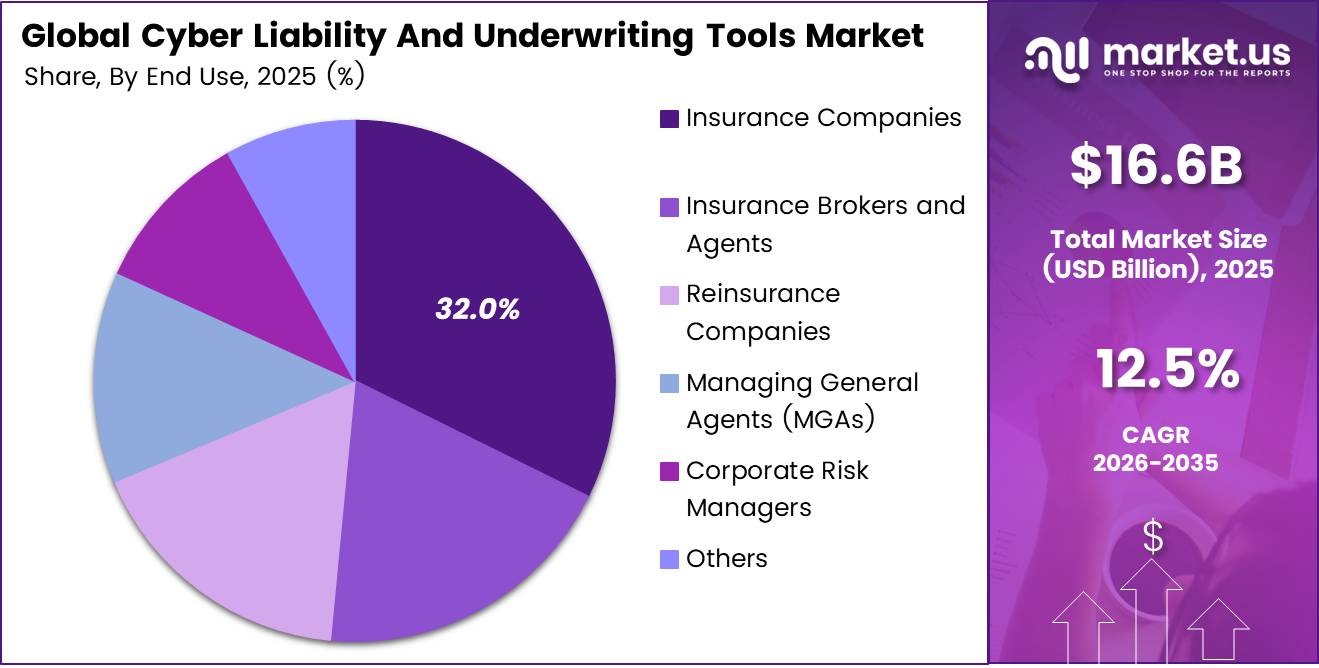
- By End-Use Industry, Insurance Companies lead with a 32.0% share.
- North America dominates with a 39.0% share and USD 6.5 billion in revenue.
By Component
Software / Platforms dominate with 68.0% due to real-time automated risk scoring at scale.
Software / Platforms lead because underwriters need one live view of each client’s cyber risk. The FBI logged 859,532 internet crime complaints in 2024, with reported losses of $16.6 billion, a 33% jump from 2023. That much claims data is too large for manual review, so insurers buy platforms that score risk, price policies, and flag weak controls in minutes.
Managed Services form the fastest-growing part of this group. Ransomware complaints against critical infrastructure rose 9% in 2024, and many carriers lack in-house staff to watch threats around the clock. They now hand scanning, alert review, and data upkeep to outside teams. Professional Services also gain as firms need help setting up tools and linking them with policy systems.
By Platform Type
Cybersecurity Governance, Risk, and Compliance (GRC) Platforms dominate with 26.0% due to strict SEC cyber incident disclosure rules.
GRC platforms hold the top spot because new rules tie cyber risk to board duty. The SEC requires public companies to file a Form 8-K within 4 business days after they decide a cyber incident is material. GRC tools help firms track controls, log decisions, and prove compliance on demand, so insurers and clients work from one shared record.
Third-Party Cyber Risk Management Platforms grow fastest. Attackers now get in through vendors, software suppliers, and new AI tools instead of the main network. IBM found that 97% of AI-related breaches involved systems without proper access controls, and breaches cost U.S. firms an average of $10.22 million.
By Deployment Mode
Cloud-Based dominates with 52.0% due to fast setup and live threat feeds.
Cloud-Based tools lead because carriers want quick setup and live threat data. Eurostat reports that 52.74% of EU enterprises bought paid cloud services in 2025, up 7.42 percentage points from 2023. As clients move their data online, underwriting tools that also run in the cloud can pull scan results.
Cloud vendors also push frequent updates, so risk models stay current as new attack types appear. Hybrid deployment grows fastest. Large insurers and reinsurers hold sensitive policyholder records that they prefer to keep on their own servers for privacy and audit reasons. They still want cloud speed for analytics and partner sharing.
By Organization Size
Large Enterprises dominate with 66.0% due to high breach exposure and strict oversight.
Large Enterprises lead because they face the biggest losses and the toughest checks from boards, regulators, and insurers. They run complex networks across many countries, buy high policy limits, and must give underwriters detailed risk data.
SMEs grow fastest. The U.S. SBA counts 34.8 million small businesses, which make up 99.9% of all U.S. firms and employ 45.9% of U.S. workers. Most have little cyber staff, and attackers target them because their defenses are weak. Insurers now sell simple packaged coverage to this huge base.
The NAIC counted 4,369,741 cyber policies in force in 2023, up 11.7% in one year. Low-cost scoring tools let carriers quote these small accounts quickly and profitably. Brokers also bundle risk checks with cover, which helps owners fix basic gaps before they buy.
By Application
Cyber Risk Quantification and Financial Impact Analysis dominates with 24.0% due to insurers’ need to price risk in dollars.
This application leads because boards and insurers want risk shown in dollars, not color codes. The NAIC reports that the U.S. cyber loss ratio climbed to 53% in 2025 from 48.7% in 2024. Rising claims push carriers to model how much a breach, outage, or ransomware event could cost each client before they set limits and prices. These models feed directly into pricing engines.
Clear money figures also help risk managers justify security budgets to finance teams. Third-Party and Supply Chain Risk Management grows fastest. Modern firms rely on cloud hosts, payment providers, and software vendors, and one supplier breach can spread to thousands of customers at once.
By End-Use Industry
Insurance companies dominate with 32.0% due to direct ownership of policy risk pricing.
Insurance Companies lead because they carry the risk and need tools at every step of the policy cycle. U.S. cyber premiums reached about $9.46 billion in 2025. Domestic insurers wrote nearly $7.46 billion of that total, up from $2.75 billion in 2020. Carriers use underwriting platforms to screen applicants, price cover, and track exposure across their full book.
Global cyber premiums reached nearly $15 billion in 2024, up 7%, and most of that growth came from outside the U.S. MGAs often enter these new markets first. Carriers that want fast reach without new hiring partner with MGAs, and each new partnership adds demand for shared risk platforms.
Key Market Segments
By Component
- Software / Platforms
- Services
- Professional Services
- Managed Services
By Platform Type
- Cybersecurity Governance, Risk, and Compliance (GRC) Platforms
- Cyber Risk Quantification Platforms
- Third-Party Cyber Risk Management Platforms
- Cyber Risk Analytics and Reporting Platforms
- Cyber Exposure Management Platforms
By Deployment Mode
- Cloud-Based
- On-Premises
- Hybrid
By Organization Size
- Small and Medium-Sized Enterprises (SMEs)
- Large Enterprises
By Application
- Cyber Risk Quantification and Financial Impact Analysis
- Risk Assessment and Prioritization
- Governance and Regulatory Compliance
- Third-Party and Supply Chain Risk Management
- Cyber Insurance Risk Assessment
- Board-Level Risk Reporting and Decision Support
By End-Use Industry
- Insurance Companies
- Insurance Brokers and Agents
- Reinsurance Companies
- Managing General Agents (MGAs)
- Corporate Risk Managers
- Others
Geopolitical Impact Analysis
Trade tensions now shape the cost base of cyber underwriting tools. These platforms run on cloud servers, chips, and data center gear. The WTO warns that in trade-restrictive scenarios, average ad valorem tariffs could rise to between 25% and 30%. Any tariff on servers and networking hardware raises hosting costs for cloud-based risk platforms.
Some shielding exists. The WTO notes that AI-related goods such as semiconductors and processors drove 42% of global trade growth in 2025. Most data center inputs face low or zero tariffs under the Information Technology Agreement, which has 84 participants. This keeps hardware costs for vendors stable for now.
Price pressure still shows up. The WTO found that the dollar value of world merchandise trade rose 15% year on year in the first half of 2026, while volume grew only 3.5%. Prices, not quantities, drove most of that gap. The IMF expects global inflation to rise to 4.7% in 2026. Higher energy prices push up power costs for data centers, and vendors pass some of that into license and subscription prices.
Conflict also changes demand. The WTO links weaker trade in parts of the world to the war in the Middle East. It raised its 2026 merchandise trade volume forecast to 3.9% from 1.9% because the AI boom offset the shock. North American imports fell 3.2% in the first half of 2026 after tariff frontloading. State-linked cyber activity tied to these conflicts raises systemic risk for insurers.
Regional Analysis
North America dominates the Cyber Liability And Underwriting Tools Market, holding a 39.0% share and generating USD 6.5 billion in revenue. The US drives this lead through the world’s largest cyber insurance base. NAIC data shows that alien surplus lines insurers wrote about USD 2 billion of US cyber premium in 2025.
These carriers rely heavily on outside data and scoring tools to price risk they do not see firsthand. Endorsement policies rose 53.8% in 2025 and made up nearly 53% of policies in force. Yet they brought in only 4% of premium. Insurers need fast, low-cost automated underwriting to handle this high volume of small policies. Excess policies, in contrast, declined 45.3%.
Asia Pacific is the fastest-growing region in the market. The IMF projects regional growth of 4.8% in 2026, and India remains the fastest-growing major economy at 7.0%. The ITU puts internet use in Asia Pacific at 77%. The WTO expects Asia to lead merchandise import growth at 9.5% in 2026. Cyber insurance coverage in China, Japan, South Korea, India, and Australia still trails the US.
Europe holds the second largest position, led by Germany, France, the UK, Spain, and Italy. The ITU reports that between 88% and 93% of people in Europe use the internet, which creates a wide digital attack surface. The UK hosts the Lloyd’s market and many cyber MGAs. EU rules such as NIS2 and DORA push firms to measure and report cyber risk.
Key Regions and Countries
North America
- US
- Canada
Europe
- Germany
- France
- The UK
- Spain
- Italy
- Rest of Europe
Asia Pacific
- China
- Japan
- South Korea
- India
- Australia
- Rest of APAC
Latin America
- Brazil
- Mexico
- Rest of Latin America
Middle East and Africa
- GCC
- South Africa
- Rest of MEA
Market Dynamics
Drivers
| Driver | (~) % Impact on CAGR Forecast | Geographic Relevance | Impact Timeline |
|---|---|---|---|
| Ransomware Loss Frequency Escalation | +2.8% | Global, led by North America | Short term (2 years or less) |
| Mandatory Cyber Incident Disclosure Rules | +2.2% | North America, Europe | Short term (2 years or less) |
| Outside-In Risk Scanning Adoption | +1.9% | North America, Europe | Medium term (2 to 4 years) |
| Carrier Shift to API-Based Underwriting | +1.6% | Global | Medium term (2 to 4 years) |
| Reinsurance Capacity Re-Expansion | +1.2% | Global, Lloyd’s & Bermuda hubs | Short term (2 years or less) |
Ransomware Loss Frequency Escalation
Ransomware and business email compromise keep driving loss frequency up. The FBI Internet Crime Complaint Center recorded losses above USD 12.5 billion in 2023 and about USD 16.6 billion in 2024, a jump of roughly 33%.
The February 2024 Change Healthcare attack reached about 190 million people, per US Department of Health and Human Services breach filings, and UnitedHealth Group earnings disclosures put the response cost above USD 3 billion. Large losses like these have pushed carriers to drop static questionnaires and adopt continuous underwriting tools.
These tools score exposure against controls such as MFA, EDR coverage, and backup isolation, which incident data published by large commercial carriers links to claim-frequency drops of roughly 30% to 40% among compliant insureds.
Underwriting software is moving from one-time licensing to recurring SaaS subscriptions priced by policy count. Carriers also bundle scanning and pre-breach services into premiums, which cuts broker acquisition costs and lifts renewal retention by an estimated 5 to 8 percentage points.
Restraints
| Restraint | (~) % Impact on CAGR Forecast | Geographic Relevance | Impact Timeline |
|---|---|---|---|
| Systemic Catastrophe Aggregation Exclusions | -1.6% | Global, Lloyd’s markets | Short term (2 years or less) |
| Soft Pricing Cycle Premium Deflation | -1.2% | North America, UK | Short term (2 years or less) |
| Cross-Border Data Localization Laws | -0.9% | Asia-Pacific, Middle East, China | Medium term (2 to 4 years) |
| SME Affordability and Budget Freezes | -0.8% | Emerging Markets, Southern Europe | Short term (2 years or less) |
| Ransom Payment Prohibition Proposals | -0.6% | UK, Australia, Select US States | Medium term (2 to 4 years) |
Systemic Catastrophe Aggregation Exclusions
Insurers fear one event could trigger losses across thousands of policies at once, and this correlated-loss risk is the main hard stop on cyber capacity. Lloyd’s Market Association bulletin LMA Y5433 required state-backed cyberattack exclusions on standalone policies from 31 March 2023.
The July 2024 CrowdStrike outage crashed about 8.5 million Windows devices, according to Microsoft disclosures, and carrier earnings commentary put insured losses at around USD 1.5 billion. The Bank of England Prudential Regulation Authority now requires cyber catastrophe stress testing.
Underwriting desks also put off spending on new platforms until they can model accumulation clearly. Estimates from carrier investor presentations suggest underwriting-tool budgets at affected desks drop by roughly 10% to 15% when large-limit placements shrink.
Challenges
| Challenge | (~) % CAGR Friction Drag | Geographic Relevance | Mitigation Horizon |
|---|---|---|---|
| Cyber Actuarial Talent Shortage | -1.4% | Global | Long term (4 years or more) |
| Sparse Historical Loss Data | -1.1% | Global | Medium term (2 to 4 years) |
| Legacy Policy Admin Integration | -0.8% | North America, Europe | Medium term (2 to 4 years) |
| AI-Driven Threat Model Drift | -0.7% | Global | Short term (2 years or less) |
| Scan Accuracy and False Positives | -0.5% | North America, Europe | Short term (2 years or less) |
Cyber Actuarial Talent Shortage
Cyber underwriting needs people with both actuarial and security skills, and very few have that combination. The ISC2 Cybersecurity Workforce Study estimated a global shortfall of about 4.8 million security professionals in 2024, a 19% increase from the prior year. Society of Actuaries membership data shows only a small number of credentialed actuaries specialize in cyber risk.
The skills premium shows up in pay: US Bureau of Labor Statistics wage data puts annual information security analyst pay growth at around 4% to 5%, above the broader insurance workforce. To work around the gap, carriers are training underwriters in-house, partnering with universities, and shifting to explainable decision tools that rely less on specialist judgment.
Opportunities
| Opportunity | (~) % Potential CAGR Upside | Geographic Relevance | Execution Window |
|---|---|---|---|
| Embedded SME Cyber Distribution | +2.0% | Asia-Pacific, Latin America, India | Medium term (2 to 4 years) |
| Cyber Catastrophe Bonds and ILS Analytics | +1.5% | Bermuda, US, UK | Medium term (2 to 4 years) |
| Parametric Cyber Outage Products | +1.2% | Global | Long term (4 years or more) |
| OT and Industrial Cyber Underwriting | +1.0% | Europe, Middle East, North America | Long term (4 years or more) |
| Generative AI Liability Coverage Modules | +0.8% | North America, Europe | Medium term (2 to 4 years) |
Embedded SME Cyber Distribution
Small and mid-sized businesses remain a largely untapped segment because current distribution does not reach them, not because they have no need for cover. The OECD SME and Entrepreneurship Outlook counts SMEs as about 90% of businesses worldwide.
India’s Ministry of Micro, Small and Medium Enterprises reports more than 60 million units, and CERT-In logged around 1.6 million incidents in 2023, yet cyber cover among these firms is still in low single digits. This is an opportunity rather than a current driver because broker-led selling costs too much per policy at SME premium levels.
Embedding coverage in cloud accounting, payments, and banking platforms through automated underwriting APIs can bring acquisition cost per policy down by an estimated 40% to 60%.
Automated scoring and straight-through binding can also cut underwriting expense ratios by roughly 5 to 10 percentage points, and IRDAI’s sandbox framework gives carriers a regulatory path to test these products. Tool vendors would earn per-transaction revenue on high-volume, low-ticket policies, with margins of 15% to 20% above traditional per-seat licensing.
Key Players Analysis
Tier 1 leaders combine large revenue bases with deep insurance data. Verisk posted USD 3,072.7 million in revenue in 2025 and spent USD 40.9 million on research and development. Moody’s reported Decision Solutions revenue of USD 1,692 million in 2025. Its Moody’s RMS models support cyber and catastrophe risk work for insurers.
Guidewire, owner of the Cyence analytics engine, grew subscription and support revenue 33% to USD 731.3 million in fiscal 2025. In fiscal 2026, it generated USD 389.7 million in cash from operations, up from USD 300.9 million. That cash lets it keep investing in cloud underwriting tools.
Tier 2 challengers hold strong niche positions. Coalition raised a USD 250 million Series F round at a USD 5 billion valuation to fund its active insurance model. BitSight has raised USD 148 million in equity across 5 priced rounds. SecurityScorecard reported a 40% improvement in ARR per employee along with positive free cash flow.
Insurers also shape the market as buyers and owners. Travelers, parent of Corvus, wrote USD 543.9 million in US cyber premiums in 2025. It ranked third among US-based insurers with a 7.19% share. CyberCube, Kovrr, Black Kite, Cyberwrite, KYND, and Cytora compete on cyber risk quantification, third-party risk, and AI-driven risk intake.
Top Key Players in the Market
- CyberCube Analytics, Inc.
- Guidewire Software, Inc. (Cyence)
- BitSight Technologies, Inc.
- Kovrr Ltd.
- Coalition, Inc.
- At-Bay, Inc.
- Resilience Cyber Insurance Solutions, Inc.
- Corvus Insurance (Travelers)
- SecurityScorecard, Inc.
- Black Kite, Inc.
- Moody’s RMS
- Verisk Analytics, Inc.
- Cyberwrite Ltd.
- KYND Limited
- Cytora Limited
Recent Developments
- In January 2025, Moody’s acquired CAPE Analytics to add AI-powered geospatial risk data to its insurance models. The deal helped lift Moody’s insurance revenue by 15% in 2025.
- In September 2025, Guidewire reported fiscal 2025 total revenue of USD 1,202.5 million, up 23%, driven by growth in cloud underwriting platforms.
- In February 2026, Verisk reported a 2025 adjusted EBITDA margin of 56.2%, up 150 basis points, with diluted adjusted EPS of USD 7.16.
- In August 2026, Munich Re agreed to buy At-Bay at an enterprise value of USD 575 million. At-Bay wrote USD 278 million in gross premiums in 2025.
- In October 2026, Travelers raised its cyber quota share cession to 75% from 40% at a flat commission.
Report Scope
| Report Features | Description |
|---|---|
| Market Value (2025) | USD 16.6 Billion |
| Forecast Revenue (2035) | USD 54.0 Billion |
| CAGR (2026-2035) | 12.5% |
| Base Year for Estimation | 2025 |
| Historic Period | 2020-2024 |
| Forecast Period | 2026-2035 |
| Report Coverage | Revenue Forecast, Market Dynamics, Competitive Landscape, Recent Developments |
| Segments Covered | By Component (Software / Platforms, Services, Professional Services, Managed Services); By Platform Type (Cybersecurity Governance, Risk, and Compliance (GRC) Platforms, Cyber Risk Quantification Platforms, Third-Party Cyber Risk Management Platforms, Cyber Risk Analytics and Reporting Platforms, Cyber Exposure Management Platforms); By Deployment Mode (Cloud-Based, On-Premises, Hybrid); By Organization Size (Small and Medium-Sized Enterprises (SMEs), Large Enterprises); By Application (Cyber Risk Quantification and Financial Impact Analysis, Risk Assessment and Prioritization, Governance and Regulatory Compliance, Third-Party and Supply Chain Risk Management, Cyber Insurance Risk Assessment, Board-Level Risk Reporting and Decision Support); By End-Use Industry (Insurance Companies, Insurance Brokers and Agents, Reinsurance Companies, Managing General Agents (MGAs), Corporate Risk Managers, Others) |
| Regional Analysis | North America – US, Canada; Europe – Germany, France, The UK, Spain, Italy, Rest of Europe; Asia Pacific – China, Japan, South Korea, India, Australia, Singapore, Rest of APAC; Latin America – Brazil, Mexico, Rest of Latin America; Middle East & Africa – GCC, South Africa, Rest of MEA |
| Competitive Landscape | CyberCube Analytics, Inc., Guidewire Software, Inc. (Cyence), BitSight Technologies, Inc., Kovrr Ltd., Coalition, Inc., At-Bay, Inc., Resilience Cyber Insurance Solutions, Inc., Corvus Insurance (Travelers), SecurityScorecard, Inc., Black Kite, Inc., Moody’s RMS, Verisk Analytics, Inc., Cyberwrite Ltd., KYND Limited, Cytora Limited |
| Customization Scope | Customization for segments and region/country-level will be provided. Moreover, additional customization can be done based on the requirements. |
| Purchase Options | We have three licenses to opt for: Single User License, Multi-User License (Up to 5 Users), Corporate Use License (Unlimited Users and Printable PDF) |