Report Overview
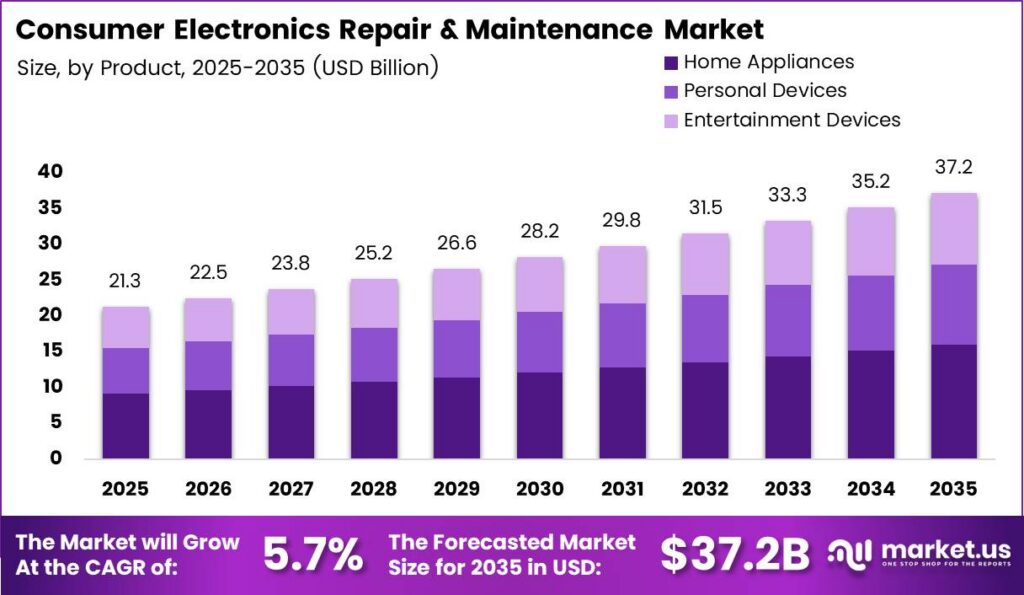
Global Consumer Electronics Repair And Maintenance Market size is expected to be worth around USD 37.2 Billion by 2035 from USD 21.3 Billion in 2025, growing at a CAGR of 5.7% during the forecast period 2026 to 2035. Consumer electronics repair and maintenance services encompass hardware diagnostics, component replacement, microsoldering, firmware calibration, and preventive servicing to restore household appliances, entertainment systems, and personal computing devices.
Service providers operate through authorized manufacturer depots, retail service counters, and independent neighborhood workshops serving residential households, commercial offices, and industrial facilities. According to US Census Bureau, U.S. Electronic and Precision Equipment Repair and Maintenance counted 10,917 employer establishments employing 89,305 workers with USD 6.1 Billion in annual payroll in 2023. High technician wage density forces multi-site operators to centralize complex board repairs into regional hubs to protect operating margins.
Key Takeaways
- The global Consumer Electronics Repair And Maintenance Market was valued at USD 21.3 Billion in 2025.
- Global market revenue will reach USD 37.2 Billion by 2035.
- Market expansion will advance at a CAGR of 5.7% from 2026 to 2035.
- Home Appliances led the Product segment with a 43.00% market share in 2025, while Personal Devices represents the fastest-growing category.
- Authorized Service Centers captured a dominant 71.23% share of the Service Providers segment in 2025, whereas Independent Repair Shops grow fastest.
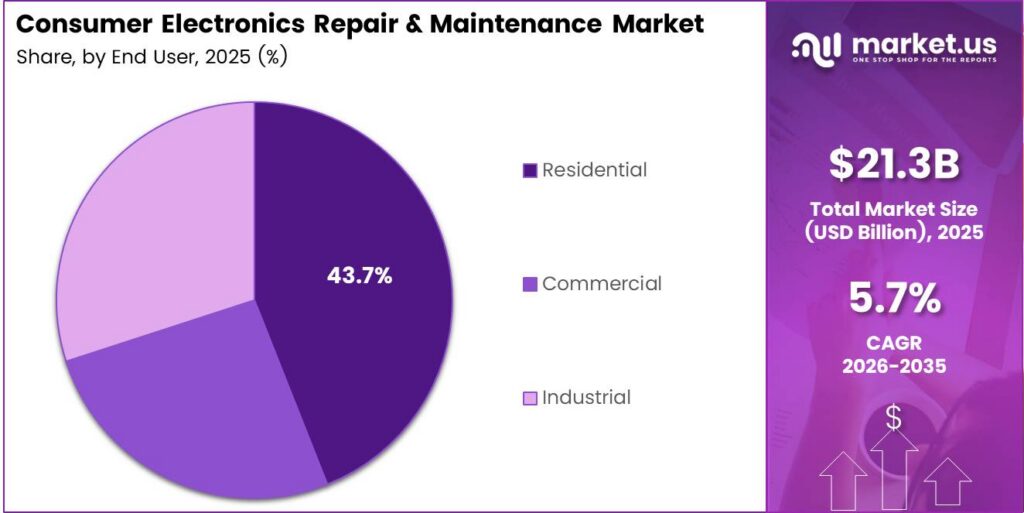
- Residential users held the largest End User share at 43.78% in 2025 and also record the fastest growth trajectory.
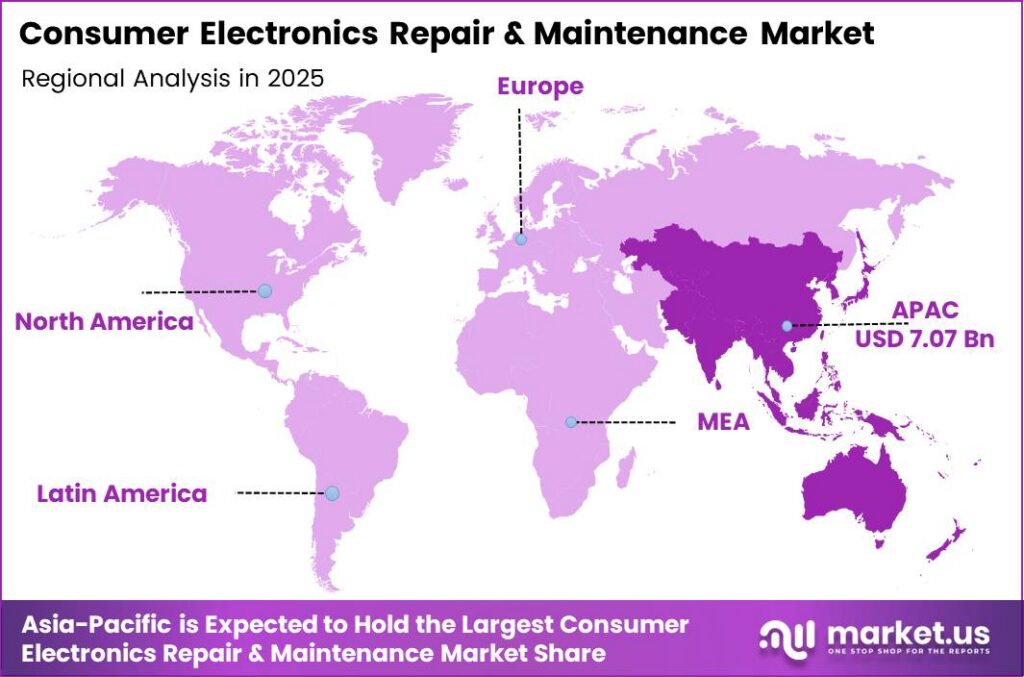
- Asia-Pacific dominated regional revenue with a 33.23% share valued at USD 7.07 Billion in 2025, while Middle East and Africa expands fastest.
- The study evaluates industry performance across the 2026 to 2035 forecast period.
Therefore, statutory right-to-repair laws and national circular-economy targets now push hardware owners toward component repair over premature disposal. Data from ITU shows global electronic waste reached 62 Billion kg in 2022 and will hit 82 Billion kg by 2030, while formal networks collected only 22.3%. Consequently, regulators compel manufacturers to release spare parts and schematics, unlocking recurring post-warranty revenue for compliant repair chains.
This reflects active consolidation among global protection and repair administrators seeking cross-category scale. In October 2026, enterprise care leader Asurion completed a GBP 2.1 Billion or USD 2.8 Billion acquisition of Domestic and General, adding 22 Million protected appliances and 2.6 Million annual repairs across 12 markets. Such large-scale buyouts signal that investors favor unified subscription platforms covering both mobile gadgets and household white goods.
Asia-Pacific leads the global market with a 33.23% revenue share in 2025, supported by dense electronics manufacturing hubs and vast urban consumer bases. As reported by JEITA, global electronics and IT production rose 11% to USD 4,118.4 Billion in 2025 and will expand 10% to USD 4,510.3 Billion in 2026 . Expanding hardware output across Asian factories directly enlarges the installed device base requiring post-warranty maintenance and parts logistics.
Consequently, venture and institutional capital continues flowing into digital after-sales platforms that connect original equipment brands with local repair depots. In January 2026, lifecycle platform Servify closed a USD 12.21 Million IFC equity investment and a USD 5 Million Series D3 tranche across 75 plus brand partnerships . This capital inflow enables software-led aggregators to standardize spare-part pricing and capture carrier warranty contracts across emerging markets.
Product Analysis
Home Appliances dominates with 43.00% share in 2025 due to high replacement costs of white goods.
In 2025, Home Appliances held a 43.00% share in the Product segment of the Consumer Electronics Repair And Maintenance Market. US Census Bureau found that U.S. appliance repair comprised 5,595 establishments employing 24,600 workers with USD 1.2 Billion payroll in 2023, while Encompass deployed an AI agent resolving 64% of part inquiries . Heavy compressor wear in refrigerators and washers requires on-site component swaps, rewarding distributors with automated OEM parts fulfillment.
Entertainment Devices generate steady service ticket volumes across large-format living-room displays and home theater systems. Based on ITU data, screens and monitors produced 5.9 Billion kg of global e-waste with 25% formal recycling, and in January 2024 Samsung and Encompass expanded self-repair to nearly 50 models including 20 home entertainment units . Power-board surges and backlight degradation make board replacement far cheaper than buying new televisions, supporting authorized part distributors.
Personal Devices represent the fastest-growing product category as consumers carry fragile mobile hardware daily. Eurostat indicates that nearly 90% of European Union individuals used mobile devices for internet access alongside 56% on laptops in 2025, while Framework raised USD 18 Million in April 2024 across 13 countries for modular laptops . Daily battery charge cycles and accidental drops create constant screen and cell replacement needs, driving walk-in shop margins.
Service Providers Analysis
Authorized Service Centers dominates with 71.23% share in 2025 due to warranty terms and genuine parts access.
In 2025, Authorized Service Centers held a 71.23% share in the Service Providers segment of the Consumer Electronics Repair And Maintenance Market. Figures from US Census Bureau show U.S. employer electronics stores generated USD 63.77 Billion and appliance stores recorded USD 20.51 Billion in 2024 revenue . Big-box retail chains bundle manufacturer warranties and calibrated factory diagnostic tools at checkout, locking in predictable repair volume for contracted depot operators.
Independent Repair Shops represent the fastest-growing service provider channel for out-of-warranty hardware owners seeking fast turnarounds. According to Eurostat, 198,000 European Union repair enterprises employed 340,000 workers and generated EUR 9.1 Billion in value added, with computer and communication repair capturing 50.4% of turnover . Right-to-repair bans on software parts pairing allow local technicians to source genuine assemblies, making neighborhood chains attractive roll-up acquisition targets.
Insurance-backed franchise and recommerce networks bridge authorized OEM standards with rapid omnichannel fulfillment for carrier subscribers. In October 2024, Allstate Protection Plans acquired mobile lifecycle firm Kingfisher to expand repair and trade-in capacity across 150 Million active subscribers and 8 Million annual service events . Carrier protection plans steer millions of cracked smartphones directly into contracted repair hubs, guaranteeing high bench utilization for partner networks.
End User Analysis
Residential dominates with 43.78% share in 2025 due to rising multi-device ownership per household.
In 2025, Residential held a 43.78% share and stood as the fastest-growing category in the End User segment of the Consumer Electronics Repair And Maintenance Market. As reported by Eurostat, only 15% of European Union individuals recycled old desktops and 11% recycled laptops in 2024, whereas 34% stored unused laptops at home . Dormant household electronics create vast trade-in and battery-revival pools, enabling retailers to monetize home protection subscriptions.
Commercial end users rely on contracted fleet maintenance to prevent costly employee downtime across offices, schools, and retail stores. Data from Eurostat shows 99% of European Union enterprises maintained internet connectivity, 52.74% bought cloud services, and 19.95% used artificial intelligence in 2025 . Continuous enterprise reliance on laptops, point-of-sale terminals, and edge-AI workstations requires multi-year lifecycle contracts, giving B2B depot operators stable recurring revenue.
Industrial facilities require specialized precision electronics maintenance for ruggedized computing terminals, sensors, and automated power controllers. UNIDO found that global manufacturing output rose 1.3% quarter-over-quarter in Q1 2025, led by 2.6% growth in computers and electronics and 2.5% in electrical equipment. Higher factory utilization accelerates thermal stress and vibration wear on control boards, allowing specialized industrial repair contractors to command premium service rates.
Key Market Segments
By Product
- Home Appliances
- Refrigerators
- Washing Machines
- Grinder (Mixer)
- Dishwasher
- Microwaves and Oven
- Others
- Entertainment Devices
- Televisions
- Audio Devices
- Others
- Personal Devices
- Mobiles and Tablets
- PCs
- Laptops/Notebooks
- Digital Cameras
- Others
By Service Providers
- Authorized Service Centers
- Independent Repair Shops
By End User
- Residential
- Commercial
- Industrial
Regional Analysis
Asia-Pacific Dominates the Consumer Electronics Repair And Maintenance Market with a Market Share of 33.23% in 2025, Valued at USD 7.07 Billion
Asia-Pacific captured 33.23% of global revenue at USD 7.07 Billion in 2025, anchored by massive smartphone and appliance populations in China, India, Japan, and South Korea. Based on ITU data, Asian countries generated 30 Billion kg of e-waste annually with an 11.8% formal recycling rate, while regional mobile ownership exceeded internet usage by 11 percentage points . Expanding formal right-to-repair portals across India and East Asia shift millions of out-of-warranty repairs toward organized service networks.
Middle East and Africa represents the fastest-growing regional market as urbanizing populations adopt smart appliances and mobile banking hardware. World Bank indicates that Middle East and North Africa economic growth reached 3.1% in 2025, with January baseline projections of 3.6% in 2026 and 3.9% in 2027 led by Gulf states . Rising household disposable income and extreme ambient heat strain air-conditioning and mobile batteries, creating high-margin demand for authorized regional service hubs.
Key Regions and Countries
North America
- US
- Canada
Europe
- Germany
- France
- The UK
- Spain
- Italy
- Rest of Europe
Asia Pacific
- China
- Japan
- South Korea
- India
- Australia
- Rest of APAC
Latin America
- Brazil
- Mexico
- Rest of Latin America
Middle East and Africa
- GCC
- South Africa
- Rest of MEA
Market Dynamics
Structural shifts in hardware modularity, right-to-repair legislation, and technician labor supply reshape service profitability worldwide. Figures from ILO show global e-waste management and electronics repair sustain 6.32 Million jobs worldwide, with 90% in direct employment and over 80% located in middle-income economies . However, skilled microsoldering shortages in Western markets and high OEM module prices force service operators to automate diagnostics and expand subscription protection plans.
Drivers
Binding right-to-repair laws across major economies have ended manufacturer parts monopolies and reshaped post-warranty service monetization. California enforced SB 244 in July 2024 requiring 3 to 7 years of parts access for devices above USD 50 under USD 5,000 daily penalties, while Oregon and Colorado banned parts pairing in 2025 and 2026. Parallel onboarding of 63 enterprises onto India’s Right to Repair Portal since August 2024 further standardized spare-part pricing disclosures.
Similarly, the European Union enforced Directive 2024/1799 across all 27 Member States in July 2026, mandating spare-part availability, 30 to 45 working-day turnarounds, and 12-month warranty extensions. Consequently, service shops shift from walk-in tickets toward contracted brand networks, cutting customer acquisition costs by 14% to 19%. Independent shop OEM parts procurement rises 22% while depot turnaround drops by 2.5 days, boosting technician throughput for multi-site investors.
| Driver | (~) % Impact on CAGR Forecast | Geographic Relevance | Impact Timeline |
|---|---|---|---|
| Statutory Right-to-Repair Mandates & Warranty Extensions | +1.9% | European Union, United States, India | Short term (≤ 2 years) |
| Elongating Flagship Hardware Replacement Cycles | +1.4% | Global | Short term (≤ 2 years) |
| Embedded Device Protection & Carrier Subscription Attach Rates | +1.1% | North America, Western Europe, Developed APAC | Medium term (2–4 years) |
| Certified Pre-Owned & Trade-In Refurbishment Grading Volume | +0.9% | North America, Europe, China, India | Medium term (2–4 years) |
| Proliferation of Fragile Foldable & Dual-Display Form Factors | +0.6% | South Korea, China, North America, Western Europe | Medium term (2–4 years) |
| Mandatory User-Replaceable Battery Ecodesign Architecture | +0.5% | European Union, Global Supply Chains | Long term (≥ 4 years) |
Restraints
High OEM modular assembly prices often exceed the resale value of out-of-warranty devices, causing consumers to abandon repairs for trade-ins. Bonding flexible OLED screens to frames and hinges pushes uninsured inner display replacements to USD 419 through USD 999 in the U.S. and 1,649,000 KRW in South Korea, or 45% to 50% of retail launch prices. Meanwhile, flagship resale values drop 60.7% and foldables plunge 71.1% within 18 months.
Once an uninsured repair quote passes 35% of current resale value, walk-in customer conversion falls below 24% at retail counters. Consequently, independent repair shops absorb 20 to 35 minutes of unpaid diagnostic bench labor on every declined ticket. Discounting labor to save price-sensitive jobs compresses shop gross margins by 420 to 650 basis points and delays capital spending on OLED laminators and laser separation rigs.
| Restraint | (~) % Impact on CAGR Forecast | Geographic Relevance | Impact Timeline |
|---|---|---|---|
| Uninsured Repair-to-Residual Value Parity Thresholds | -1.4% | Global | Short term (≤ 2 years) |
| Epoxy-Sealed Disposability in Budget & Hearable Tiers | -0.9% | Global | Short term (≤ 2 years) |
| Proprietary System-on-Chip & Serialization Lockouts in Unregulated Jurisdictions | -0.7% | Latin America, Southeast Asia, Middle East & Africa, Unregulated US States | Medium term (2–4 years) |
| Customs Seizures & Import Bans on Harvested Donor Assemblies | -0.5% | Latin America, South Asia, North America | Short term (≤ 2 years) |
| Lithium-Ion Thermal Runaway Air-Freight Restrictions | -0.3% | Global | Medium term (2–4 years) |
Challenges
Rapid circuit-board miniaturization featuring dual-stacked logic boards, 01005-imperial passive packages, and underfilled power ICs has created a severe shortage of Level 3 microsoldering specialists. Commercial depot operators across North America and Western Europe face an 18% to 24% unfilled vacancy rate for certified board-level technicians. This talent deficit stretches complex logic-board backlogs from 48 hours to 7 through 11 business days and lifts junior rework warranty returns to 8.5%.
Overcoming this operational bottleneck forces multi-regional repair networks to raise senior technician base wages by 12% to 16%. Service chains must also fund internal 6-month apprenticeship programs costing roughly USD 8,500 per trainee. Consequently, operators centralize complex motherboard recovery into automated hub-and-spoke mail-in depots equipped with USD 15,000 plus X-ray BGA inspection and infrared rework stations rather than diagnosing boards at retail storefronts.
| Challenge | (~) % CAGR Friction Drag | Geographic Relevance | Mitigation Horizon |
|---|---|---|---|
| Board-Level Microsoldering Technician Deficit | -1.1% | North America, Europe, Developed APAC | Medium term (2–4 years) |
| Cross-Border Component Tariff Volatility | -0.8% | United States, Europe, China | Short term (≤ 2 years) |
| Counterfeit Aftermarket Component Infiltration | -0.6% | Global | Medium term (2–4 years) |
| Ingress-Protection Resealing Calibration Complexity | -0.5% | Global | Medium term (2–4 years) |
| Multi-SKU Tail-Inventory Working Capital Drag | -0.4% | Global | Long term (≥ 4 years) |
Opportunities
Proactive telemetry-triggered maintenance subscriptions across smart-home ecosystems, domestic robots, spatial headsets, and edge-AI PCs unlock substantial new recurring revenue beyond reactive break-fix work. Continuous on-device diagnostics monitor battery impedance, thermal throttling, hinge cycles, and motor draw in real time. Early movers can dispatch preventive thermal-paste reapplication, sensor calibration, and battery swaps before secondary heat damage destroys expensive motherboards.
Service providers integrating OEM diagnostic APIs into unified household subscriptions priced at USD 14 to USD 22 monthly can lift gross margins by 900 to 1,300 basis points above walk-in baselines. Intercepting cascading component failures cuts per-ticket spare-part procurement costs by 28% to 34%. Pre-scheduled dynamic parts staging also raises technician bench utilization from 62% to over 84%, rewarding software-enabled service aggregators.
| Opportunity | (~) % Potential CAGR Upside | Geographic Relevance | Execution Window |
|---|---|---|---|
| AI-Telemetry Predictive Maintenance & Smart-Home Fleet Contracts | +1.5% | North America, Western Europe, East Asia | Medium term (2–4 years) |
| Roll-Up Consolidation of Fragmented Independent Repair Shops | +1.2% | United States, United Kingdom, Germany, India | Short term (≤ 2 years) |
| B2B Enterprise & K-12 Fleet Lifecycle Management | +1.0% | North America, Europe, Australia | Short term (≤ 2 years) |
| Authorized 3D-Printed Legacy Spare-Part Micro-Fulfillment | +0.7% | European Union, North America | Long term (≥ 4 years) |
| Mobile Van-Based On-Demand Micro-Depot Networks | +0.6% | North America, Middle East, Tier-1 Asian Metros | Medium term (2–4 years) |
Key Company Insights
Best Buy Co., Inc.
Best Buy Co., Inc. operates North America’s largest retail consumer electronics repair and installation network through its Geek Squad precinct and in-home field agents. According to Best Buy Co., Inc. Form 10-K, the company generated USD 41.691 Billion in fiscal 2026 enterprise revenue across 1,068 stores and 82,000 employees while Services comparable sales grew 1.0% . Embedding repair counters inside big-box stores lowers customer acquisition costs and drives high-margin membership renewals.
Best Buy actively expands its digital assortment to attach protection and repair plans onto third-party hardware purchases. As reported by Best Buy Corporate News, in August 2025 the company launched its Mirakl-powered U.S. digital marketplace with 500 initial third-party sellers scaling past 1,100 sellers, doubling product SKUs and integrating Geek Squad Protection . Capturing warranty attach rates on third-party electronics shields service margins from cyclical retail hardware slowdowns.
Redington Limited
Redington Limited anchors technology supply-chain distribution, spare-parts logistics, and authorized lifecycle repair services across India, South Asia, the Middle East, Turkey, and Africa. Data from Redington Limited Annual Report shows consolidated operational revenue rose 19.96% to INR 1,19,162.36 Crore and net profit climbed 16.85% to INR 1,565.46 Crore in FY 2025-26 across 160 warehouses . Dense regional warehousing allows Redington to stage smartphone and PC spare parts closer to authorized service centers.
Redington pairs its physical parts distribution footprint with enterprise software and telemetry partnerships across high-growth emerging markets. Redington Corporate Press Release found that in July 2026 the company signed a 5-year strategic distribution agreement with Resulticks targeting over USD 150 Million in AI customer engagement opportunities across India, the Middle East, and Asia . Integrating AI engagement tools helps channel partners automate warranty renewal outreach and boost after-sales service retention.
Key Players
- The Cableshoppe Inc.
- Redington Limited
- Electronix Services
- B2X Care Solutions GmbH
- Encompass Supply Chain Solutions, Inc.
- uBreakiFix by Asurion
- Asurion, LLC
- Best Buy Co., Inc.
- American Home Shield Corporation
- Servify Technologies Pvt. Ltd.
- Other Key Players
Recent Developments
2026
- November 2026: Assurant, Inc. completed the acquisition of Canadian commercial equipment service plan administrator Protection Point Service Plans Inc. to expand B2B repair coverage alongside its 1,150 global repair and partner locations Assurant Official Release
- November 2026: Fairphone B.V. launched a U.S. carrier partnership with Boost Mobile for the USD 649.99 Fairphone Gen 6 Plus featuring 12 user-replaceable modules and a 5-year hardware warranty Fairphone Announcement
- October 2026: Apple Inc. expanded its Self Service Repair Store across the U.S., Canada, and Europe with genuine OEM parts including USD 249 camera modules and USD 49 7-day tool kits for iPhone 18 Pro and M6/M5 Macs Apple Self Service Repair Announcement
- July 2026: uBreakiFix by Asurion completed a capacity expansion by opening franchise repair stores in Salt Lake City, St. George, and Salinas, advancing its 700 plus store and 600 plus mobile repair van network PR Newswire
- May 2026: Asurion, LLC completed a capacity expansion by opening its sixth Philippine technical support hub in Cebu City, creating 2,000 jobs and lifting local headcount past 7,000 staff serving 230 Million global customers Asurion Press Release
- May 2026: Currys plc formed a partnership as Microsoft’s first UK retail repair partner for Surface laptops through its 500,000 sq ft Newark lab staffed by 1,200 plus technicians across 300 UK stores Currys plc Official Press Release
- March 2026: Lenovo Group Limited and iFixit launched the ThinkPad T14 Gen 7 and T16 Gen 5 laptops earning a 10 out of 10 repairability score across a 20 plus device AI PC rollout iFixit Press Release
- February 2026: Back Market announced an operational milestone clearing USD 3.5 Billion in 2025 refurbished gross merchandise value up 32% across 18 plus countries and launched a ChromeOS Flex laptop-lifespan pilot Back Market Press Release
2025
- October 2025: Refurbed GmbH closed a EUR 50 Million equity funding round led by Alex Zubillaga and Orilla Asset Management, expanding into 12 new European markets and passing USD 3 Billion cumulative GMV Refurbed Official Press Release
- October 2025: Assurant, Inc. completed the acquisition of OptoFidelity’s automated mobile optical metrology and testing portfolio for its Device Care Centers within USD 15 Million of 2025 Connected Living investments Assurant Official Press Release
Geopolitical Impact Analysis
Cross-border tariff escalations and bilateral trade friction directly inflate landed costs for imported OLED display assemblies, lithium-ion cells, and logic-board microchips. Based on WTO data, world merchandise trade climbed 7% to USD 26.26 Trillion with 4.6% volume growth in 2025 and rose 15% in dollar value during H1 2026 alongside a 3.9% 2026 volume forecast . However, IMF indicates that world trade volume growth will decelerate from 5.0% in 2025 to 4.6% in 2026 amid tariff drag, while global GDP grows 3.1% . Higher import duties on Chinese and East Asian replacement PCBs and compressor motors force U.S. and European repair distributors to diversify supplier footprints and carry heavier buffer inventories.
Simultaneously, maritime chokepoint disruptions and Middle East hostilities lengthen ocean transit lead times for bulky refrigerator compressors, washing-machine drums, and television panels. Figures from UNCTAD show global seaborne trade grew 0.5% in 2025 with 1.4% containerized growth, and will average 2.0% annually through 2030 . According to World Shipping Council, 1,478 containers were lost at sea out of 280 Million transported in 2025, up from 576 lost in 2024 . As reported by World Bank, Middle East conflict energy spikes slow global 2026 GDP growth to 2.5% and slash non-Iran regional growth by 2.4 percentage points to 1.8% . Consequently, depot operators pre-stage fast-moving spare SKUs onshore and raise service-plan fees to protect margins against freight surcharges.
Report Scope
| Report Features | Description |
|---|---|
| Market Value (2025) | USD 21.3 Billion |
| Forecast Revenue (2035) | USD 37.2 Billion |
| CAGR (2026-2035) | 5.7% |
| Base Year for Estimation | 2025 |
| Historic Period | 2021-2025 |
| Forecast Period | 2026-2035 |
| Report Coverage | Revenue Forecast, Market Dynamics, Market Opportunity Analysis, Technology and Innovation Landscape, Competitive Landscape, Recent Developments |
| Segments Covered | By Product (Home Appliances [Refrigerators, Washing Machines, Grinder (Mixer), Dishwasher, Microwaves and Oven, Others], Entertainment Devices [Televisions, Audio Devices, Others], Personal Devices [Mobiles and Tablets, PCs, Laptops/Notebooks, Digital Cameras, Others]), By Service Providers (Authorized Service Centers, Independent Repair Shops), By End User (Residential, Commercial, Industrial) |
| Regional Analysis | North America (US and Canada), Europe (Germany, France, The UK, Spain, Italy, and Rest of Europe), Asia Pacific (China, Japan, South Korea, India, Australia, and Rest of APAC), Latin America (Brazil, Mexico, and Rest of Latin America), Middle East and Africa (GCC, South Africa, and Rest of MEA) |
| Competitive Landscape | The Cableshoppe Inc., Redington Limited, Electronix Services, B2X Care Solutions GmbH, Encompass Supply Chain Solutions, Inc., uBreakiFix by Asurion, Asurion, LLC, Best Buy Co., Inc., American Home Shield Corporation, Servify Technologies Pvt. Ltd., Other Key Players |
| Customization Scope | Customization for segments, region / country-level will be provided. Additional customization can be done based on requirements. |
| Purchase Options | We have three licenses to opt for: Single User License | Multi-User License (Up to 5 Users) | Corporate Use License (Unlimited User and Printable PDF) |