
Quick Navigation
Report Overview
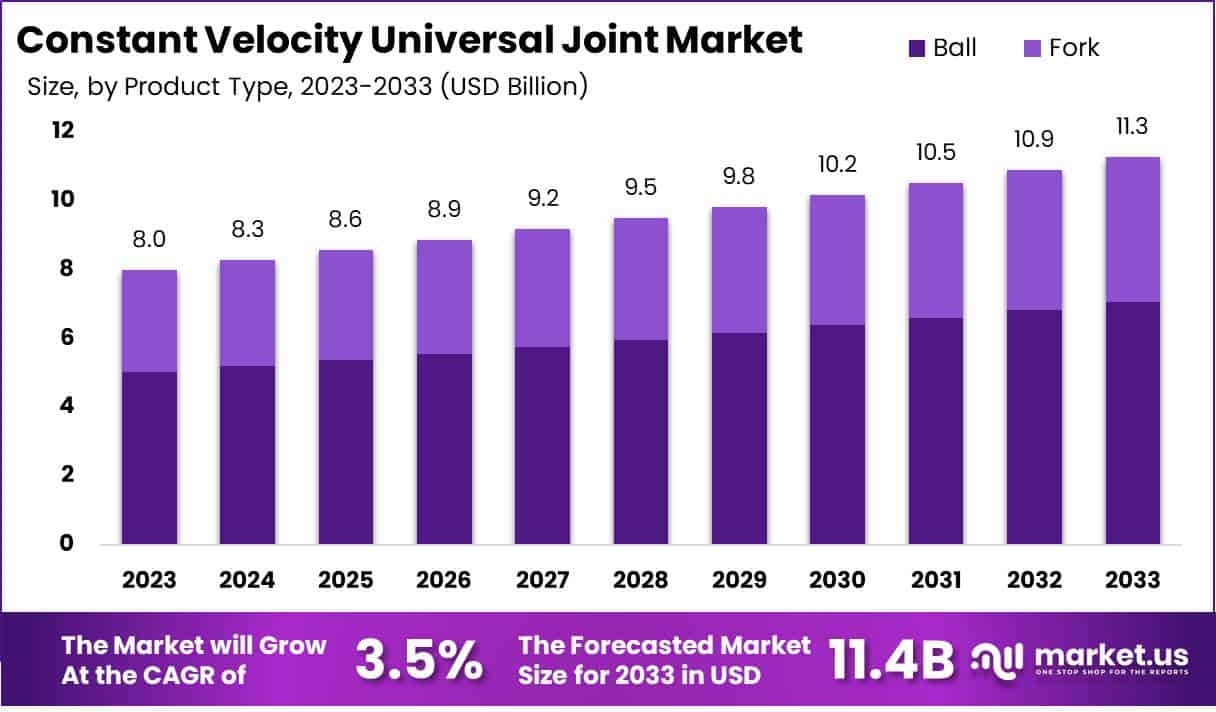
The Global Constant Velocity Universal Joint Market size is expected to be worth around USD 11.3 billion by 2033 from USD 8.0 billion in 2023, growing at a CAGR of 3.5% during the forecast period 2024 to 2033.
Increasing demand for reliable and efficient drivetrain components drives growth in the constant velocity (CV) universal joint market, essential for smooth power transmission in automotive and industrial applications. CV joints, critical in enabling flexible rotation across various angles, support high-performance demands in front-wheel and all-wheel drive systems, as well as heavy machinery and electric vehicles.
A significant trend involves integrating smart technology, as evidenced by Hyundai WIA Corporation’s early 2024 announcement of a CV joint equipped with embedded sensors.
These sensors enable real-time performance monitoring, supporting predictive maintenance by alerting drivers to potential issues before failure occurs, aligning with Hyundai WIA’s commitment to smart vehicle innovation. Such advancements address the increasing shift towards predictive maintenance and improved vehicle reliability.
Expanding electric vehicle (EV) adoption also creates opportunities for lightweight, durable CV joints capable of handling high torque loads specific to EV propulsion systems. As automotive manufacturers emphasize fuel efficiency and reduced emissions, the demand for high-quality, low-friction CV joints rises.
Research and development investments in materials, such as high-strength alloys and composites, further enhance the durability and lifespan of CV joints, supporting the broader goals of sustainability and cost efficiency across industries.
Key Takeaways
- In 2023, the market for constant velocity universal joint generated a revenue of USD 8.0 billion, with a CAGR of 3.5%, and is expected to reach USD 11.3 billion by the year 2033.
- The product type segment is divided into fork and ball, with ball taking the lead in 2023 with a market share of 62.7%.
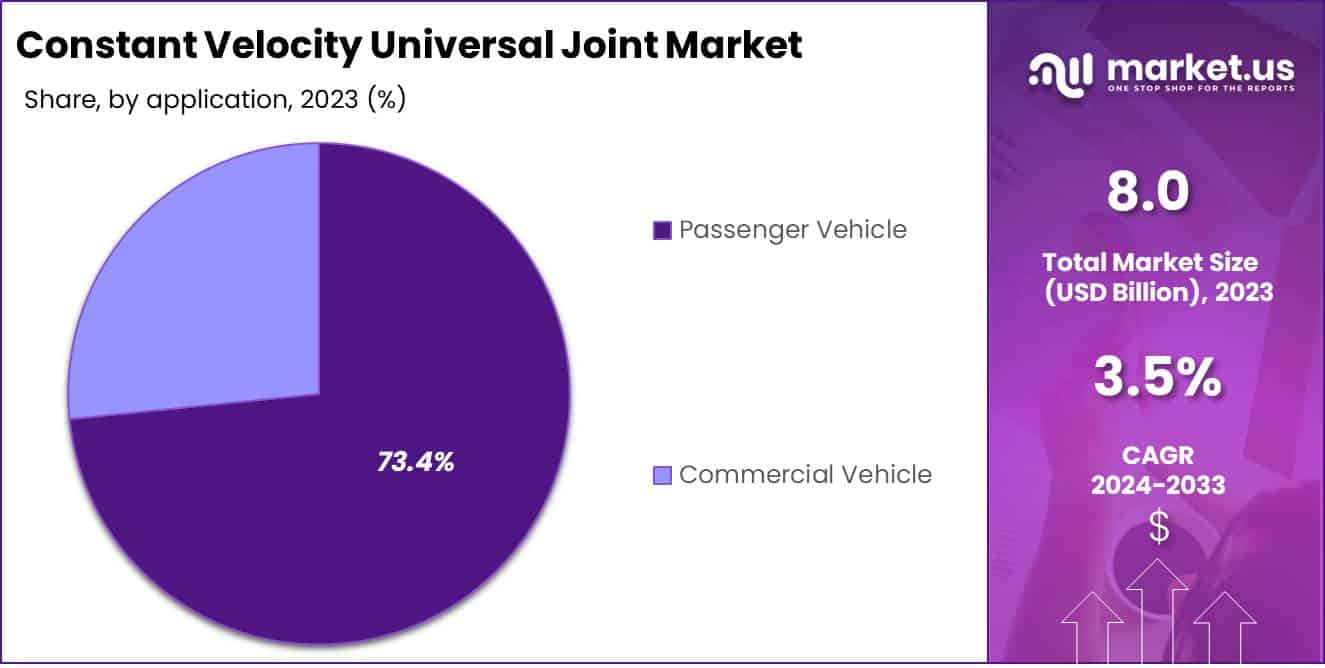
- Considering application, the market is divided into commercial vehicle and passenger vehicle. Among these, passenger vehicle held a significant share of 73.4%.
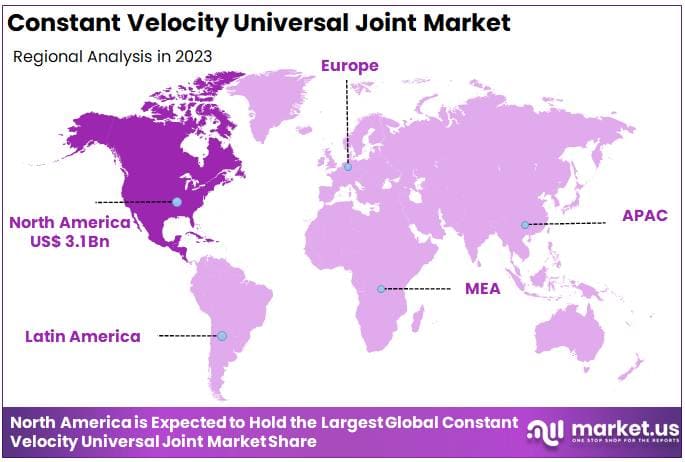
- North America led the market by securing a market share of 38.6% in 2023.
By Product Type Analysis
The ball segment led in 2023, claiming a market share of 62.7% owing to its efficiency in providing smooth torque transmission and reducing vibrations. As a key component in front-wheel drive vehicles, ball-type constant velocity joints offer greater flexibility and allow angular variations, which enhance vehicle performance and driving comfort.
Growing demand for fuel-efficient and smoother-driving vehicles drives manufacturers to integrate ball-type joints in modern vehicles.
Additionally, advancements in material technology improve the durability and load-bearing capacity of these joints, which strengthens their appeal in the automotive industry. Rising vehicle production and the increasing adoption of front-wheel drive systems further support this segment’s growth.
Manufacturers benefit from the cost-effectiveness of ball-type joints, making them a preferred choice for mass production. These factors position the ball segment for significant expansion, as automotive trends continue to emphasize performance and efficiency.
By Application Analysis
The passenger vehicle held a significant share of 73.4% due to increasing global vehicle production and rising consumer demand for smooth, efficient driving experiences. As consumers prioritize comfort and vehicle performance, the demand for constant velocity universal joints in passenger cars grows steadily.
Technological advancements in vehicle components, including improved constant velocity joints, align with automotive trends focused on fuel efficiency and reduced emissions, further supporting this segment. Urbanization and the rise in middle-class incomes drive passenger vehicle sales, which strengthens demand for reliable joint systems.
Additionally, electric vehicle adoption requires high-performance joints that align with advanced transmission systems, likely boosting growth in this market. Government incentives for low-emission vehicles, combined with increased vehicle ownership rates, create favorable conditions for the expansion of constant velocity universal joints in passenger vehicles.
Key Market Segments
By Product Type
- Fork
- Ball
By Application
- Commercial Vehicle
- Passenger Vehicle
Drivers
Rising Innovation is Driving the Market
Rising innovation in the automotive sector drives the constant velocity (CV) universal joint market, addressing the need for durable, high-performance components in modern vehicles. In 2021, SKF Group introduced a high-performance CV joint specifically designed to meet the rigorous demands of premium and high-performance cars.
This advanced CV joint features optimized friction properties and enhanced strength, ensuring reliable power transmission even under extreme conditions. Such developments reflect the automotive industry’s shift towards components that improve vehicle performance, fuel efficiency, and overall reliability.
As manufacturers focus on developing CV joints with greater durability and performance, the market is expected to experience substantial growth. These advancements align with the increasing demand for high-quality, efficient powertrain components in luxury and performance vehicles, positioning the CV joint market for continued expansion in the coming years.
Restraints
Hub Motors in EVs Reducing Demand for CV Joints
A key restraint in the constant velocity (CV) universal joint market is the rising adoption of hub motors in electric vehicles (EVs), which bypass the need for traditional drivetrain components, including CV joints. Hub motors power wheels directly, eliminating complex drivetrains and potentially reducing demand for CV joints in EV applications.
As of 2022, nearly 12% of new EV models utilized hub motor technology, up from 3% three years earlier. This trend reflects a notable shift in EV design, particularly as automakers favor hub motors for their compact design, mechanical simplicity, and precision.
If the current adoption rate for hub motors continues, demand for CV joints in EVs may decrease by up to 10% over the coming decade. Despite this restraint, traditional combustion vehicles and certain hybrid models still rely on CV joints, sustaining some demand within the segment.
Opportunities
Emission Regulations Drive Demand for Efficient CV Joints
The increasing focus on fuel efficiency and reduced emissions presents a substantial opportunity for the CV joint market, particularly in regions with stringent environmental regulations. In Asia-Pacific, for example, the implementation of strict emissions standards such as India’s BS-VI (based on Euro 6) drives demand for advanced drivetrain components like CV joints.
In 2023, the Asia-Pacific region accounted for around 75% of the CV joint market growth, primarily due to surging automotive sales across China and India.
Additionally, as hybrid and more fuel-efficient internal combustion vehicles grow in popularity, automakers increasingly rely on high-performance CV joints to enhance drivetrain efficiency. Given that passenger vehicles in emerging markets contribute significantly to CO2 emissions, innovations in CV joint technology will continue to align with global sustainability goals, expanding market potential.
Impact of Macroeconomic / Geopolitical Factors
Macroeconomic and geopolitical factors play a pivotal role in shaping the constant velocity universal joint market, influencing demand, supply chains, and production costs. Economic growth positively impacts automotive sales, directly benefiting the CV joint sector as demand for drivetrain components rises with vehicle production.
However, economic downturns limit disposable incomes, reducing vehicle sales and, subsequently, demand for CV joints. Geopolitical tensions, such as trade disputes and supply chain disruptions, create cost pressures and delay component availability, especially in regions heavily reliant on imported materials.
Inflation also affects raw material prices, raising production costs for CV joint manufacturers. On the positive side, countries prioritizing automotive innovation and sustainability initiatives provide a supportive environment for market expansion, particularly as the industry leans toward fuel-efficient and hybrid vehicles.
This balanced interplay of economic factors ultimately positions the market for steady growth, aligning with ongoing shifts toward advanced drivetrain technology and emission reduction efforts.
Latest Trends
Increased Integration of AWD Systems in Vehicles
A recent trend in the CV joint market is the growing integration of all-wheel-drive (AWD) systems, which rely on multiple CV joints for improved stability and traction. AWD vehicle demand has steadily increased, especially in regions with adverse weather conditions, as AWD systems enhance safety and vehicle control by distributing power to all wheels.
This trend impacts CV joint manufacturers, who are expected to benefit from rising demand for AWD components in both personal and commercial vehicles. With the global passenger vehicle segment experiencing an approximate 10.5% annual growth rate, and AWD becoming a key preference in passenger cars, demand for durable, high-quality CV joints is likely to grow significantly.
Consequently, this shift toward AWD systems in the automotive market is projected to enhance CV joint sales over the next several years.
Regional Analysis
North America is leading the Constant Velocity Universal Joint Market
North America dominated the market with the highest revenue share of 38.6% owing to increased automotive production and heightened demand for all-wheel-drive (AWD) and four-wheel-drive (4WD) vehicles.
Rising consumer preferences for SUVs and light trucks, which accounted for approximately 78% of U.S. auto sales in 2022 and continued to increase in 2023, have driven demand for CV universal joints as these vehicles require high-performance drivetrain components.
Furthermore, stringent regulations aimed at improving fuel efficiency and reducing emissions have prompted manufacturers to use lightweight, durable materials in CV joint production, thus enhancing vehicle performance and fuel economy.
These trends, coupled with a continued focus on improving vehicle stability and ride quality, have fueled steady market expansion for CV universal joints in North America.
The Asia Pacific region is expected to experience the highest CAGR during the forecast period
Asia Pacific is expected to grow with the fastest CAGR owing to a robust automotive industry and increasing consumer demand for efficient, high-performance vehicles. In China, the sales of new energy vehicles (NEVs), including EVs, increased by an impressive 93.4% year-over-year in 2022, with nearly 6 million units sold in the first three quarters of 2023, signaling a major shift towards EV adoption, which relies heavily on CV joint technology for optimal torque distribution.
Additionally, the region’s government initiatives supporting EV production and adoption are anticipated to further boost demand. Collaborations between international and local automotive component suppliers are likely to improve access to high-quality materials, enhancing CV joint efficiency and durability.
Consequently, the Asia Pacific region is expected to see robust growth in the constant velocity universal joint market as the demand for advanced vehicle technology rises.
Key Regions and Countries
North America
- US
- Canada
Europe
- Germany
- France
- The UK
- Spain
- Italy
- Russia
- Netherland
- Rest of Europe
Asia Pacific
- China
- Japan
- South Korea
- India
- Australia
- New Zealand
- Singapore
- Thailand
- Vietnam
- Rest of APAC
Latin America
- Brazil
- Mexico
- Rest of Latin America
Middle East & Africa
- South Africa
- Saudi Arabia
- UAE
- Rest of MEA
The major players in the constant velocity universal joint market are actively engaged in the development and introduction of innovative products, as well as implementing strategic initiatives aimed at enhancing their competitive positioning.
Key players in the constant velocity universal joint market implement targeted strategies to strengthen their growth and market position. They invest in research and development to create joints with enhanced durability and efficiency, meeting the evolving needs of the automotive sector. Strategic partnerships with vehicle manufacturers enable tailored solutions that align with specific model requirements and enhance integration.
Expanding manufacturing capabilities in key regions allows companies to reduce costs and improve delivery times. Additionally, they emphasize quality control and certification standards, which bolster customer trust and solidify long-term relationships with clients.
Top Key Players in the Market
- SKF AB
- NTN Corporation
- Nexteer Automotive Group Limited
- Meritor, Inc.
- JTEKT Corporation
- HYUNDAI WIA Corporation
- GKN Limited
- Dana Incorporated
- American Axle & Manufacturing, Inc.
Recent Developments
- In 2023, GKN Automotive expanded its product portfolio by introducing next-generation CV joints specifically engineered for electric vehicles (EVs). These CV joints are designed to manage the higher torque and rotational speeds typical of EVs, providing enhanced durability and efficiency. This advancement is relevant to the growth of the constant velocity universal joint market as it aligns with the rising demand for EV-compatible driveline components, positioning GKN Automotive as a leader in vehicle electrification and supporting market expansion.
- In 2022, NTN Corporation launched an advanced CV joint that utilizes lightweight materials to reduce vehicle weight and improve fuel efficiency. This new design also incorporates enhanced sealing technology to prevent contamination and increase service life, targeting the growing market for hybrid and fuel-efficient vehicles. This product development is significant for the constant velocity universal joint market, as it responds to increasing demand for energy-efficient automotive components, promoting market growth through innovation in hybrid and eco-friendly vehicles.
Report Scope
| Report Features | Description |
|---|---|
| Market Value (2023) | USD 8.0 billion |
| Forecast Revenue (2033) | USD 11.3 billion |
| CAGR (2024-2033) | 3.5% |
| Base Year for Estimation | 2023 |
| Historic Period | 2019-2022 |
| Forecast Period | 2024-2033 |
| Report Coverage | Revenue Forecast, Market Dynamics, COVID-19 Impact, Competitive Landscape, Recent Developments |
| Segments Covered | By Product Type (Fork and Ball), By Application (Commercial Vehicle and Passenger Vehicle) |
| Regional Analysis | North America – US, Canada; Europe – Germany, France, The UK, Spain, Italy, Russia, Netherlands, Rest of Europe; Asia Pacific – China, Japan, South Korea, India, New Zealand, Singapore, Thailand, Vietnam, Rest of APAC; Latin America – Brazil, Mexico, Rest of Latin America; Middle East & Africa – South Africa, Saudi Arabia, UAE, Rest of MEA |
| Competitive Landscape | SKF AB, NTN Corporation, Nexteer Automotive Group Limited, Meritor, Inc., JTEKT Corporation, HYUNDAI WIA Corporation, GKN Limited, Dana Incorporated, and American Axle & Manufacturing, Inc. |
| Customization Scope | Customisation for segments at the regional/country level will be provided. Moreover, additional customisation can be done based on the requirements. |
| Purchase Options | We have three licenses to opt for: Single User License, Multi-User License (Up to 5 Users), Corporate Use License (Unlimited User and Printable PDF) |


