


Report Overview
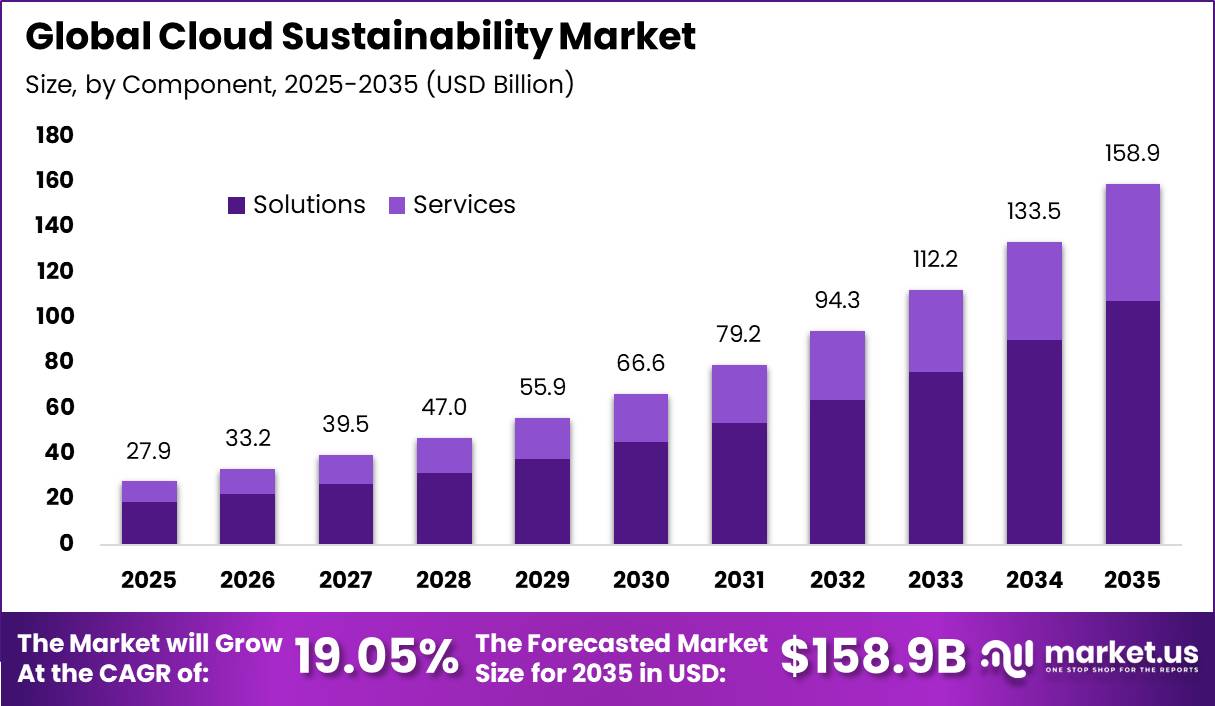
In 2025, the Global Cloud Sustainability Market was valued at USD 27.9 billion. The market is projected to grow at a CAGR of 19.05% during 2026–2035, reaching approximately USD 158.9 billion by 2035. North America dominated the global market in 2025, accounting for more than 38.1% of the total market share and generating approximately USD 10.6 billion in revenue.
Market growth is supported by rising electricity use across cloud computing, AI, storage, and digital services. Global data centres consumed around 415 TWh of electricity in 2024, representing 1.5% of global electricity demand. Consumption could increase to about 945 TWh by 2030 and exceed 1,300 TWh by 2035, adding nearly 885 TWh compared with 2024.
Renewable electricity supplied to data centres is expected to grow by an average of 22% annually between 2024 and 2030, meeting nearly half of new demand. This trend is increasing the need for energy monitoring, carbon accounting, cooling optimisation, server efficiency, workload management, and renewable-energy matching solutions.
U.S. data-centre electricity consumption increased from 58 TWh in 2014 to 176 TWh in 2023, a rise of 118 TWh over nine years, and represented 4.4% of national electricity use. Consumption could reach 325–580 TWh by 2028, equal to 6.7%–12.0% of U.S. electricity use. Another estimate placed consumption at 192 TWh in 2024, potentially reaching 9.5%–15.3% by 2030.
Key Takeaway
- The Cloud Sustainability Market was valued at USD 27.9 billion in 2025 and is projected to reach USD 158.9 billion by 2035, growing at a CAGR of 19.05%.
- The Solutions segment dominated the Component category in 2025 with a 67.7% share.
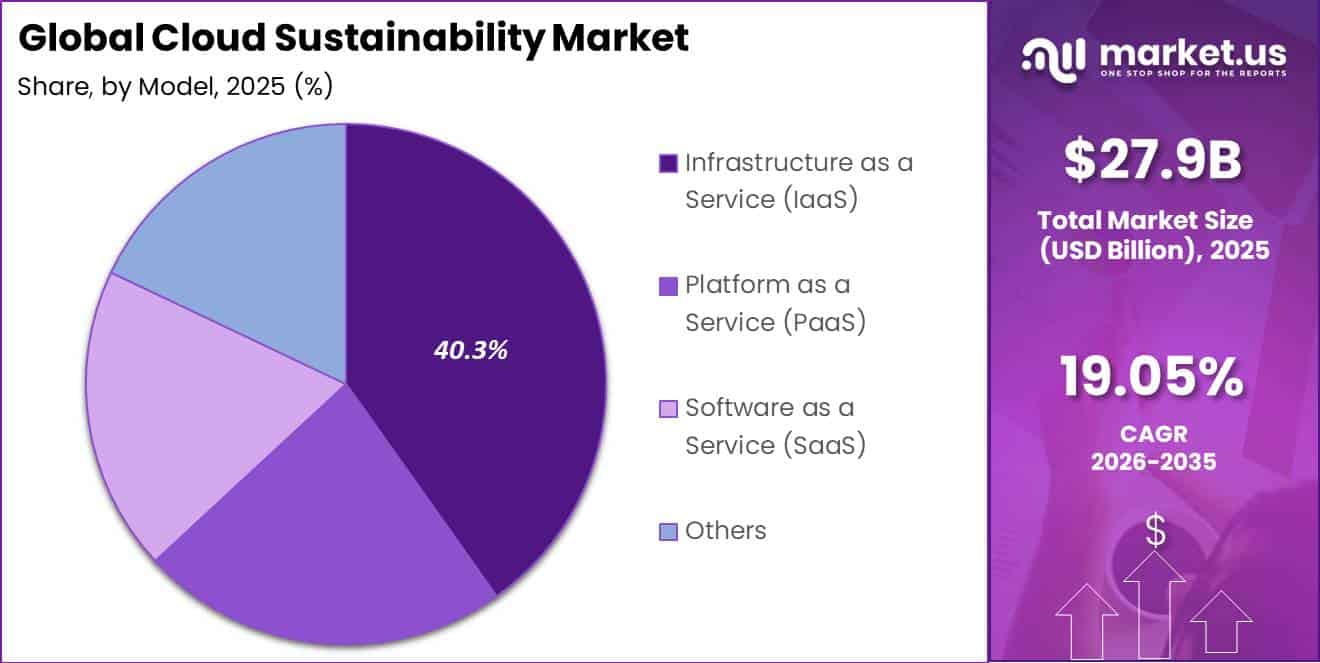
- Infrastructure as a Service (IaaS) led the Model category in 2025 with a 40.3% share.
- The IT and Telecom segment led the End-Use category in 2025 with a 35.1% share.
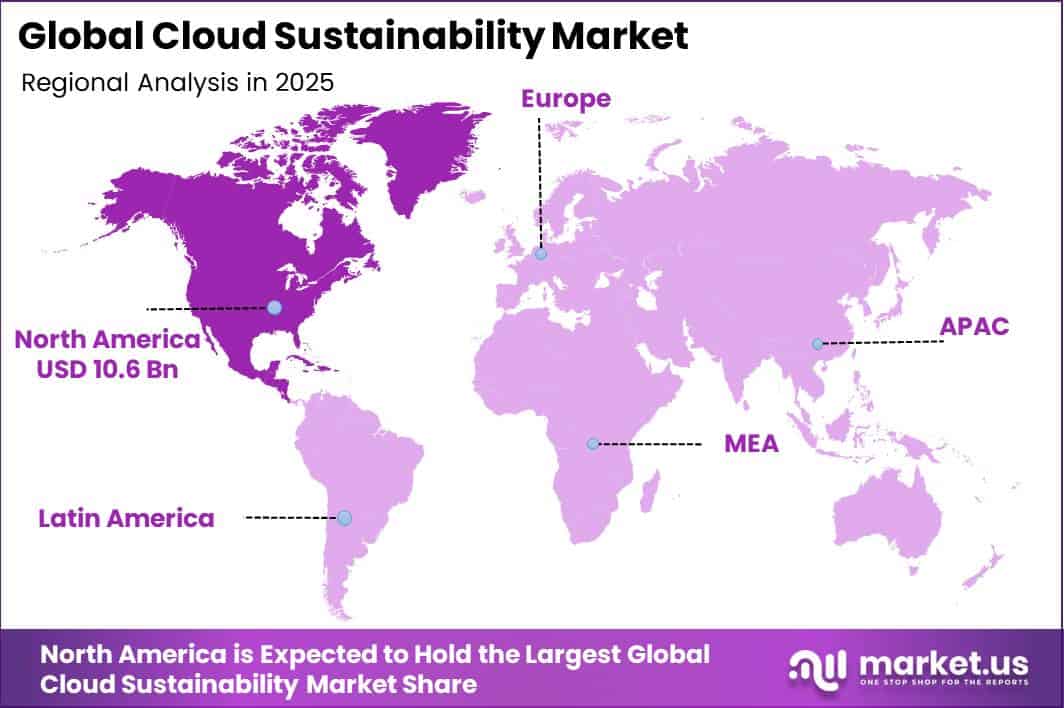
- North America led the market in 2025 with a 38.1% share and approximately USD 10.6 billion in revenue.
By Component
In 2025, the Solutions segment held a dominant position in the Cloud Sustainability Market, accounting for a 67.7% share. The segment benefits from rising demand for practical software tools that help companies measure, manage, reduce, and report the environmental impact of cloud operations.
In the European Union, data centres with installed IT power of at least 500 kW are required to report annual sustainability indicators from September 2025, including energy use, water consumption, renewable-energy share, waste-heat information, and efficiency measures.
In addition, the U.S. Department of Energy reports that server utilisation in enterprise data centres commonly ranges between 20% and 40%. Increasing processor utilisation from low levels of 20%–30% can improve server efficiency by around 50%.
By Model
In 2025, Infrastructure as a Service (IaaS) held a dominant position in the Cloud Sustainability Market, accounting for a 40.3% share. IaaS leads because customers directly use and manage energy-intensive cloud resources such as virtual servers, storage, networks, and computing capacity.
Eurostat reported that 45.2% of EU enterprises purchased cloud services in 2023, while 74.2% of cloud-buying companies used IaaS-related capabilities, including hosted databases, file storage, and computing power for their own applications. This gives organisations greater scope to reduce unused capacity, choose efficient virtual-machine sizes, automate server shutdowns, and move workloads to regions with lower carbon intensity.
Public-sector cloud adoption also supports the segment. The World Bank reported that government cloud services were operating in 60 countries, while another 46 countries had such services under development or approved. These platforms often combine IaaS, PaaS, and SaaS across multiple government agencies.
By End-Use
In 2025, the IT and telecom segment held a dominant position in the Cloud Sustainability Market, accounting for a 35.1% share. The segment leads because telecom operators and IT companies manage large networks, cloud platforms, data centres, and digital services that support growing internet traffic.
According to the International Telecommunication Union, around 5.5 billion people, equal to 68% of the global population, were online in 2024, increasing by 227 million users within one year. Global mobile-broadband subscriptions also reached 95 per 100 people. Rising digital activity increases demand for cloud storage, mobile data, video, software, and AI-based services, pushing companies to expand computing and network capacity.
The ICT sector consumed about 1,183 TWh of electricity and generated nearly 567 million tonnes of CO₂-equivalent emissions in 2022. Telecommunications contributed around 23% of ICT-sector emissions, while colocation, cloud, and content data centres accounted for 13%.
Key Market Segments
By Component
- Solutions
- Services
By Model
- Infrastructure as a Service (IaaS)
- Platform as a Service (PaaS)
- Software as a Service (SaaS)
- Others
By End-Use
- IT and Telecom
- BFSI
- Healthcare
- Retail and E-commerce
- Manufacturing
- Others
Geopolitical Impact Analysis
Geopolitical tensions are increasing the cost and supply risk of infrastructure used for cloud sustainability services, including servers, GPUs, network equipment, power systems, cooling units, transformers, steel structures, copper cabling, and battery backup systems. In 2025, U.S. trade measures introduced a 10% baseline tariff on many imported goods, increasing procurement pressure across data-centre supply chains.
Higher tariff rates were also applied to selected suppliers, including 34% on China, 32% on Taiwan, and 25% on South Korea. U.S. Section 232 tariffs on steel and aluminium also increased from 25% to 50% in May 2025 for most suppliers. These materials are widely used in data-centre buildings, racks, cooling systems, power distribution equipment, and electronic components.
Shipping disruption is creating additional delivery risks. UNCTAD estimates that rerouting Asia-Europe vessels around the Cape of Good Hope adds around 12 sailing days, increases transit time by about 30%, and reduces effective global container-shipping capacity by nearly 9%. These delays can affect the supply of racks, UPS systems, switchgear, fibre equipment, servers, and renewable-energy hardware.
Energy-price volatility is also influencing data-centre operating costs. The World Bank projected U.S. natural-gas prices to rise by 51% in 2025, while the European benchmark was expected to increase by 6%. Together, higher equipment, shipping, and energy costs strengthen demand for cloud sustainability tools that improve server utilisation, reduce cooling loads, monitor energy use, manage carbon emissions, and support renewable-energy matching.
Regional Analysis
In 2025, North America held a dominant position in the Cloud Sustainability Market, accounting for 38.1% of global revenue and generating approximately USD 10.6 billion. The region’s leadership is supported by a large base of hyperscale data centres, advanced AI infrastructure, strong enterprise cloud adoption, and growing demand for measurable carbon reduction.
The U.S. Department of Energy reported that U.S. data centres consumed around 176 TWh of electricity in 2023, compared with 58 TWh in 2014. Rising electricity use is encouraging cloud operators to adopt sustainability platforms for energy monitoring, carbon accounting, workload optimisation, renewable-energy matching, cooling management, and environmental reporting.
Asia Pacific is emerging as the fastest-growing regional market, supported by rapid cloud migration, digitalisation, mobile connectivity, and data-centre expansion across China, India, Japan, South Korea, Southeast Asia, and Australia. The International Telecommunication Union reported that around 5.5 billion people were using the internet globally in 2024, with Asia Pacific representing a major share of connected users.
Key Regions and Countries
North America
- US
- Canada
Europe
- Germany
- France
- The UK
- Spain
- Italy
- Rest of Europe
Asia Pacific
- China
- Japan
- South Korea
- India
- Australia
- Rest of APAC
Latin America
- Brazil
- Mexico
- Rest of Latin America
Middle East & Africa
- GCC
- South Africa
- Rest of MEA
Market Dynamics
Drivers
| Driver | (~) % CAGR | Geographic Relevance | Impact Timeline |
|---|---|---|---|
| AI-led cloud power optimisation | +3.2% | Global | Short term (2 years or less) |
| Mandatory sustainability reporting | +2.4% | Europe, North America | Short term (2 years or less) |
| Enterprise cloud migration | +1.8% | Global | Medium term (2 to 4 years) |
| Renewable energy matching | +1.5% | North America, Europe | Medium term (2 to 4 years) |
| FinOps carbon integration | +1.1% | Global | Short term (2 years or less) |
AI-led cloud power optimisation
AI expansion is making electricity efficiency a direct cloud purchasing issue. According to the International Energy Agency, global data-centre electricity consumption reached about 415 TWh in 2024 and is expected to rise to roughly 945 TWh by 2030; this adds about 530 TWh of annual demand within six years. The U.S. Department of Energy estimates that U.S. data centres consumed 176 TWh in 2023, compared with 58 TWh in 2014.
Meanwhile, the European Commission requires sustainability reporting from data centres with installed IT capacity above 500 kW. These pressures shift cloud management from basic cost control toward continuous energy measurement, carbon-aware workload placement, idle-resource removal, and cooling optimisation, supporting an estimated +3.2% incremental contribution to the stated 19.05% baseline CAGR.
Restraints
| Restraint | (~) % CAGR | Geographic Relevance | Impact Timeline |
|---|---|---|---|
| Power-grid connection constraints | -2.8% | North America, Europe | Medium term (2 to 4 years) |
| High infrastructure capital costs | -1.9% | Global | Short term (2 years or less) |
| Data-sovereignty procurement limits | -1.4% | Europe, Asia Pacific | Medium term (2 to 4 years) |
| Enterprise budget pressure | -1.2% | Global | Short term (2 years or less) |
| Long clean-power contracting cycles | -1.0% | North America, Europe | Medium term (2 to 4 years) |
Power-grid connection constraints
Grid connection bottlenecks restrain sustainability-led cloud expansion because software value depends on accessible low-carbon electricity and deployable physical capacity. The International Energy Agency projects global electricity demand from data centres to exceed 1,000 TWh by 2030 in its higher-growth outlook, while the U.S. Department of Energy estimates data centres could account for 6.7% to 12.0% of U.S. electricity consumption by 2028.
The European Commission identifies grid capacity and energy efficiency as central constraints in the expansion of data-centre infrastructure, while the World Bank reported that energy prices were forecast to decline by 17% in 2025 but remained exposed to geopolitical shocks.
Delayed interconnection queues postpone new cloud regions, limit renewable-power matching, and defer purchases of carbon-management software, creating an estimated -2.8% drag on the market’s baseline growth trajectory.
Challenges
| Challenge | (~) % CAGR | Geographic Relevance | Mitigation Horizon |
|---|---|---|---|
| Carbon data interoperability | -2.1% | Global | Medium term (2 to 4 years) |
| Legacy workload migration | -1.7% | Global | Medium term (2 to 4 years) |
| AI cooling intensity | -1.5% | North America, Asia Pacific | Long term (4 years or more) |
| Green skills shortage | -1.2% | Global | Medium term (2 to 4 years) |
| Multi-cloud governance complexity | -1.0% | Global | Short term (2 years or less) |
Carbon data interoperability
Carbon-data interoperability remains a key challenge because enterprises must combine cloud usage, facility energy, grid emissions, supplier data, and financial allocation into one auditable system. The ICT sector consumed about 1,183 TWh of electricity and emitted around 567 million tonnes of CO₂-equivalent in 2022.
Reporting requirements also differ across regions and facilities. The European Commission requires data centres above 500 kW to report multiple performance indicators, while different calculation methods and update cycles reduce comparability. Until data standards improve, this burden could create an estimated -2.1% friction drag on achievable CAGR.
Opportunities
| Opportunity | (~) % CAGR | Geographic Relevance | Execution Window |
|---|---|---|---|
| Grid-responsive cloud services | +2.9% | North America, Europe | Medium term (2 to 4 years) |
| Carbon-aware AI scheduling | +2.2% | Global | Medium term (2 to 4 years) |
| SME sustainability software | +1.7% | Asia Pacific, Europe | Long term (4 years or more) |
| Waste-heat monetisation platforms | +1.3% | Europe, North America | Long term (4 years or more) |
| Embedded green-finance reporting | +1.1% | Global | Medium term (2 to 4 years) |
Grid-responsive cloud services
Grid-responsive cloud services remain a strong opportunity as most cloud contracts still price computing by capacity and usage rather than electricity timing or carbon intensity. Data-centre electricity demand is expected to rise from about 415 TWh in 2024 to around 945 TWh by 2030, increasing the value of shifting flexible workloads away from peak-demand periods.
Google reported 1 GW of contracted data-centre demand-response capacity in 2026, while U.S. data centres accounted for 4.4% of national electricity use in 2023. Providers that share peak-power savings with customers could improve contribution margins by an estimated 5%–10% per flexible workload and add up to +2.9% potential CAGR upside.
Key Players Analysis
Tier-1 players, including AWS, Microsoft Azure, Google Cloud, and Oracle Cloud Infrastructure, are estimated to account for around 60%–70% of cloud sustainability spending. Amazon reported USD 107.6 billion in AWS net sales in 2024, while AWS infrastructure can be up to 4.1 times more energy efficient than similar on-premises systems and may reduce customer carbon footprints by up to 99%.
Microsoft committed USD 80 billion for fiscal 2025 AI and cloud infrastructure and aims for 100% zero-carbon electricity matching on a 24/7 basis by 2030. Alphabet generated USD 43.2 billion in Google Cloud revenue in 2024 and also targets 24/7 carbon-free energy by 2030. Oracle reported USD 24.5 billion in FY2025 cloud revenue, including USD 3.0 billion in quarterly IaaS revenue, up 52%, alongside USD 21.2 billion in capital spending and USD 9.9 billion in R&D.
Tier-2 players, including IBM, SAP, Salesforce, Dell Technologies, and Equinix, are estimated to hold a combined 20%–30% share of addressable demand. IBM generated USD 27.1 billion in software revenue in 2024 and invested USD 7.5 billion in R&D, up 10.4%. SAP recorded EUR 17.1 billion in cloud revenue.
Salesforce generated USD 37.9 billion in FY2025 revenue, including USD 35.7 billion from subscriptions, while investing USD 5.49 billion, or 15%, in R&D. Dell generated USD 43.6 billion, including USD 27.1 billion from servers and networking, while Equinix planned USD 2.7–3.03 billion in capital expenditure.
Top Key Players in the Market
- Amazon Web Services, Inc.
- Microsoft Corporation
- Google LLC
- IBM Corporation
- Oracle Corporation
- SAP SE
- Salesforce, Inc.
- Dell Technologies Inc.
- Equinix, Inc.
Recent Developments
- In February 2026, Microsoft announced that it had achieved its goal of purchasing enough renewable electricity to match 100% of the electricity used across its global data centres, buildings, and campuses.
- The company had contracted around 40 GW of renewable-energy capacity, with approximately 19 GW already operating. Its agreement with Brookfield covers more than 10.5 GW of renewable-power capacity, supporting cleaner electricity for Microsoft’s expanding cloud and data-centre operations.
- In June 2026, Google reported that it had signed agreements for more than 12 GW of net-new clean energy during 2025. From 2010 to 2025, the company signed more than 240 agreements covering nearly 35 GW of net-new clean energy. Google also reported a 37% annual rise in electricity demand while reducing operational emissions by 2% year over year.
Report Scope
| Report Features | Description |
|---|---|
| Market Value (2025) | USD 27.9 Billion |
| Forecast Revenue (2035) | USD 158.9 Billion |
| CAGR (2026-2035) | 19.05% |
| Base Year for Estimation | 2025 |
| Historic Period | 2020-2024 |
| Forecast Period | 2026-2035 |
| Report Coverage | Revenue Forecast, Market Dynamics, Competitive Landscape, Recent Developments |
| Segments Covered | By Component (Solutions, Services); By Model (Infrastructure as a Service (IaaS), Platform as a Service (PaaS), Software as a Service (SaaS), Others); By End-Use (IT and Telecom, BFSI, Healthcare, Retail and E-commerce, Manufacturing, Others) |
| Regional Analysis | North America – US, Canada; Europe – Germany, France, The UK, Spain, Italy, Rest of Europe; Asia Pacific – China, Japan, South Korea, India, Australia, Singapore, Rest of APAC; Latin America – Brazil, Mexico, Rest of Latin America; Middle East & Africa – GCC, South Africa, Rest of MEA |
| Competitive Landscape | Amazon Web Services, Inc., Microsoft Corporation, Google LLC, IBM Corporation, Oracle Corporation, SAP SE, Salesforce, Inc., Dell Technologies Inc., Equinix, Inc. |
| Customization Scope | Customization for segments, region/country-level will be provided. Moreover, additional customization can be done based on the requirements. |
| Purchase Options | We have three licenses to opt for: Single User License, Multi-User License (Up to 5 Users), Corporate Use License (Unlimited Users and Printable PDF) |





























