


Cargo E-Bike Market Size
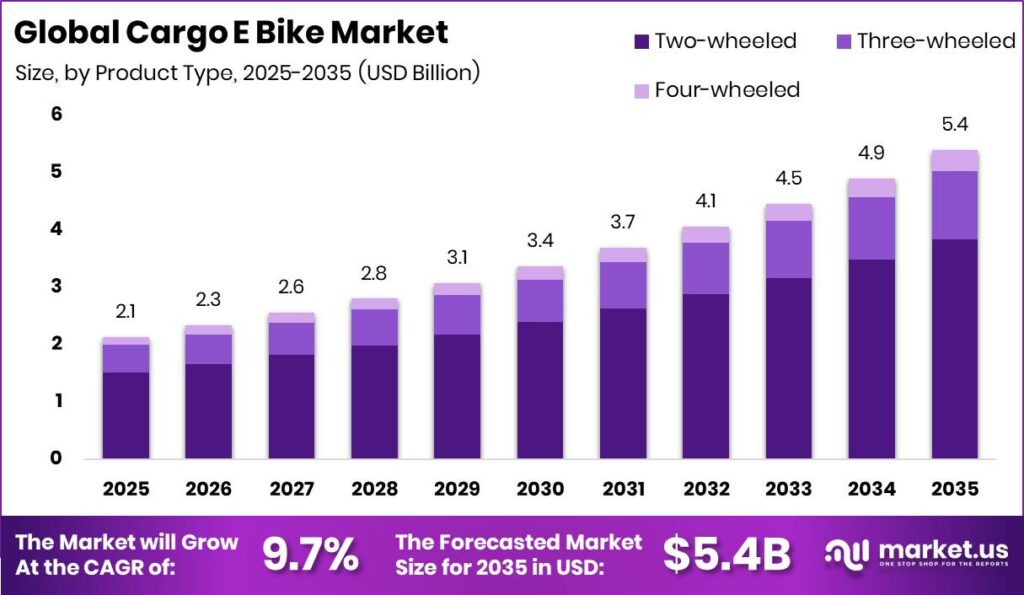
The global cargo e-bike market was valued at USD 2.1 billion in 2025 and is projected to reach USD 5.4 billion by 2035, growing at a CAGR of 9.7% during the forecast period 2026 to 2035. In 2025, Europe alone accounted for USD 1.09 billion, representing 51.0% of total global revenue. Two-wheeled formats generated the largest product share at 71.04%, while lithium-ion battery platforms held 64.80% of battery segment value. Logistics and delivery companies commanded 35% of end-user demand, confirming commercial fleet adoption as the primary revenue engine.
The market is expanding because urban van delivery is becoming structurally less efficient. A Brussels city logistics evaluation recorded cargo bikes completing 10.1 deliveries per hour against 4.9 for vans, with journey times of 48 minutes versus 99 minutes on comparable routes. These economics are converting pilot programs into permanent fleet infrastructure across Europe and North America.
Key Takeaways
- Global Cargo E Bike Market reached USD 2.1 Billion in 2025 and will hit USD 5.4 Billion by 2035 at a 9.7% CAGR.
- Two-wheeled cargo bikes led the By Product Type segment with a 71.04% share.
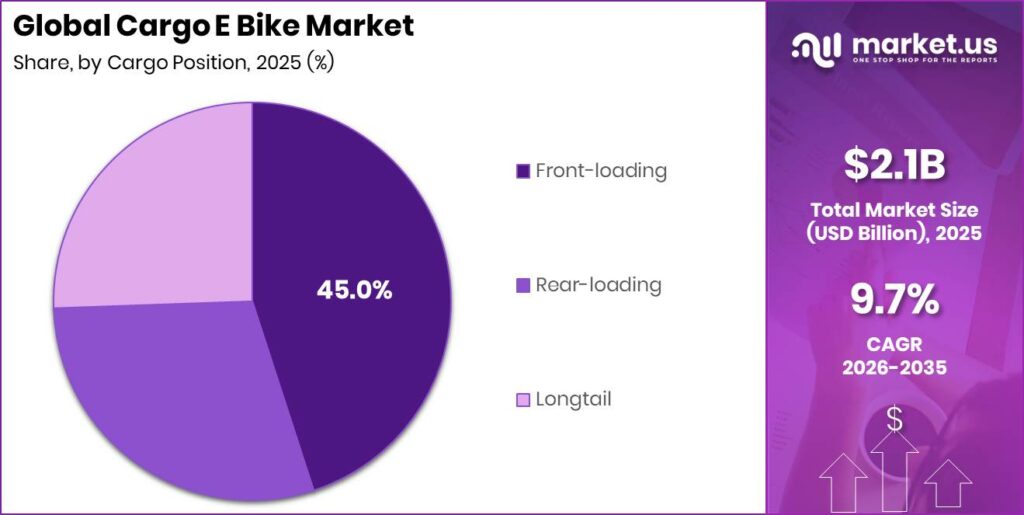
- Front-loading models held 45.00% of the By Cargo Position segment.
- Lithium-ion batteries dominated the By Battery Type segment with 64.80%.
- Below 100 kg payload units captured 30.00% of the By Payload Capacity segment.
- Logistics and delivery companies led the By End User segment with 35.00%.
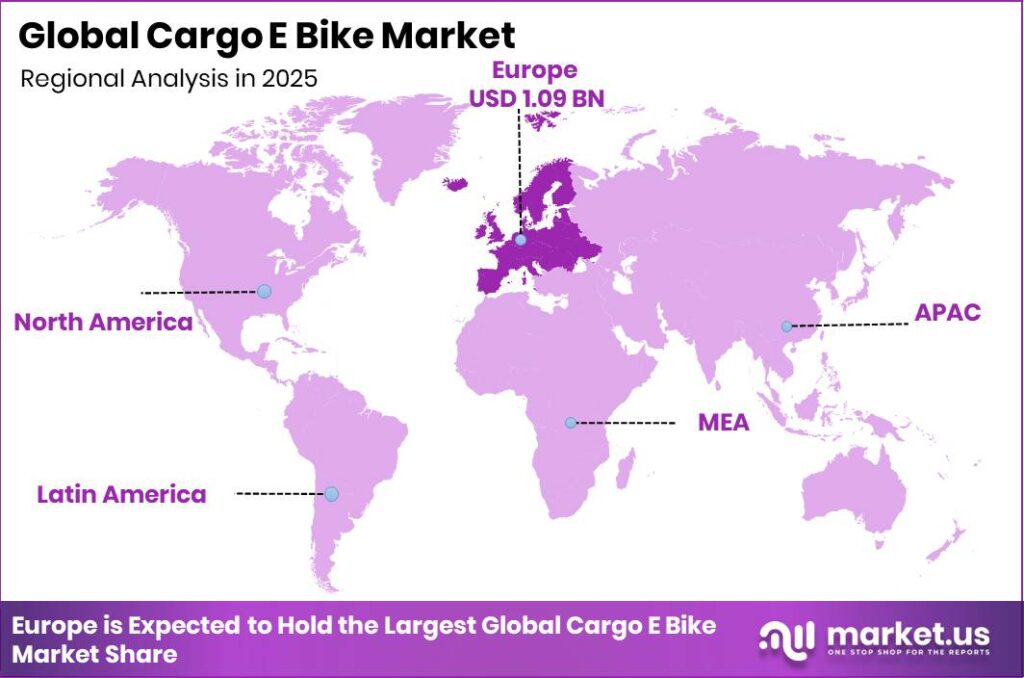
- Europe dominated regionally with a 51.00% share, valued at USD 1.09 Billion.
Government action underpins this outlook across major markets. The European Commission adopted the European Declaration on Cycling in 2024, committing authorities to secure parking and charging access. This creates predictable infrastructure that lowers deployment risk for fleet operators entering dense city routes.
As per our research, the Boston Delivers pilot accumulated an estimated 5,881 cargo-bike miles serving neighbourhood deliveries through January 2025. This measured mileage proves real-world durability beyond lab claims. Therefore, buyers can model utilization with confidence, which supports larger fleet commitments and predictable maintenance budgets.
The same Boston program estimated it avoided 2,352.5 to 3,193.5 kg of CO2e by replacing motor-vehicle trips through January 2025. This emissions cut aligns with corporate ESG targets. As a result, sustainability reporting becomes a direct sales lever for vendors targeting logistics clients. In January 2025, Tern established Tern ZE to strengthen European sales, logistics, and after-sales support.
Product Type Analysis
Two-wheeled dominates with 71.04% due to compact urban maneuverability and lower cost.
In 2025, Two-wheeled held a dominant market position in the By Product Type segment of Cargo E Bike Market, with a 71.04% share. Contemporary two-wheeled cargo models pair strong load capacity with narrow footprints. A 2026 technical review measured one model combining a 700 W motor, an estimated 60 mile range, and a 450 lb capacity. This blend lets fleets run tight city lanes, which protects delivery speed and route density.
Three-wheeled models serve heavier commercial hauling where stability matters more than agility. The 2026 Komaki XGT CAT 2.0 commercial cargo model carries a stated payload of 350 kg. This capacity suits industrial and last-mile freight beyond bike-lane parcels. Therefore, vendors targeting utility logistics should push three-wheelers into markets needing van-scale loads at bike-scale operating cost.
Four-wheeled cargo bikes anchor the specialist end of the segment for maximum payload and route substitution. In January 2026, Life EV Group won the auction to acquire Rad Power Bikes assets for approximately USD 13.2 Million, including its cargo portfolio. Consequently, consolidation signals rising confidence in heavy formats. New entrants should watch acquired brands for relaunched multi-wheel platforms that reshape competitive pricing.
Cargo Position Analysis
Front-loading dominates with 45.00% due to visible cargo and stable steering.
In 2025, Front-loading held a dominant market position in the By Cargo Position segment of Cargo E Bike Market, with a 45.00% share. Front-loaders place cargo ahead of the rider for direct sightlines and balanced steering. A 2025 technical article reports contemporary e-cargo bikes commonly support payloads of 45 to 200 kg. This range covers most parcel runs, which makes front-loaders the default choice for family and delivery buyers alike.
Rear-loading models shift weight behind the rider to preserve a bike-like ride feel and lower learning curves. A 2025 equipment review found many cargo e-bikes support 300 to 400 lb, while heavy-duty models exceed 500 lb total capacity. This flexibility suits riders new to cargo cycling. Therefore, vendors can convert conventional cyclists into cargo buyers with familiar rear-rack handling.
Longtail models extend the rear frame to carry passengers or bulky loads on a stable wheelbase. A 2026 trade review measured a 625 Wh cargo-bike battery delivering more than 90 km when lightly loaded on flat terrain. This range supports school runs and mixed family duty. Consequently, longtails open the household segment that pure freight designs cannot serve.
Battery Type Analysis
Lithium-ion dominates with 64.80% due to proven range and energy density.
In 2025, Lithium-ion held a dominant market position in the By Battery Type segment of Cargo E Bike Market, with a 64.80% share. Lithium-ion packs deliver the range fleets need for full shifts. Tern reported in July 2026 that GSD Gen 3 models provide a maximum single-battery range of 102 to 144 km. This distance covers most daily routes, which reduces mid-shift charging downtime for delivery operators.
Lithium-ion polymer variants target lighter builds and flexible pack shapes for premium designs. The Tern GSD P00 Gen 3 supports two batteries and a stated maximum riding distance of 207 km. This dual-battery reach removes range anxiety on long commercial routes. Therefore, high-range configurations let vendors command premium pricing from operators running extended urban circuits.
Lead-acid and other chemistries fill the low-cost, low-range tier for price-sensitive utility buyers. These formats collectively hold the remaining share behind the two lithium chemistries. Lead-acid units trade weight and lifespan for upfront affordability. As a result, they persist in emerging markets where acquisition cost outweighs range and longevity concerns.
Payload Capacity Analysis
Below 100 kg dominates with 30.00% due to light parcel and family use.
In 2025, Below 100 kg held a dominant market position in the By Payload Capacity segment of Cargo E Bike Market, with a 30.00% share. Light-payload bikes handle most parcel and personal trips. Tern rates the Quick Haul Long rear rack for up to 90 kg of passengers or cargo. This ceiling matches everyday deliveries, which keeps light-payload models the volume leader across urban buyers.
The 100 to 200 kg tier serves committed commercial and family users needing steady daily loads. Tern specifies a 190 kg maximum gross vehicle weight for the Quick Haul Long. A 2025 article confirms payloads commonly span 45 to 200 kg across the category. This mid-tier bridges consumer and light-fleet demand. Therefore, vendors can upsell buyers migrating from parcels to heavier mixed loads.
The above 200 kg tier anchors heavy commercial and industrial freight substitution. A 2025 equipment review found heavy-duty models exceeding 500 lb of total carrying capacity. These bikes replace light vans on constrained routes. Consequently, operators facing low-emission zones can shift bulk deliveries onto bikes without sacrificing load volume or trip economics.
End User Analysis
Logistics and delivery companies dominate with 35.00% due to route cost savings.
In 2025, Logistics and delivery companies held a dominant market position in the By End User segment of Cargo E Bike Market, with a 35.00% share. Fleets adopt cargo bikes for measurable route efficiency. The Boston Delivers pilot completed 18,375 deliveries, approximately 20,000 individual units, between September 2023 and January 2025. This volume proves commercial reliability, which anchors logistics as the leading buyer group.
Retail and e-commerce companies rank next, using bikes for fast last-mile fulfilment from local stores. Rising same-day demand pushes these firms toward bikes that skirt traffic and parking limits. In January 2026, Life EV Group acquired Rad Power Bikes assets for USD 13.2 Million, including cargo inventory. This consolidation signals supply stability. Therefore, e-commerce buyers gain more sourcing options for scalable delivery fleets.
Municipalities and public agencies deploy fleets for services and inspections within emission-restricted cores. Small and medium enterprises, individual consumers, and others hold the remaining share collectively. Families favor versatile carriers like the Quick Haul Long, which carries up to two children or one adult passenger. Consequently, vendors must serve public, SME, and household buyers with distinct duty-tuned models.
Key Market Segments
By Product Type
- Two-wheeled
- Three-wheeled
- Four-wheeled
By Cargo Position
- Front-loading
- Rear-loading
- Longtail
By Battery Type
- Lithium-ion
- Lithium-ion polymer
- Lead-acid
- Others
By Payload Capacity
- Below 100 kg
- 100–200 kg
- Above 200 kg
By End User
- Logistics and delivery companies
- Retail and e-commerce companies
- Municipalities and public agencies
- Small and medium enterprises
- Individual consumers
- Others
Regional Analysis
Europe Dominates the Cargo E Bike Market with a Market Share of 51.00%, Valued at USD 1.09 Billion
Europe led the Cargo E Bike Market in 2025 with a 51.00% share worth USD 1.09 Billion. Dense cities, low-emission zones, and strong cycling networks push adoption fastest here. In March 2025, Tern launched the third-generation GSD cargo e-bike with Bosch Smart System integration and higher payload. This upgrade targets European commercial buyers, which deepens the region’s fleet transition lead.
North America ranked as the fastest-growing region in 2025. Expanding delivery demand and micro-mobility investment drive rapid uptake despite tariff pressure. Operators there watch cost per parcel closely as van alternatives gain policy support. Therefore, vendors that localize service and financing can capture outsized growth before the market matures.
Asia-Pacific, Latin America, and the Middle East and Africa hold the remaining regional share collectively. Asia-Pacific leans on manufacturing scale and rising urban freight. Latin America and MEA remain earlier-stage utility markets. As a result, vendors should sequence entry by matching product cost tiers to each region’s purchasing power.
Key Regions and Countries
North America
- US
- Canada
Europe
- Germany
- France
- The UK
- Spain
- Italy
- Rest of Europe
Asia Pacific
- China
- Japan
- South Korea
- India
- Australia
- Rest of APAC
Latin America
- Brazil
- Mexico
- Rest of Latin America
Middle East and Africa
- GCC
- South Africa
- Rest of MEA
Market Dynamics
Market Opportunity Analysis - Underserved formats and emerging regions open entry points for new fleet-focused players
The above 200 kg payload tier remains underexploited despite proven heavy-duty capacity above 500 lb. Most volume still sits in light sub-100 kg models, leaving industrial freight thinly served. This means entrants with rugged high-load platforms face limited direct competition. Therefore, vendors targeting bulk urban logistics can build share before incumbents scale into heavy formats.
Three-wheeled models sit behind the 71.04% two-wheeled majority, yet they serve stability-first commercial hauling. Their capacity for loads like the 350 kg Komaki class fits utility routes bikes rarely reach. This creates open space for stability-focused designs. As a result, new players can own the commercial three-wheel niche while rivals chase the crowded two-wheel segment.
Asia-Pacific, Latin America, and MEA hold the share left after Europe’s 51.00% and fast-growing North America. These regions remain early-stage utility markets with rising freight needs. This means low competition and flexible price expectations. Consequently, early movers offering value-tier bikes can secure distribution and brand loyalty before premium Western players arrive.
Technology and Innovation Landscape - Dual-battery range and smart integration redefine cargo bike competition
Dual-battery architecture now anchors range leadership across premium cargo bikes. The Tern GSD S10 lifts stated range from 45 to 98 km on a single 545 Wh pack to 90 to 196 km with a 1,090 Wh dual setup. This doubling removes route limits. Therefore, manufacturers offering swappable dual packs can win full-shift commercial contracts competitors cannot serve.
Battery capacity increasingly determines real-world usability under load. A 2026 trade review measured a 625 Wh cargo battery delivering just 25 km when heavily loaded on hills but over 90 km when light on flats. This variance shapes buyer expectations. As a result, vendors must publish load-adjusted range data to build trust and reduce fleet planning risk.
Voltage and amp-hour tuning lets makers target distinct duty tiers with one platform. Komaki’s 73 V, 33 Ah model reaches 95 to 100 km, while its 73 V, 45 Ah version reaches 110 to 140 km. This modular sizing scales cost to need. Consequently, buyers pay only for the range their routes demand, which sharpens value positioning.
Drivers
Congestion, parking scarcity, and short delivery radii now shift cargo e-bikes from pilots into operating assets. A Brussels evaluation recorded about 10.1 deliveries per hour for cargo bikes against 4.9 for vans, with routes roughly 30% shorter and journey times of 48 minutes versus 99 minutes. According to EIT InnoEnergy’s 2024 analysis, a 60% cargo-bike fleet cut modeled parcel cost by about €0.05, while an 80% mix lowered cost per parcel by about 5.3%.
The European Commission’s European Declaration on Cycling, adopted in 2024, committed authorities to coherent networks, secure parking, and e-bike charging access. These milestones improve route density, asset utilization, and depot economics. This means operators can replace vehicle-purchase models with leasing, maintenance subscriptions, and per-delivery contracts. As a result, they protect margins from van depreciation, fuel, and curb-access costs.
| Driver | (~) % Impact on CAGR Forecast | Geographic Relevance | Impact Timeline |
|---|---|---|---|
| Fleet Economics in Dense Cities | +2.1% | Europe, East Asia, North America | Short term (2 years or less) |
| Urban Low-Emission Access Rules | +1.7% | Europe and selected Asian cities | Short term (2 years or less) |
| Parcel and Grocery Delivery Growth | +1.4% | Global metropolitan markets | Medium term (2 to 4 years) |
| Cycling Infrastructure Expansion | +1.2% | Europe, China, developed Asia-Pacific | Medium term (2 to 4 years) |
| Commercial Fleet Electrification Mandates | +0.9% | Europe and North America | Medium term (2 to 4 years) |
| Family Mobility Adoption | +0.7% | Western Europe and affluent urban markets | Long term (4 years or more) |
Restraints
Heavy dependence on Chinese frames, drive systems, and cells exposes landed costs to policy shocks. The U.S. Trade Representative let the Section 301 exclusion for Chinese e-bikes expire on June 14, 2024, reinstating an added 25% duty. U.S. tracking then indicated combined 2025 duties of about 55% on electric bicycles and 55% to 65% on many components, well above importers’ normal margin buffers.
U.S. regulatory analysis also identified a scheduled tariff increase on Chinese e-bike lithium batteries from 7.5% to 25% in 2026. Importers must therefore absorb margin compression, raise prices, or fund supplier relocation and extra inventory. This delays fleet procurement and freezes price-sensitive household and small-business sales. Consequently, otherwise positive demand stalls at the point of purchase.
| Restraint | (~) % Impact on CAGR Forecast | Geographic Relevance | Impact Timeline |
|---|---|---|---|
| Import Tariffs and Trade Barriers | -1.8% | United States and European Union | Short term (2 years or less) |
| High Upfront Acquisition Cost | -1.5% | Global, strongest in emerging markets | Short term (2 years or less) |
| Battery Fire Liability Restrictions | -1.2% | North America and dense global cities | Short term (2 years or less) |
| Fragmented Vehicle Classification | -0.9% | North America and Asia-Pacific | Medium term (2 to 4 years) |
| Limited Purchase Incentive Coverage | -0.7% | Emerging markets and rural regions | Medium term (2 to 4 years) |
| Constrained Commercial Credit Access | -0.6% | Small enterprises globally | Short term (2 years or less) |
Challenges
High daily charge cycles, payload-sensitive range, and mixed pack formats create an uptime and residual-value problem. Under the EU Batteries Regulation, as summarized by the IEA, lithium-battery recycling efficiency must reach 65% by end of 2025 and lithium recovery 50% by end of 2027, with packs made readily removable. European guidance also sets light-transport battery collection at 51% by end of 2028 and requires free return systems from August 2025.
European Commission urban-logistics guidance notes cargo bikes are larger and heavier than conventional cycles, and riders may lack safety training. Manufacturers therefore need modular pack architecture, battery-health telemetry, reverse logistics, and technician certification. This raises engineering and service overhead. As a result, fleet operators retain spare packs and reserve vehicles to protect route completion.
| Challenge | (~) % CAGR Friction Drag | Geographic Relevance | Mitigation Horizon |
|---|---|---|---|
| Battery Lifecycle Complexity | -1.3% | Global, highest in Europe | Medium term (2 to 4 years) |
| Payload Range Trade-Offs | -1.1% | Global commercial fleets | Medium term (2 to 4 years) |
| Specialist Service Network Gaps | -0.9% | North America and emerging Asia-Pacific | Medium term (2 to 4 years) |
| Micro-Hub Integration Complexity | -0.8% | Dense metropolitan markets | Long term (4 years or more) |
| Rider Training and Retention | -0.7% | Global logistics fleets | Medium term (2 to 4 years) |
| Weather-Linked Utilization Volatility | -0.5% | Northern Europe and North America | Long term (4 years or more) |
Opportunities
Fleet-as-a-Service remains white space because most cargo e-bike sales still monetize hardware alone. EIT InnoEnergy modeling found an 80% cargo-bike and 20% e-van mix could cut parcel costs by about 5.3% now and about 17.0% by 2030, lifting savings per parcel from roughly €0.08 to €0.28. A Brussels evaluation put cargo-bike cost per parcel near one-fifth of the van equivalent with emissions about 96% to 98% lower.
Urban Freight Lab evidence indicates only 10% to 30% of delivery trips may be substitutable in typical deployments, leaving a selective conversion pool. Providers that aggregate demand can shift revenue from one-time sales to recurring contracts. This reduces customer CapEx and improves lifetime margin. As a result, they can capture an estimated 5% to 10% unit-economic benefit from higher utilization and bundled software.
| Opportunity | (~) % Potential CAGR Upside | Geographic Relevance | Execution Window |
|---|---|---|---|
| Fleet-as-a-Service Platforms | +1.9% | Europe, North America, developed Asia-Pacific | Medium term (2 to 4 years) |
| Cold-Chain Urban Delivery | +1.5% | Global metropolitan markets | Medium term (2 to 4 years) |
| Municipal and Campus Fleets | +1.2% | Europe, North America, Gulf cities | Medium term (2 to 4 years) |
| Emerging-Market Utility Logistics | +1.0% | India, Southeast Asia, Latin America | Long term (4 years or more) |
| Refurbishment and Second-Life Channels | +0.8% | Europe and North America | Long term (4 years or more) |
| Connected Fleet Data Services | +0.7% | Advanced logistics markets | Medium term (2 to 4 years) |
Cargo E-Bike Market Trends
Microhub-Based Delivery Is Replacing Depot-to-Door Van Models
Cargo e-bikes are not replacing vans on long routes. They are replacing vans on the wrong routes — short-distance, dense, stop-heavy urban runs where large vehicles lose time to congestion and parking. The emerging model pairs urban consolidation microhubs with electric cargo bikes to complete the final leg. Amazon completed 100 million deliveries across more than 50 European cities using electric cargo bikes, electric mopeds, and pushcarts and announced 25 additional hubs for 2026. In Berlin alone, more than 1.5 million parcels are delivered by e-cargo bike annually.
Subscription and Fleet-as-a-Service Models Are Lowering Entry Barriers
Most cargo e-bike sales still monetize hardware alone. That is changing. Fleet-as-a-Service platforms bundle the bike, maintenance, insurance, battery management, and routing software into a monthly fee, converting capital expenditure into operational expenditure. EIT InnoEnergy modeling found an 80% cargo-bike and 20% e-van fleet mix could cut parcel costs by 5.3% today and 17.0% by 2030, lifting per-parcel savings from roughly €0.08 to €0.28. Upway’s November 2025 Series C raise of USD 60 million, led by A.P. Moller Holding, signals investor confidence in recurring-revenue cargo mobility platforms.
Dual-Battery and High-Capacity Packs Are Extending Commercial Route Coverage
Single-battery platforms limited cargo e-bikes to inner-city zones. Dual-battery configurations are now pushing operational range into peri-urban corridors. Tern’s GSD Gen 3 delivers 102 to 144 km on a single battery and up to 207 km with dual-battery configuration. This range expansion directly increases the share of van routes that cargo e-bikes can viably substitute, widening the total addressable market beyond dense city centers.
Four-Wheeled Cargo Formats Are Entering Commercial Parcel Networks
Four-wheeled cargo e-bikes are moving from niche to mainstream in commercial logistics. FedEx deployed four-wheeled e-cargo bikes in London capable of carrying 170 kg over 45 miles per charge. Washington DC’s MicroFreight pilot with Amazon uses four-wheeled battery-powered bikes with secure rear cargo holds, windshields, and wipers — signals that all-weather commercial durability is now a design requirement, not a feature.
Trends and Disruptions Impacting Buyers
Tariff Exposure Is Rewriting Landed Cost Models
The U.S. Section 301 exclusion for Chinese e-bikes expired June 14, 2024, reinstating a 25% duty. Combined 2025 U.S. duties on electric bicycles reached approximately 55%, with a scheduled increase on Chinese e-bike lithium batteries from 7.5% to 25% landing in 2026. Fleet buyers sourcing from China-dependent supply chains face landed cost inflation that delays procurement decisions and compresses margins. Vendors with regional assembly or diversified sourcing hold a direct competitive advantage.
EU Battery Regulation Is Adding Compliance Cost to Fleet Operations
Under the EU Batteries Regulation, lithium-battery recycling efficiency must reach 65% by end of 2025 and lithium recovery 50% by end of 2027. Light-transport battery collection targets reach 51% by end of 2028, with free return systems required from August 2025. Fleet operators now need modular pack architecture, battery-health telemetry, and reverse logistics capability — costs that favor larger operators and vertically integrated manufacturers over independent importers.
Safety and Quality Standards Are Tightening After High-Profile Recalls
The 2024 Babboe recall across the UK and Europe demonstrated that frame durability and quality documentation are becoming commercial prerequisites. Buyers are asking for operating data — stops per shift, range under payload, component failure rates — not just specifications. Vendors that can provide fleet utilization data from real deployments will close procurement cycles faster than those relying on lab claims.
Commercial Use Cases Across Industries
| Industry | Use Case | Key Benefit |
|---|---|---|
| Parcel and Courier | Last-mile delivery from urban microhubs | 10.1 stops per hour vs 4.9 for vans; routes 30% shorter |
| Grocery and Quick Commerce | Same-day fulfilment from local dark stores | Avoids congestion charges; fits narrow urban streets |
| Municipal Services | Waste collection, park maintenance, inspections | Replaces oversized vans on short urban service routes |
| Family and Personal | School runs, shopping, second-car replacement | Up to two children or 90 kg payload; 90 plus km range |
| Retail and E-Commerce | Micro-fulfilment center distribution | Exempt from LEZ charges; lower cost per parcel |
| Healthcare and B2B Courier | Medical supply and document delivery | Reliable multi-stop urban routing without parking penalties |
The Boston Delivers pilot gives the most granular commercial proof point available in the North American market. Running from September 2023 through January 2025, the program completed 18,375 deliveries covering approximately 5,881 cargo-bike miles, avoided an estimated 2,352.5 to 3,193.5 kg of CO2e, and found that one cargo-bike mile replaced 1.4 truck miles. These figures give fleet buyers a measured operating benchmark rather than a theoretical model.
Market Ecosystem
Raw Material and Cell Suppliers
Lithium-iron-phosphate and lithium-ion cell producers, primarily concentrated in China, South Korea, and Japan, supply the battery chemistry that determines range, weight, and cycle life. Tariff pressure on this layer is the single largest near-term cost risk for non-Chinese manufacturers. The scheduled 2026 U.S. tariff increase on Chinese e-bike lithium batteries from 7.5% to 25% hits this layer directly.
Component Manufacturers
This layer includes motor system producers such as Bosch eBike Systems, Shimano, and Bafang, alongside battery pack assemblers, frame fabricators, and drivetrain suppliers. Mid-drive motor systems from Bosch dominate European commercial platforms. Hub motors anchor the value segment in Asia-Pacific and North America. Belt drive systems are gaining share as the fastest-growing drivetrain format due to lower maintenance requirements in commercial fleet applications.
Cargo E-Bike Producers
This layer spans premium European manufacturers including Riese and Müller, Urban Arrow, Tern, and Gazelle; volume Asian producers including AIMA and Jinhua JOBO; and North American direct-to-consumer brands including Rad Power Bikes, whose assets were acquired by Life EV Group in January 2026 for approximately USD 13.2 million. Producer strategy is splitting between hardware-only sales and integrated fleet service models.
Fleet Operators and Logistics Buyers
This layer converts vehicles into delivery infrastructure. Amazon, FedEx, DHL, PostNL, and DPD have moved cargo e-bike deployments from pilot to permanent fleet status in European city centers. The Brussels evaluation recorded cargo-bike cost per parcel at approximately one-fifth of the van equivalent, with emissions 96% to 98% lower. These economics anchor fleet buyer demand as the primary growth engine of the market.
Infrastructure and Service Providers
Microhubs, depot charging networks, battery swap stations, fleet management software providers, and maintenance service networks form the operating layer that determines whether cargo e-bikes function as daily logistics assets or remain underutilized. The European Declaration on Cycling, adopted by the European Commission in 2024, committed authorities to coherent cycling networks, secure parking, and e-bike charging access — creating the infrastructure conditions that make commercial fleet scaling possible.
Key Company Insights
The cargo e-bike competitive landscape is moderately fragmented. No single manufacturer holds dominant global share. Competition is splitting between premium European engineering brands, volume Asian producers, and North American direct-to-consumer platforms. The strongest competitive positions belong to companies that combine product reliability, fleet service capability, and software integration rather than hardware specification alone.
Tern Bicycles
Tern holds a structural advantage through its GSD platform family and the January 2025 launch of Tern ZE, a dedicated European sales, logistics, and after-sales subsidiary. The GSD Gen 3, launched March 2025, integrates Bosch Smart System, delivers 102 to 144 km single-battery range, and supports up to 207 km with dual batteries. In August 2025, Tern partnered with Upway to launch a certified trade-in and refurbishment channel, widening its market funnel beyond new-unit sales. Premium pricing constrains reach into cost-sensitive emerging markets.
Gazelle
Gazelle entered the longtail cargo segment in January 2025 with the Cabby, its first electric longtail cargo bike designed to carry up to two children or heavy cargo loads. The launch positions Gazelle to compete in the European family and light commercial segment alongside Tern and Urban Arrow. Gazelle’s established Dutch dealer network and brand equity in the commuter segment give it distribution depth that newer cargo-only brands cannot match.
Rad Power Bikes
Rad Power Bikes, previously the largest direct-to-consumer e-bike brand in North America, entered insolvency before Life EV Group acquired its assets in January 2026 for approximately USD 13.2 million. Life EV Group completed the acquisition in March 2026 and announced plans to relaunch the brand, reopen retail stores, and continue cargo platform development. The relaunched Rad brand retains significant consumer recognition in the North American mid-market segment.
Komaki
Komaki targets heavy commercial utility with value pricing. Its XGT CAT 2.0 uses a 3.07 kWh battery, claims 120 to 125 km range, and reaches 65 km per hour top speed with a 350 kg payload rating. This specification profile suits industrial last-mile routes in emerging markets where payload capacity and acquisition cost outweigh regulatory compliance considerations. Western city safety classifications constrain Komaki’s faster models in European and North American commercial fleet procurement.
Upway
Upway occupies a distinct position as a certified refurbished e-bike platform rather than a primary manufacturer. Its November 2025 Series C raise of USD 60 million, led by A.P. Moller Holding, funds expansion across the U.S. and Europe including cargo e-bike offerings. The Tern trade-in partnership established in August 2025 gives Upway a direct supply channel for certified cargo e-bike inventory. As fleet replacement cycles shorten, a trusted refurbishment platform becomes a structurally valuable part of the ecosystem.
Key Players
- Tern Bicycles
- Komaki
- Gazelle
- Rad Power Bikes
- Life Electric Vehicles Holdings
- Upway
Analyst Insight
The cargo e-bike market is not growing because electric bikes are fashionable. It is growing because vans are becoming structurally expensive to operate in dense cities. Congestion charges, low-emission zone access fees, parking penalties, and rising fuel costs are making the last-mile economics of conventional delivery vehicles progressively worse in exactly the corridors where cargo e-bikes perform best.
The Brussels evaluation data makes this concrete: cargo bikes completed 10.1 deliveries per hour versus 4.9 for vans on comparable urban routes, with journey times 51 minutes shorter. At an 80% cargo-bike fleet mix, EIT InnoEnergy modeling projects per-parcel cost savings reaching €0.28 by 2030. These are not marginal efficiency gains. They represent a fundamental restructuring of last-mile unit economics that fleet operators cannot ignore.
The market’s 9.7% CAGR through 2035 reflects this structural shift, not a trend. The vendors that will capture disproportionate share are not those with the lightest frame or the longest range claim. They are the ones that can deliver reliable operating data, comply with tightening EU battery and safety regulations, absorb tariff pressure through supply chain diversification, and build the service networks that fleet operators need to commit to volume procurement. The product is table stakes. The operating model is the competitive advantage.
Industry News and Recent Developments
- In Mar 2026, Life EV Group finalised a court-approved asset acquisition of the Rad Power Bikes brand, unveiling strategic roadmaps to relaunch the brand, reopen retail storefronts, and advance its utility and cargo bike roster.
- In Nov 2025, refurbished e-bike platform Upway successfully closed a USD 60 million Series C funding round led by A.P. Moller Holding to scale its operations and cargo e-bike offerings across the U.S. and Europe.
- In Aug 2025, Tern entered a strategic partnership with Upway to deploy an e-bike trade-in program, allowing users to exchange used e-bikes for new Tern cargo models and forming a structured, certified refurbished supply pipeline.
- In Mar 2025, Tern launched its third-generation GSD cargo e-bike, integrating a Bosch Smart System, higher payload capacities, and an improved rear rack architecture targeting commercial and family riders.
- In Jan 2025, Tern established Tern ZE as its dedicated European distribution and subsidiary entity in Germany to consolidate and streamline regional logistics, sales, and after-sales support.
- In Jan 2025, Gazelle introduced the Cabby C380, its debut longtail electric cargo bike featuring a Bosch Smart System, built to accommodate up to two children or heavy goods for European families and businesses.
- In Jun 2024, the U.S. Section 301 tariff exclusion for Chinese e-bikes expired, reinstating a 25% additional duty and increasing landed costs for North American importers reliant on Chinese manufacturing pipelines.
- In Apr 2024, the European Commission published the European Declaration on Cycling, officially committing member state authorities to establish coherent cycling networks, secure parking, and e-bike charging infrastructure across urban areas.
Geopolitical Impact Analysis
Trade friction directly reshapes cargo e-bike sourcing and pricing. According to the WTO, global merchandise trade tensions have widened tariff exposure across electric mobility supply chains dependent on Chinese components. U.S. duties on Chinese e-bikes reached roughly 55% in 2025, while a battery tariff rise from 7.5% to 25% lands in 2026. This means importers face steep landed-cost inflation. As a result, manufacturers accelerate supplier diversification to protect margins.
Supply-chain rerouting and freight volatility compound component risk for bike makers. As reported by UNCTAD, extended shipping detours around key trade routes have lifted container transit times and freight rates well above pre-disruption levels, with some lane costs climbing over 100%. Longer lead times strain just-in-time frame and battery inventory. Therefore, firms holding buffer stock and regional assembly gain a delivery reliability edge over import-only rivals.
Research Methodology
This report is built on a combination of primary research, secondary data collection, and quantitative market modeling validated through direct industry engagement.
Primary Research
Primary research forms the core of the methodology. Data was gathered through structured interviews with cargo e-bike manufacturers, fleet procurement managers, logistics operators, battery and motor system suppliers, and urban freight policy specialists across Europe, North America, and Asia-Pacific. Interview outputs provided operational data on delivery performance, fleet economics, procurement criteria, and technology adoption rates that secondary sources alone cannot supply.
Secondary Research
Secondary sources included company annual reports and investor presentations, EU regulatory filings and urban mobility policy documents, trade association publications, city logistics pilot program evaluations including Boston Delivers and MicroFreight DC, and industry databases covering e-bike production volumes and trade flows by HS code 871160. EIT InnoEnergy fleet cost modeling, Transport for London cargo bike substitution analysis, and ZIV German cargo bike sales data were used as third-party reference benchmarks.
Market Sizing Approach
Market size was derived using a bottom-up approach starting from manufacturer revenue data and production volume figures at the country level, aggregated to regional and global totals. Segment shares by product type, battery type, cargo position, payload capacity, and end user were derived from primary interview data and validated against secondary sources. Average selling prices by segment and region were gathered from primary sources and cross-checked against publicly available retail and fleet procurement data.
Forecast Methodology
Forecasts incorporate documented CAGR impact estimates for each identified driver, restraint, challenge, and opportunity. Fleet economics in dense cities (+2.1% CAGR impact), urban low-emission access rules (+1.7%), and parcel and grocery delivery growth (+1.4%) represent the three largest positive contributors. Import tariffs and trade barriers (-1.8%), high upfront acquisition cost (-1.5%), and battery fire liability restrictions (-1.2%) represent the three largest drags. All impact estimates were validated through primary expert review and sensitivity analysis across base, optimistic, and conservative scenarios.
Report Scope
| Report Features | Description |
|---|---|
| Market Value (2025) | USD 2.1 Billion |
| Forecast Revenue (2035) | USD 5.4 Billion |
| CAGR (2026-2035) | 9.7% |
| Base Year for Estimation | 2025 |
| Historic Period | 2020-2024 |
| Forecast Period | 2026-2035 |
| Report Coverage | Revenue Forecast, Market Dynamics, Market Opportunity Analysis, Technology and Innovation Landscape, Competitive Landscape, Recent Developments |
| Segments Covered | By Product Type (Two-wheeled, Three-wheeled, Four-wheeled), By Cargo Position (Front-loading, Rear-loading, Longtail), By Battery Type (Lithium-ion, Lithium-ion polymer, Lead-acid, Others), By Payload Capacity (Below 100 kg, 100–200 kg, Above 200 kg), By End User (Logistics and delivery companies, Retail and e-commerce companies, Municipalities and public agencies, Small and medium enterprises, Individual consumers, Others) |
| Regional Analysis | North America (US and Canada), Europe (Germany, France, The UK, Spain, Italy, and Rest of Europe), Asia Pacific (China, Japan, South Korea, India, Australia, and Rest of APAC), Latin America (Brazil, Mexico, and Rest of Latin America), Middle East and Africa (GCC, South Africa, and Rest of MEA) |
| Competitive Landscape | Tern Bicycles, Komaki, Gazelle, Rad Power Bikes, Life Electric Vehicles Holdings, Upway |
| Customization Scope | Customization for segments, region / country-level will be provided. Additional customization can be done based on requirements. |
| Purchase Options | We have three licenses to opt for: Single User License | Multi-User License (Up to 5 Users) | Corporate Use License (Unlimited User and Printable PDF) |





































