• email inquiry@market.us
  • phone+1 718 618 4351 (International)
  • phone+91 78878 22626 (Asia)
  • About Us
  • Contact Us
menu One Stop Shop For Reports One Stop Shop For Reports
search more_vert
  • Home
  • All Reports
  • All Sectors
  • Infographics
  • News Media
    • United States
    • United Kingdom
    • Asia Pacific
  • Who Trust Us
Home / Reports / Aircraft Piston Engines Market
  • Home / Reports / Aircraft Piston Engines Market

Global Aircraft Piston Engines Market By Type (Above 300 Hp Engine, 180-300 Hp Engine, And Under 180 Hp Engine), By Application (Private Usage, Education Usage, Commercial Usage, And Others), By Region And Key Companies - Industry Segment Outlook, Market Assessment, Competition Scenario, Trends And Forecast 2019-2029

  • Overview
  • Table of Contents
  • Major Market Players
  • Inquiry Before Buying
  • account_circleAbout Me
    • 14734
    • $3,495.00
    • $5,100.00
    • $7,200.00
    Buy Now

    Market.us announces publication of its most recently generated research report titled, “Global Aircraft Piston Engines Market by Product Type (Above 300 hp Engine, 180-300 hp Engine, under 180 hp Engine), By End-Use (Private, Education, Commercial & Military), and by Region – Global Forecast to 2029.”, which offers a holistic view of the global Aircraft Piston Engines market through systematic segmentation that covers every aspect of the target market.

    The global Aircraft Piston Engines market is projected to be US$ 53.7 Mn in 2019 to reach US$ 59.8 Mn by 2029 at a CAGR of 1.1%.

    An engine is the main power source that forces an aircraft to lift and fly in the air over the distance. A piston engine is a device for converting the heat energy of the fuel into mechanical energy by internal combustion. It is commonly known as a reciprocating engine or internal combustion engine that uses one or more reciprocating piston. Piston engine in aircraft can be found in the configuration of two cylinders inline up to eight cylinders opposed and nine-cylinder radial and also in diesel and with fuel injection system.  Etienne Lenoir constructed the first piston engine that could be considered practical in France in 1860. Most of the light aircraft is powered by a piston engine, as it is an economical source of power due to low price and fuel consumption. Additionally, piston-engine aircraft are easier to operate since there don’t have separate throttle and mixture control. Moreover, the piston engine creates less noise and vibration, which gives a high degree of maneuverability. The increase in training aircraft procurement is expected to drive the aircraft piston engine market. Owing to the advantages of the fuel efficiency of the engine with a high compression ratio, high heat, and low fuel consumption, piston engine market is expected to grow considerably. Also, low maintenance and manufacturing cost related to piston engine is expected to boost the demand for aircraft piston engine market. 

    Request Covid - 19 Impact
    trending_up Total Revenue in 2018

    US$ 53.7

    trending_up Market CAGR of the Next Ten Years

    1.1%

    no_encryption Market Value (US$ Mn), Share (%) and Growth Rate (%) Comparison 2012-2028

    Purchase this report or a membership to unlock the market value (US$ Mn), share (%) and growth rate (%) comparison for this industry.
    • By Type
    • By Region
    • By Application
    no_encryption Leading Companies Financial Highlights

    Purchase this report or a membership to unlock the leading companies financial highlights for this industry.

    trending_up Market Revenue of the Next Ten Years

    US$ 59.8

    In the past few decades, demand for aircraft has been increasing in various verticals such as passenger aircraft, cargo aircraft, and space research and technology. Globalization has significantly promoted the aircraft across the globe, which has increased the demand for aircraft piston engine market.

    Global Aircraft Piston Engines Market Revenue (US$ Mn), 2019–2029

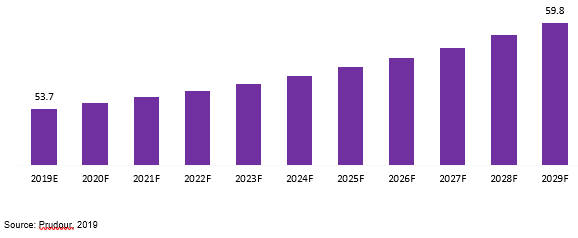
    However, increasing use of the jet engine and turbofan engine in aircraft due to its high efficiency, advanced compressor, and turbine disk technology power engine are expected to hamper the growth of piston engine market. Nonetheless, use of aircraft in the military sector for patrolling, drug tracking, illegal infiltration is expected to create a new opportunity for aircraft piston engine market in different vertical also opportunity in field of agriculture application for aerial application of pesticides or fertilizer and hydro seeding.

    Global Aircraft Piston Engines market is segmented on the basis of product type, end-use and region. On the basis of product type, the market is segmented into Above 300 hp Engine, 180-300 hp Engine, Under 180 hp Engine. The 180-300 hp Engine segment accounts for the majority share and is expected to register highest growth over forecast period, followed by Above 300 hp Engine segment. On the basis of end-use, the market is segmented into Private, Education, Commercial & Military. The Commercial segment accounts for a majority share in the global Aircraft Piston Engines market.

    Global Aircraft Piston Engines Market by End-Use, 2018

    On the basis of region, the market is segmented into North America, Europe, APAC, South America and Middle East Africa. The North America accounts for the majority share in the global Aircraft Piston Engines market, Rise in disposable income among consumer. APAC is expected to register highest growth rate over forecast period. Regions such as Europe, South America and MEA are expected to register stable growth over the forecast period.

    The research report on the global Aircraft Piston Engines market includes profiles of some of major companies such as Textron Inc., Aviation Industry Corporation of China, Austro Engines, BRP Inc, Safran SA, Jabiru Aircraft Pty Ltd and Limbach Flugmotoren GmbH.

    Key Market Segments

    Type

    • Above-300-hp Engine
    • 180-300-hp Engine
    • Under-180-hp Engine

    Application

    • Private Usage
    • Education Usage
    • Commercial Usage
    • Military Usage
    • Others

    Key Market Players included in the report:

    • Textron Inc.
    • Aviation Industry Corporation of China
    • Austro Engines
    • BRP Inc
    • Safran SA
    • Jabiru Aircraft Pty Ltd and Limbach Flugmotoren GmbH.

    For the Aircraft Piston Engines Market research study, the following years have been considered to estimate the market size:

    Particular Scope
    Region

    • North America
    • Europe
    • Asia Pacific
    • Latin America
    • Middle East and Africa
    Historic Year 2015 to 2020
    Estimated Year 2021
    Forecast Year 2022 to 2031

    Aircraft Piston Engines Market

    add_shopping_cartBuy Now get_appDownload Sample
    keyboard_arrow_up
  • account_circleAbout Me
    • 14734
    • $3,495.00
    • $5,100.00
    • $7,200.00
    Buy Now
    • Chapter 1 Global Aircraft Piston Engines Market Overview
      • 1.1 Introduction
      • 1.2 Taxonomy
      • 1.3 Drivers for Global Aircraft Piston Engines Market
      • 1.4 Restraints for Global Aircraft Piston Engines Market
      • 1.5 Opportunities for Global Aircraft Piston Engines Market
      • 1.6 Trends for Global Aircraft Piston Engines Market
      • 1.7 PEST Analysis
      • 1.8 PORTER'S Five Forces Analysis
      • 1.9 Macro-Economic Factors
      • 1.10 Market Share Analysis, 2019
      • 1.11 Opportunity Map Analysis
        • 1.11.1 Optimistic Scenario
        • 1.11.2 Likely Scenario
        • 1.11.3 Conservative Scenario
      • 1.12 Opportunity Orbits
      • 1.13 Regional Market Share and BPS Analysis of Aircraft Piston Engines Market
      • 1.14 Market Investment Feasibility Analysis
      • 1.15 Market Expansion Strategies
      • 1.16 Market Penetration Strategies
      • 1.17 Cost Structure Analysis
      • 1.18 Industry Chain Analysis
      • 1.19 Comparative Analysis of Various Types of Aircraft Engines by Speed and Application
    • Chapter 2 Global Aircraft Piston Engines Market Overview
      • 2.1 Global Aircraft Piston Engines Market by Product Type
        • 2.1.1 Global Aircraft Piston Engines Revenue (US$ Mn) Comparison by Product Type (2013-2029)
        • 2.1.2 Global Aircraft Piston Engines Revenue (US$ Mn) Market Share by Product Type in 2019
        • 2.1.3 Global Aircraft Piston Engines Market Attractiveness Analysis by Product Type, 2013–2019
      • 2.2 Global Aircraft Piston Engines Market by End Use
        • 2.2.1 Global Aircraft Piston Engines Revenue (US$ Mn) Comparison by End Use (2013-2029)
        • 2.2.2 Global Aircraft Piston Engines Revenue (US$ Mn) Market Share by End Use in 2019
        • 2.2.3 Global Aircraft Piston Engines Market Attractiveness Analysis by End Use, 2013–2019
      • 2.3 Global Aircraft Piston Engines Market Outlook by Region
        • 2.3.1 Global Aircraft Piston Engines Revenue (US$ Mn) Comparison by Region (2013-2029)
        • 2.3.2 Global Aircraft Piston Engines Revenue (US$ Mn) Market Share by Region in 2018
        • 2.3.3 Global Aircraft Piston Engines Market Attractiveness Analysis by Region, 2012–2018
      • 2.4 Global Aircraft Piston Engines Market Outlook (2013-2029)
        • 2.4.1 Global Aircraft Piston Engines Revenue (US$ Mn) (2013-2020)
        • 2.4.2 Global Aircraft Piston Engines Revenue (US$ Mn) (2021-2029)
      • 2.5 Global Aircraft Piston Engines Revenue (US$ Mn) by Regions
        • 2.5.1 Global Aircraft Piston Engines Revenue (US$ Mn) Comparison by Region (2013-2020)
        • 2.5.2 Global Aircraft Piston Engines Revenue (US$ Mn) Comparison by Region (2021-2029)
      • 2.6 Global Aircraft Piston Engines Revenue (US$ Mn) by Product Type
        • 2.6.1 Global Aircraft Piston Engines Revenue (US$ Mn) Comparison by Product Type (2013-2020)
        • 2.6.2 Global Aircraft Piston Engines Revenue (US$ Mn) Comparison by Product Type (2021-2029)
      • 2.7 Global Aircraft Piston Engines Revenue (US$ Mn) by End Use
        • 2.7.1 Global Aircraft Piston Engines Revenue (US$ Mn) Comparison by End Use (2013-2020)
        • 2.7.2 Global Aircraft Piston Engines Revenue (US$ Mn) Comparison by End Use (2021-2029)
      • 2.8 Global Aircraft Piston Engines Y-o-Y Growth Rate Comparison 2014–2029
        • 2.8.1 Global Aircraft Piston Engines Y-o-Y Growth Rate by Region
        • 2.8.2 Global Aircraft Piston Engines Market Y-o-Y Growth Rate by Product Type
        • 2.8.3 Global Aircraft Piston Engines Y-o-Y Growth Rate by End Use
      • 2.9 Global Aircraft Piston Engines Share Comparison 2014–2029
        • 2.9.1 Global Aircraft Piston Engines Share by Region
        • 2.9.2 Global Aircraft Piston Engines Market Share by Product Type
        • 2.9.3 Global Aircraft Piston Engines Share by End Use
    • Chapter 3 North America Aircraft Piston Engines Market Overview
      • 3.1 Country Profile – United States
        • 3.1.1 Economy Indicators of the US
        • 3.1.2 GDP composition by Sector, 2018
        • 3.1.3 Total Population (in ‘000s) of the US, 2010-2050
        • 3.1.4 Age Mix by Broader Age Groups, 2010-2050
        • 3.1.5 Population Pyramid of US, 2018
        • 3.1.6 Labor Force (‘000s) and Unemployment Rate (% of Labor Force)
        • 3.1.7 Unemployment Level (%) by Education
        • 3.1.8 Demographic Overview of the US, 2017-2018
        • 3.1.9 Current Health Expenditure (US$ Bn) and Expenditure Source (%)
        • 3.1.10 Infrastructure Profile, 2017-2018
        • 3.1.11 Ease of Doing Business Ranking, 2019
      • 3.2 Country Profile – Canada
        • 3.2.1 Economy Indicators of Canada
        • 3.2.2 GDP composition by Sector, 2018
        • 3.2.3 Total Population (in ‘000s) of Canada, 2010-2050
        • 3.2.4 Age Mix by Broader Age Groups, 2010-2050
        • 3.2.5 Population Pyramid of US, 2018
        • 3.2.6 Labor Force (‘000s) and Unemployment Rate (% of Labor Force)
        • 3.2.7 Unemployment Level (%) by Education
        • 3.2.8 Demographic Overview of Canada, 2017-2018
        • 3.2.9 Current Health Expenditure (US$ Bn) and Expenditure Source (%)
        • 3.2.10 Infrastructure Profile, 2017-2018
        • 3.2.11 Ease of Doing Business Ranking, 2019
      • 3.3 Country Profile – Mexico
        • 3.3.1 Economy Indicators of Mexico
        • 3.3.2 GDP composition by Sector, 2018
        • 3.3.3 Total Population (in ‘000s) of Mexico, 2010-2050
        • 3.3.4 Age Mix by Broader Age Groups, 2010-2050
        • 3.3.5 Population Pyramid of US, 2018
        • 3.3.6 Labor Force (‘000s) and Unemployment Rate (% of Labor Force)
        • 3.3.7 Unemployment Level (%) by Education
        • 3.3.8 Demographic Overview of Mexico, 2017-2018
        • 3.3.9 Current Health Expenditure (US$ Bn) and Expenditure Source (%)
        • 3.3.10 Infrastructure Profile, 2017-2018
        • 3.3.11 Ease of Doing Business Ranking, 2019
      • 3.4 North America Aircraft Piston Engines Market by Product Type
        • 3.4.1 North America Aircraft Piston Engines Revenue (US$ Mn) Comparison by Product Type (2013-2029)
        • 3.4.2 North America Aircraft Piston Engines Revenue (US$ Mn) Market Share by Product Type in 2019
        • 3.4.3 North America Aircraft Piston Engines Market Attractiveness Analysis by Product Type, 2013–2019
      • 3.5 North America Aircraft Piston Engines Market by End Use
        • 3.5.1 North America Aircraft Piston Engines Revenue (US$ Mn) Comparison by End Use (2013-2029)
        • 3.5.2 North America Aircraft Piston Engines Revenue (US$ Mn) Market Share by End Use in 2019
        • 3.5.3 North America Aircraft Piston Engines Market Attractiveness Analysis by End Use, 2013–2019
      • 3.6 North America Aircraft Piston Engines Market Outlook by Region
        • 3.6.1 North America Aircraft Piston Engines Revenue (US$ Mn) Comparison by Region (2013-2029)
        • 3.6.2 North America Aircraft Piston Engines Revenue (US$ Mn) Market Share by Region in 2018
        • 3.6.3 North America Aircraft Piston Engines Market Attractiveness Analysis by Region, 2012–2018
      • 3.7 North America Aircraft Piston Engines Market Outlook (2013-2029)
        • 3.7.1 North America Aircraft Piston Engines Revenue (US$ Mn) (2013-2020)
        • 3.7.2 North America Aircraft Piston Engines Revenue (US$ Mn) (2021-2029)
      • 3.8 North America Aircraft Piston Engines Revenue (US$ Mn) by Regions
        • 3.8.1 North America Aircraft Piston Engines Revenue (US$ Mn) Comparison by Region (2013-2020)
        • 3.8.2 North America Aircraft Piston Engines Revenue (US$ Mn) Comparison by Region (2021-2029)
      • 3.9 North America Aircraft Piston Engines Revenue (US$ Mn) by Product Type
        • 3.9.1 North America Aircraft Piston Engines Revenue (US$ Mn) Comparison by Product Type (2013-2020)
        • 3.9.2 North America Aircraft Piston Engines Revenue (US$ Mn) Comparison by Product Type (2021-2029)
      • 3.10 North America Aircraft Piston Engines Revenue (US$ Mn) by End Use
        • 3.10.1 North America Aircraft Piston Engines Revenue (US$ Mn) Comparison by End Use (2013-2020)
        • 3.10.2 North America Aircraft Piston Engines Revenue (US$ Mn) Comparison by End Use (2021-2029)
      • 3.11 North America Aircraft Piston Engines Y-o-Y Growth Rate Comparison 2014–2029
        • 3.11.1 North America Aircraft Piston Engines Y-o-Y Growth Rate by Region
        • 3.11.2 North America Aircraft Piston Engines Market Y-o-Y Growth Rate by Product Type
        • 3.11.3 North America Aircraft Piston Engines Y-o-Y Growth Rate by End Use
      • 3.12 North America Aircraft Piston Engines Share Comparison 2014–2029
        • 3.12.1 North America Aircraft Piston Engines Share by Region
        • 3.12.2 North America Aircraft Piston Engines Market Share by Product Type
        • 3.12.3 North America Aircraft Piston Engines Share by End Use
    • Chapter 4 Europe Aircraft Piston Engines Market Overview
      • 4.1 Country Profile – Germany
        • 4.1.1 Economy Indicators of the Germany
        • 4.1.2 GDP composition by Sector, 2018
        • 4.1.3 Total Population (in ‘000s) of the Germany, 2010-2050
        • 4.1.4 Age Mix by Broader Age Groups, 2010-2050
        • 4.1.5 Population Pyramid of Germany, 2018
        • 4.1.6 Labor Force (‘000s) and Unemployment Rate (% of Labor Force)
        • 4.1.7 Unemployment Level (%) by Education
        • 4.1.8 Demographic Overview of the Germany, 2017-2018
        • 4.1.9 Current Health Expenditure (US$ Bn) and Expenditure Source (%)
        • 4.1.10 Infrastructure Profile, 2017-2018
        • 4.1.11 Ease of Doing Business Ranking, 2019
      • 4.2 Country Profile – United Kingdom
        • 4.2.1 Economy Indicators of the UK
        • 4.2.2 GDP composition by Sector, 2018
        • 4.2.3 Total Population (in ‘000s) of the UK, 2010-2050
        • 4.2.4 Age Mix by Broader Age Groups, 2010-2050
        • 4.2.5 Population Pyramid of UK, 2018
        • 4.2.6 Labor Force (‘000s) and Unemployment Rate (% of Labor Force)
        • 4.2.7 Unemployment Level (%) by Education
        • 4.2.8 Demographic Overview of the UK, 2017-2018
        • 4.2.9 Current Health Expenditure (US$ Bn) and Expenditure Source (%)
        • 4.2.10 Infrastructure Profile, 2017-2018
        • 4.2.11 Ease of Doing Business Ranking, 2019
      • 4.3 Country Profile – France
        • 4.3.1 Economy Indicators of the France
        • 4.3.2 GDP composition by Sector, 2018
        • 4.3.3 Total Population (in ‘000s) of the France, 2010-2050
        • 4.3.4 Age Mix by Broader Age Groups, 2010-2050
        • 4.3.5 Population Pyramid of France, 2018
        • 4.3.6 Labor Force (‘000s) and Unemployment Rate (% of Labor Force)
        • 4.3.7 Unemployment Level (%) by Education
        • 4.3.8 Demographic Overview of the France, 2017-2018
        • 4.3.9 Current Health Expenditure (US$ Bn) and Expenditure Source (%)
        • 4.3.10 Infrastructure Profile, 2017-2018
        • 4.3.11 Ease of Doing Business Ranking, 2019
      • 4.4 Country Profile – Italy
        • 4.4.1 Economy Indicators of the Italy
        • 4.4.2 GDP composition by Sector, 2018
        • 4.4.3 Total Population (in ‘000s) of the Italy, 2010-2050
        • 4.4.4 Age Mix by Broader Age Groups, 2010-2050
        • 4.4.5 Population Pyramid of Italy, 2018
        • 4.4.6 Labor Force (‘000s) and Unemployment Rate (% of Labor Force)
        • 4.4.7 Unemployment Level (%) by Education
        • 4.4.8 Demographic Overview of the Italy, 2017-2018
        • 4.4.9 Current Health Expenditure (US$ Bn) and Expenditure Source (%)
        • 4.4.10 Infrastructure Profile, 2017-2018
        • 4.4.11 Ease of Doing Business Ranking, 2019
      • 4.5 Country Profile – Russia
        • 4.5.1 Economy Indicators of the Russia
        • 4.5.2 GDP composition by Sector, 2018
        • 4.5.3 Total Population (in ‘000s) of the Russia, 2010-2050
        • 4.5.4 Age Mix by Broader Age Groups, 2010-2050
        • 4.5.5 Population Pyramid of Russia, 2018
        • 4.5.6 Labor Force (‘000s) and Unemployment Rate (% of Labor Force)
        • 4.5.7 Unemployment Level (%) by Education
        • 4.5.8 Demographic Overview of the Russia, 2017-2018
        • 4.5.9 Current Health Expenditure (US$ Bn) and Expenditure Source (%)
        • 4.5.10 Infrastructure Profile, 2017-2018
        • 4.5.11 Ease of Doing Business Ranking, 2019
      • 4.6 Country Profile – Spain
        • 4.6.1 Economy Indicators of the Spain
        • 4.6.2 GDP composition by Sector, 2018
        • 4.6.3 Total Population (in ‘000s) of the Spain, 2010-2050
        • 4.6.4 Age Mix by Broader Age Groups, 2010-2050
        • 4.6.5 Population Pyramid of Spain, 2018
        • 4.6.6 Labor Force (‘000s) and Unemployment Rate (% of Labor Force)
        • 4.6.7 Unemployment Level (%) by Education
        • 4.6.8 Demographic Overview of the Spain, 2017-2018
        • 4.6.9 Current Health Expenditure (US$ Bn) and Expenditure Source (%)
        • 4.6.10 Infrastructure Profile, 2017-2018
        • 4.6.11 Ease of Doing Business Ranking, 2019
      • 4.7 Europe Aircraft Piston Engines Market by Product Type
        • 4.7.1 Europe Aircraft Piston Engines Revenue (US$ Mn) Comparison by Product Type (2013-2029)
        • 4.7.2 Europe Aircraft Piston Engines Revenue (US$ Mn) Market Share by Product Type in 2019
        • 4.7.3 Europe Aircraft Piston Engines Market Attractiveness Analysis by Product Type, 2013–2019
      • 4.8 Europe Aircraft Piston Engines Market by End Use
        • 4.8.1 Europe Aircraft Piston Engines Revenue (US$ Mn) Comparison by End Use (2013-2029)
        • 4.8.2 Europe Aircraft Piston Engines Revenue (US$ Mn) Market Share by End Use in 2019
        • 4.8.3 Europe Aircraft Piston Engines Market Attractiveness Analysis by End Use, 2013–2019
      • 4.9 Europe Aircraft Piston Engines Market Outlook by Region
        • 4.9.1 Europe Aircraft Piston Engines Revenue (US$ Mn) Comparison by Region (2013-2029)
        • 4.9.2 Europe Aircraft Piston Engines Revenue (US$ Mn) Market Share by Region in 2018
        • 4.9.3 Europe Aircraft Piston Engines Market Attractiveness Analysis by Region, 2012–2018
      • 4.10 Europe Aircraft Piston Engines Market Outlook (2013-2029)
        • 4.10.1 Europe Aircraft Piston Engines Revenue (US$ Mn) (2013-2020)
        • 4.10.2 Europe Aircraft Piston Engines Revenue (US$ Mn) (2021-2029)
      • 4.11 Europe Aircraft Piston Engines Revenue (US$ Mn) by Regions
        • 4.11.1 Europe Aircraft Piston Engines Revenue (US$ Mn) Comparison by Region (2013-2020)
        • 4.11.2 Europe Aircraft Piston Engines Revenue (US$ Mn) Comparison by Region (2021-2029)
      • 4.12 Europe Aircraft Piston Engines Revenue (US$ Mn) by Product Type
        • 4.12.1 Europe Aircraft Piston Engines Revenue (US$ Mn) Comparison by Product Type (2013-2020)
        • 4.12.2 Europe Aircraft Piston Engines Revenue (US$ Mn) Comparison by Product Type (2021-2029)
      • 4.13 Europe Aircraft Piston Engines Revenue (US$ Mn) by End Use
        • 4.13.1 Europe Aircraft Piston Engines Revenue (US$ Mn) Comparison by End Use (2013-2020)
        • 4.13.2 Europe Aircraft Piston Engines Revenue (US$ Mn) Comparison by End Use (2021-2029)
      • 4.14 Europe Aircraft Piston Engines Y-o-Y Growth Rate Comparison 2014–2029
        • 4.14.1 Europe Aircraft Piston Engines Y-o-Y Growth Rate by Region
        • 4.14.2 Europe Aircraft Piston Engines Market Y-o-Y Growth Rate by Product Type
        • 4.14.3 Europe Aircraft Piston Engines Y-o-Y Growth Rate by End Use
      • 4.15 Europe Aircraft Piston Engines Share Comparison 2014–2029
        • 4.15.1 Europe Aircraft Piston Engines Share by Region
        • 4.15.2 Europe Aircraft Piston Engines Market Share by Product Type
        • 4.15.3 Europe Aircraft Piston Engines Share by End Use
    • Chapter 5 APAC Aircraft Piston Engines Market Overview
      • 5.1 Country Profile – China
        • 5.1.1 Economy Indicators of the China
        • 5.1.2 GDP composition by Sector, 2018
        • 5.1.3 Total Population (in ‘000s) of the China, 2010-2050
        • 5.1.4 Age Mix by Broader Age Groups, 2010-2050
        • 5.1.5 Population Pyramid of China, 2018
        • 5.1.6 Labor Force (‘000s) and Unemployment Rate (% of Labor Force)
        • 5.1.7 Unemployment Level (%) by Education
        • 5.1.8 Demographic Overview of the China, 2017-2018
        • 5.1.9 Current Health Expenditure (US$ Bn) and Expenditure Source (%)
        • 5.1.10 Infrastructure Profile, 2017-2018
        • 5.1.11 Ease of Doing Business Ranking, 2019
      • 5.2 Country Profile – Japan
        • 5.2.1 Economy Indicators of the Japan
        • 5.2.2 GDP composition by Sector, 2018
        • 5.2.3 Total Population (in ‘000s) of the Japan, 2010-2050
        • 5.2.4 Age Mix by Broader Age Groups, 2010-2050
        • 5.2.5 Population Pyramid of Japan, 2018
        • 5.2.6 Labor Force (‘000s) and Unemployment Rate (% of Labor Force)
        • 5.2.7 Unemployment Level (%) by Education
        • 5.2.8 Demographic Overview of the Japan, 2017-2018
        • 5.2.9 Current Health Expenditure (US$ Bn) and Expenditure Source (%)
        • 5.2.10 Infrastructure Profile, 2017-2018
        • 5.2.11 Ease of Doing Business Ranking, 2019
      • 5.3 Country Profile – India
        • 5.3.1 Economy Indicators of the India
        • 5.3.2 GDP composition by Sector, 2018
        • 5.3.3 Total Population (in ‘000s) of the India, 2010-2050
        • 5.3.4 Age Mix by Broader Age Groups, 2010-2050
        • 5.3.5 Population Pyramid of India, 2018
        • 5.3.6 Labor Force (‘000s) and Unemployment Rate (% of Labor Force)
        • 5.3.7 Unemployment Level (%) by Education
        • 5.3.8 Demographic Overview of the India, 2017-2018
        • 5.3.9 Current Health Expenditure (US$ Bn) and Expenditure Source (%)
        • 5.3.10 Infrastructure Profile, 2017-2018
        • 5.3.11 Ease of Doing Business Ranking, 2019
      • 5.4 Country Profile – South Korea
        • 5.4.1 Economy Indicators of the South Korea
        • 5.4.2 GDP composition by Sector, 2018
        • 5.4.3 Total Population (in ‘000s) of the South Korea, 2010-2050
        • 5.4.4 Age Mix by Broader Age Groups, 2010-2050
        • 5.4.5 Population Pyramid of South Korea, 2018
        • 5.4.6 Labor Force (‘000s) and Unemployment Rate (% of Labor Force)
        • 5.4.7 Unemployment Level (%) by Education
        • 5.4.8 Demographic Overview of the South Korea, 2017-2018
        • 5.4.9 Current Health Expenditure (US$ Bn) and Expenditure Source (%)
        • 5.4.10 Infrastructure Profile, 2017-2018
        • 5.4.11 Ease of Doing Business Ranking, 2019
      • 5.5 APAC Aircraft Piston Engines Market by Product Type
        • 5.5.1 APAC Aircraft Piston Engines Revenue (US$ Mn) Comparison by Product Type (2013-2029)
        • 5.5.2 APAC Aircraft Piston Engines Revenue (US$ Mn) Market Share by Product Type in 2019
        • 5.5.3 APAC Aircraft Piston Engines Market Attractiveness Analysis by Product Type, 2013–2019
      • 5.6 APAC Aircraft Piston Engines Market by End Use
        • 5.6.1 APAC Aircraft Piston Engines Revenue (US$ Mn) Comparison by End Use (2013-2029)
        • 5.6.2 APAC Aircraft Piston Engines Revenue (US$ Mn) Market Share by End Use in 2019
        • 5.6.3 APAC Aircraft Piston Engines Market Attractiveness Analysis by End Use, 2013–2019
      • 5.7 APAC Aircraft Piston Engines Market Outlook by Region
        • 5.7.1 APAC Aircraft Piston Engines Revenue (US$ Mn) Comparison by Region (2013-2029)
        • 5.7.2 APAC Aircraft Piston Engines Revenue (US$ Mn) Market Share by Region in 2018
        • 5.7.3 APAC Aircraft Piston Engines Market Attractiveness Analysis by Region, 2012–2018
      • 5.8 APAC Aircraft Piston Engines Market Outlook (2013-2029)
        • 5.8.1 APAC Aircraft Piston Engines Revenue (US$ Mn) (2013-2020)
        • 5.8.2 APAC Aircraft Piston Engines Revenue (US$ Mn) (2021-2029)
      • 5.9 APAC Aircraft Piston Engines Revenue (US$ Mn) by Regions
        • 5.9.1 APAC Aircraft Piston Engines Revenue (US$ Mn) Comparison by Region (2013-2020)
        • 5.9.2 APAC Aircraft Piston Engines Revenue (US$ Mn) Comparison by Region (2021-2029)
      • 5.10 APAC Aircraft Piston Engines Revenue (US$ Mn) by Product Type
        • 5.10.1 APAC Aircraft Piston Engines Revenue (US$ Mn) Comparison by Product Type (2013-2020)
        • 5.10.2 APAC Aircraft Piston Engines Revenue (US$ Mn) Comparison by Product Type (2021-2029)
      • 5.11 APAC Aircraft Piston Engines Revenue (US$ Mn) by End Use
        • 5.11.1 APAC Aircraft Piston Engines Revenue (US$ Mn) Comparison by End Use (2013-2020)
        • 5.11.2 APAC Aircraft Piston Engines Revenue (US$ Mn) Comparison by End Use (2021-2029)
      • 5.12 APAC Aircraft Piston Engines Y-o-Y Growth Rate Comparison 2014–2029
        • 5.12.1 APAC Aircraft Piston Engines Y-o-Y Growth Rate by Region
        • 5.12.2 APAC Aircraft Piston Engines Market Y-o-Y Growth Rate by Product Type
        • 5.12.3 APAC Aircraft Piston Engines Y-o-Y Growth Rate by End Use
      • 5.13 APAC Aircraft Piston Engines Share Comparison 2014–2029
        • 5.13.1 APAC Aircraft Piston Engines Share by Region
        • 5.13.2 APAC Aircraft Piston Engines Market Share by Product Type
        • 5.13.3 APAC Aircraft Piston Engines Share by End Use
    • Chapter 6 South America Aircraft Piston Engines Market Overview
      • 6.1 Country Profile – Brazil
        • 6.1.1 Economy Indicators of the Brazil
        • 6.1.2 GDP composition by Sector, 2018
        • 6.1.3 Total Population (in ‘000s) of the Brazil, 2010-2050
        • 6.1.4 Age Mix by Broader Age Groups, 2010-2050
        • 6.1.5 Population Pyramid of Brazil, 2018
        • 6.1.6 Labor Force (‘000s) and Unemployment Rate (% of Labor Force)
        • 6.1.7 Unemployment Level (%) by Education
        • 6.1.8 Demographic Overview of the Brazil, 2017-2018
        • 6.1.9 Current Health Expenditure (US$ Bn) and Expenditure Source (%)
        • 6.1.10 Infrastructure Profile, 2017-2018
        • 6.1.11 Ease of Doing Business Ranking, 2019
      • 6.2 Country Profile – Argentina
        • 6.2.1 Economy Indicators of the Argentina
        • 6.2.2 GDP composition by Sector, 2018
        • 6.2.3 Total Population (in ‘000s) of the Argentina, 2010-2050
        • 6.2.4 Age Mix by Broader Age Groups, 2010-2050
        • 6.2.5 Population Pyramid of Argentina, 2018
        • 6.2.6 Labor Force (‘000s) and Unemployment Rate (% of Labor Force)
        • 6.2.7 Unemployment Level (%) by Education
        • 6.2.8 Demographic Overview of the Argentina, 2017-2018
        • 6.2.9 Current Health Expenditure (US$ Bn) and Expenditure Source (%)
        • 6.2.10 Infrastructure Profile, 2017-2018
        • 6.2.11 Ease of Doing Business Ranking, 2019
      • 6.3 Country Profile – Colombia
        • 6.3.1 Economy Indicators of the Colombia
        • 6.3.2 GDP composition by Sector, 2018
        • 6.3.3 Total Population (in ‘000s) of the Colombia, 2010-2050
        • 6.3.4 Age Mix by Broader Age Groups, 2010-2050
        • 6.3.5 Population Pyramid of Colombia, 2018
        • 6.3.6 Labor Force (‘000s) and Unemployment Rate (% of Labor Force)
        • 6.3.7 Unemployment Level (%) by Education
        • 6.3.8 Demographic Overview of the Colombia, 2017-2018
        • 6.3.9 Current Health Expenditure (US$ Bn) and Expenditure Source (%)
        • 6.3.10 Infrastructure Profile, 2017-2018
        • 6.3.11 Ease of Doing Business Ranking, 2019
      • 6.4 South America Aircraft Piston Engines Market by Product Type
        • 6.4.1 South America Aircraft Piston Engines Revenue (US$ Mn) Comparison by Product Type (2013-2029)
        • 6.4.2 South America Aircraft Piston Engines Revenue (US$ Mn) Market Share by Product Type in 2019
        • 6.4.3 South America Aircraft Piston Engines Market Attractiveness Analysis by Product Type, 2013–2019
      • 6.5 South America Aircraft Piston Engines Market by End Use
        • 6.5.1 South America Aircraft Piston Engines Revenue (US$ Mn) Comparison by End Use (2013-2029)
        • 6.5.2 South America Aircraft Piston Engines Revenue (US$ Mn) Market Share by End Use in 2019
        • 6.5.3 South America Aircraft Piston Engines Market Attractiveness Analysis by End Use, 2013–2019
      • 6.6 South America Aircraft Piston Engines Market Outlook by Region
        • 6.6.1 South America Aircraft Piston Engines Revenue (US$ Mn) Comparison by Region (2013-2029)
        • 6.6.2 South America Aircraft Piston Engines Revenue (US$ Mn) Market Share by Region in 2018
        • 6.6.3 South America Aircraft Piston Engines Market Attractiveness Analysis by Region, 2012–2018
      • 6.7 South America Aircraft Piston Engines Market Outlook (2013-2029)
        • 6.7.1 South America Aircraft Piston Engines Revenue (US$ Mn) (2013-2020)
        • 6.7.2 South America Aircraft Piston Engines Revenue (US$ Mn) (2021-2029)
      • 6.8 South America Aircraft Piston Engines Revenue (US$ Mn) by Regions
        • 6.8.1 South America Aircraft Piston Engines Revenue (US$ Mn) Comparison by Region (2013-2020)
        • 6.8.2 South America Aircraft Piston Engines Revenue (US$ Mn) Comparison by Region (2021-2029)
      • 6.9 South America Aircraft Piston Engines Revenue (US$ Mn) by Product Type
        • 6.9.1 South America Aircraft Piston Engines Revenue (US$ Mn) Comparison by Product Type (2013-2020)
        • 6.9.2 South America Aircraft Piston Engines Revenue (US$ Mn) Comparison by Product Type (2021-2029)
      • 6.10 South America Aircraft Piston Engines Revenue (US$ Mn) by End Use
        • 6.10.1 South America Aircraft Piston Engines Revenue (US$ Mn) Comparison by End Use (2013-2020)
        • 6.10.2 South America Aircraft Piston Engines Revenue (US$ Mn) Comparison by End Use (2021-2029)
      • 6.11 South America Aircraft Piston Engines Y-o-Y Growth Rate Comparison 2014–2029
        • 6.11.1 South America Aircraft Piston Engines Y-o-Y Growth Rate by Region
        • 6.11.2 South America Aircraft Piston Engines Market Y-o-Y Growth Rate by Product Type
        • 6.11.3 South America Aircraft Piston Engines Y-o-Y Growth Rate by End Use
      • 6.12 South America Aircraft Piston Engines Share Comparison 2014–2029
        • 6.12.1 South America Aircraft Piston Engines Share by Region
        • 6.12.2 South America Aircraft Piston Engines Market Share by Product Type
        • 6.12.3 South America Aircraft Piston Engines Share by End Use
    • Chapter 7 MEA Aircraft Piston Engines Market Overview
      • 7.1 Country Profile – Saudi Arabia
        • 7.1.1 Economy Indicators of the Saudi Arabia
        • 7.1.2 GDP composition by Sector, 2018
        • 7.1.3 Total Population (in ‘000s) of the Saudi Arabia, 2010-2050
        • 7.1.4 Age Mix by Broader Age Groups, 2010-2050
        • 7.1.5 Population Pyramid of Saudi Arabia, 2018
        • 7.1.6 Labor Force (‘000s) and Unemployment Rate (% of Labor Force)
        • 7.1.7 Unemployment Level (%) by Education
        • 7.1.8 Demographic Overview of the Saudi Arabia, 2017-2018
        • 7.1.9 Current Health Expenditure (US$ Bn) and Expenditure Source (%)
        • 7.1.10 Infrastructure Profile, 2017-2018
        • 7.1.11 Ease of Doing Business Ranking, 2019
      • 7.2 Country Profile – UAE
        • 7.2.1 Economy Indicators of the UAE
        • 7.2.2 GDP composition by Sector, 2018
        • 7.2.3 Total Population (in ‘000s) of the UAE, 2010-2050
        • 7.2.4 Age Mix by Broader Age Groups, 2010-2050
        • 7.2.5 Population Pyramid of UAE, 2018
        • 7.2.6 Labor Force (‘000s) and Unemployment Rate (% of Labor Force)
        • 7.2.7 Unemployment Level (%) by Education
        • 7.2.8 Demographic Overview of the UAE, 2017-2018
        • 7.2.9 Current Health Expenditure (US$ Bn) and Expenditure Source (%)
        • 7.2.10 Infrastructure Profile, 2017-2018
        • 7.2.11 Ease of Doing Business Ranking, 2019
      • 7.3 Country Profile – Israel
        • 7.3.1 Economy Indicators of the Israel
        • 7.3.2 GDP composition by Sector, 2018
        • 7.3.3 Total Population (in ‘000s) of the Israel, 2010-2050
        • 7.3.4 Age Mix by Broader Age Groups, 2010-2050
        • 7.3.5 Population Pyramid of Israel, 2018
        • 7.3.6 Labor Force (‘000s) and Unemployment Rate (% of Labor Force)
        • 7.3.7 Unemployment Level (%) by Education
        • 7.3.8 Demographic Overview of the Israel, 2017-2018
        • 7.3.9 Current Health Expenditure (US$ Bn) and Expenditure Source (%)
        • 7.3.10 Infrastructure Profile, 2017-2018
        • 7.3.11 Ease of Doing Business Ranking, 2019
      • 7.4 Country Profile – South Africa
        • 7.4.1 Economy Indicators of the South Africa
        • 7.4.2 GDP composition by Sector, 2018
        • 7.4.3 Total Population (in ‘000s) of the South Africa, 2010-2050
        • 7.4.4 Age Mix by Broader Age Groups, 2010-2050
        • 7.4.5 Population Pyramid of South Africa, 2018
        • 7.4.6 Labor Force (‘000s) and Unemployment Rate (% of Labor Force)
        • 7.4.7 Unemployment Level (%) by Education
        • 7.4.8 Demographic Overview of the South Africa, 2017-2018
        • 7.4.9 Current Health Expenditure (US$ Bn) and Expenditure Source (%)
        • 7.4.10 Infrastructure Profile, 2017-2018
        • 7.4.11 Ease of Doing Business Ranking, 2019
      • 7.5 MEA Aircraft Piston Engines Market by Product Type
        • 7.5.1 MEA Aircraft Piston Engines Revenue (US$ Mn) Comparison by Product Type (2013-2029)
        • 7.5.2 MEA Aircraft Piston Engines Revenue (US$ Mn) Market Share by Product Type in 2019
        • 7.5.3 MEA Aircraft Piston Engines Market Attractiveness Analysis by Product Type, 2013–2019
      • 7.6 MEA Aircraft Piston Engines Market by End Use
        • 7.6.1 MEA Aircraft Piston Engines Revenue (US$ Mn) Comparison by End Use (2013-2029)
        • 7.6.2 MEA Aircraft Piston Engines Revenue (US$ Mn) Market Share by End Use in 2019
        • 7.6.3 MEA Aircraft Piston Engines Market Attractiveness Analysis by End Use, 2013–2019
      • 7.7 MEA Aircraft Piston Engines Market Outlook by Region
        • 7.7.1 MEA Aircraft Piston Engines Revenue (US$ Mn) Comparison by Region (2013-2029)
        • 7.7.2 MEA Aircraft Piston Engines Revenue (US$ Mn) Market Share by Region in 2018
        • 7.7.3 MEA Aircraft Piston Engines Market Attractiveness Analysis by Region, 2012–2018
      • 7.8 MEA Aircraft Piston Engines Market Outlook (2013-2029)
        • 7.8.1 MEA Aircraft Piston Engines Revenue (US$ Mn) (2013-2020)
        • 7.8.2 MEA Aircraft Piston Engines Revenue (US$ Mn) (2021-2029)
      • 7.9 MEA Aircraft Piston Engines Revenue (US$ Mn) by Regions
        • 7.9.1 MEA Aircraft Piston Engines Revenue (US$ Mn) Comparison by Region (2013-2020)
        • 7.9.2 MEA Aircraft Piston Engines Revenue (US$ Mn) Comparison by Region (2021-2029)
      • 7.10 MEA Aircraft Piston Engines Revenue (US$ Mn) by Product Type
        • 7.10.1 MEA Aircraft Piston Engines Revenue (US$ Mn) Comparison by Product Type (2013-2020)
        • 7.10.2 MEA Aircraft Piston Engines Revenue (US$ Mn) Comparison by Product Type (2021-2029)
      • 7.11 MEA Aircraft Piston Engines Revenue (US$ Mn) by End Use
        • 7.11.1 MEA Aircraft Piston Engines Revenue (US$ Mn) Comparison by End Use (2013-2020)
        • 7.11.2 MEA Aircraft Piston Engines Revenue (US$ Mn) Comparison by End Use (2021-2029)
      • 7.12 MEA Aircraft Piston Engines Y-o-Y Growth Rate Comparison 2014–2029
        • 7.12.1 MEA Aircraft Piston Engines Y-o-Y Growth Rate by Region
        • 7.12.2 MEA Aircraft Piston Engines Market Y-o-Y Growth Rate by Product Type
        • 7.12.3 MEA Aircraft Piston Engines Y-o-Y Growth Rate by End Use
      • 7.13 MEA Aircraft Piston Engines Share Comparison 2014–2029
        • 7.13.1 MEA Aircraft Piston Engines Share by Region
        • 7.13.2 MEA Aircraft Piston Engines Market Share by Product Type
        • 7.13.3 MEA Aircraft Piston Engines Share by End Use
    • Chapter 8 Global Aircraft Piston Engines Market Company Profiles
      • 8.1 Overview of Major Market Players
      • 8.2 Market Competition Scenario Analysis
      • 8.3 Company Profiles
        • 8.3.1 Textron, Inc. (Lycoming Engines)
          • 8.3.1.1 Company Overview
          • 8.3.1.2 Business Description
          • 8.3.1.3 Product Portfolio (Lycoming Engines)
          • 8.3.1.4 Key Financials
          • 8.3.1.5 Key Developments
          • 8.3.1.6 SWOT Analysis
        • 8.3.2 Aviation Industry Corporation of China (Continental Aerospace Technologies)
          • 8.3.2.1 Company Overview
          • 8.3.2.2 Business Description
          • 8.3.2.3 Product Portfolio (Continental Aerospace Technologies)
          • 8.3.2.4 Key Financials
        • 8.3.3 Austro Engines
          • 8.3.3.1 Company Overview
          • 8.3.3.2 Business Description
          • 8.3.3.3 Product Portfolio
          • 8.3.3.4 Key Developments
        • 8.3.4 BRP Inc.
          • 8.3.4.1 Company Overview
          • 8.3.4.2 Business Description
          • 8.3.4.3 Product Portfolio (Rotax Aircraft Engines)
          • 8.3.4.4 Key Financials
        • 8.3.5 Safran (SMA Technologies)
          • 8.3.5.1 Company Overview
          • 8.3.5.2 Business Description
          • 8.3.5.3 Product Portfolio (SMA Technologies)
          • 8.3.5.4 Key Financials
          • 8.3.5.5 Key Developments
          • 8.3.5.6 SWOT Analysis
        • 8.3.6 Jabiru Aircraft Pty Ltd
          • 8.3.6.1 Company Overview
          • 8.3.6.2 Business Description
          • 8.3.6.3 Product Portfolio
          • 8.3.6.4 Key Developments
        • 8.3.7 Limbach Flugmotoren GmbH
          • 8.3.7.1 Company Overview
          • 8.3.7.2 Business Description
          • 8.3.7.3 Product Portfolio
        • 8.3.8 Saab AB (Hirth Engines)
          • 8.3.8.1 Company Overview
          • 8.3.8.2 Business Description
          • 8.3.8.3 Product Portfolio (Hirth Engines)
          • 8.3.8.4 Key Financials
          • 8.3.8.5 Key Developments
          • 8.3.8.6 SWOT Analysis
        • 8.3.9 ULPower Aero Engines
          • 8.3.9.1 Company Overview
          • 8.3.9.2 Business Description
          • 8.3.9.3 Product Portfolio
          • 8.3.9.4 Key Developments
        • 8.3.10 SKY Engines
          • 8.3.10.1 Company Overview
          • 8.3.10.2 Business Description
          • 8.3.10.3 Product Portfolio
    • Chapter 9 Methodology and Research Approach
      • 9.1 Methodology/Research Approach
        • 9.1.1 Market Size Estimation
      • 9.2 Market Breakdown and Data Triangulation
      • 9.3 Data Source
        • 9.3.1 Secondary Sources
        • 9.3.2 Primary Sources

    • List of Figures
      • FIG. 1 Global Aircraft Piston Engines Revenue (US$ Mn) Market Share by Product Type in 2019
      • FIG. 2 Global Aircraft Piston Engines Market Attractiveness Analysis by Product Type, 2013–2019
      • FIG. 3 Global Aircraft Piston Engines Revenue (US$ Mn) Market Share by End Use in 2019
      • FIG. 4 Global Aircraft Piston Engines Market Attractiveness Analysis by End Use, 2013–2019
      • FIG. 5 Global Aircraft Piston Engines Revenue (US$ Mn) Market Share by Region in 2018
      • FIG. 6 Global Aircraft Piston Engines Market Attractiveness Analysis by Region, 2012–2018
      • FIG. 7 Global Aircraft Piston Engines Market Revenue (US$ Mn) (2013-2020)
      • FIG. 8 Global Aircraft Piston Engines Market Revenue (US$ Mn) (2021-2029)
      • FIG. 9 Global Aircraft Piston Engines Market Revenue (US$ Mn) Comparison by Region (2013-2020)
      • FIG. 10 Global Aircraft Piston Engines Market Revenue (US$ Mn) Comparison by Region (2021-2029)
      • FIG. 11 Global Aircraft Piston Engines Market Revenue (US$ Mn) Comparison by Product Type (2013-2020)
      • FIG. 12 Global Aircraft Piston Engines Market Revenue (US$ Mn) Comparison by Product Type (2021-2029)
      • FIG. 13 Global Aircraft Piston Engines Market Revenue (US$ Mn) Comparison by End Use (2013-2020)
      • FIG. 14 Global Aircraft Piston Engines Market Revenue (US$ Mn) Comparison by End Use (2021-2029)
      • FIG. 15 Global Aircraft Piston Engines Market Y-o-Y Growth Rate Comparison by Region (2014-2020)
      • FIG. 16 Global Aircraft Piston Engines Market Y-o-Y Growth Rate Comparison by Region (2021-2029)
      • FIG. 17 Global Aircraft Piston Engines Market Y-o-Y Growth Rate Comparison by Product Type (2014-2020)
      • FIG. 18 Global Aircraft Piston Engines Market Y-o-Y Growth Rate Comparison by Product Type (2021-2029)
      • FIG. 19 Global Aircraft Piston Engines Market Y-o-Y Growth Rate Comparison by End Use (2014-2020)
      • FIG. 20 Global Aircraft Piston Engines Market Y-o-Y Growth Rate Comparison by End Use (2021-2029)
      • FIG. 21 Global Aircraft Piston Engines Market Share Comparison by Region (2013-2020)
      • FIG. 22 Global Aircraft Piston Engines Market Share Comparison by Region (2021-2029)
      • FIG. 23 Global Aircraft Piston Engines Market Share Comparison by Product Type (2013-2020)
      • FIG. 24 Global Aircraft Piston Engines Market Share Comparison by Product Type (2021-2029)
      • FIG. 25 Global Aircraft Piston Engines Market Share Comparison by End Use (2013-2020)
      • FIG. 26 Global Aircraft Piston Engines Market Share Comparison by End Use (2021-2029)
      • FIG. 27 North America Aircraft Piston Engines Revenue (US$ Mn) Market Share by Product Type in 2019
      • FIG. 28 North America Aircraft Piston Engines Market Attractiveness Analysis by Product Type, 2013–2019
      • FIG. 29 North America Aircraft Piston Engines Revenue (US$ Mn) Market Share by End Use in 2019
      • FIG. 30 North America Aircraft Piston Engines Market Attractiveness Analysis by End Use, 2013–2019
      • FIG. 31 North America Aircraft Piston Engines Revenue (US$ Mn) Market Share by Region in 2018
      • FIG. 32 North America Aircraft Piston Engines Market Attractiveness Analysis by Region, 2012–2018
      • FIG. 33 North America Aircraft Piston Engines Market Revenue (US$ Mn) (2013-2020)
      • FIG. 34 North America Aircraft Piston Engines Market Revenue (US$ Mn) (2021-2029)
      • FIG. 35 North America Aircraft Piston Engines Market Revenue (US$ Mn) Comparison by Region (2013-2020)
      • FIG. 36 North America Aircraft Piston Engines Market Revenue (US$ Mn) Comparison by Region (2021-2029)
      • FIG. 37 North America Aircraft Piston Engines Market Revenue (US$ Mn) Comparison by Product Type (2013-2020)
      • FIG. 38 North America Aircraft Piston Engines Market Revenue (US$ Mn) Comparison by Product Type (2021-2029)
      • FIG. 39 North America Aircraft Piston Engines Market Revenue (US$ Mn) Comparison by End Use (2013-2020)
      • FIG. 40 North America Aircraft Piston Engines Market Revenue (US$ Mn) Comparison by End Use (2021-2029)
      • FIG. 41 North America Aircraft Piston Engines Market Y-o-Y Growth Rate Comparison by Region (2014-2020)
      • FIG. 42 North America Aircraft Piston Engines Market Y-o-Y Growth Rate Comparison by Region (2021-2029)
      • FIG. 43 North America Aircraft Piston Engines Market Y-o-Y Growth Rate Comparison by Product Type (2014-2020)
      • FIG. 44 North America Aircraft Piston Engines Market Y-o-Y Growth Rate Comparison by Product Type (2021-2029)
      • FIG. 45 North America Aircraft Piston Engines Market Y-o-Y Growth Rate Comparison by End Use (2014-2020)
      • FIG. 46 North America Aircraft Piston Engines Market Y-o-Y Growth Rate Comparison by End Use (2021-2029)
      • FIG. 47 North America Aircraft Piston Engines Market Share Comparison by Region (2013-2020)
      • FIG. 48 North America Aircraft Piston Engines Market Share Comparison by Region (2021-2029)
      • FIG. 49 North America Aircraft Piston Engines Market Share Comparison by Product Type (2013-2020)
      • FIG. 50 North America Aircraft Piston Engines Market Share Comparison by Product Type (2021-2029)
      • FIG. 51 North America Aircraft Piston Engines Market Share Comparison by End Use (2013-2020)
      • FIG. 52 North America Aircraft Piston Engines Market Share Comparison by End Use (2021-2029)
      • FIG. 53 Europe Aircraft Piston Engines Revenue (US$ Mn) Market Share by Product Type in 2019
      • FIG. 54 Europe Aircraft Piston Engines Market Attractiveness Analysis by Product Type, 2013–2019
      • FIG. 55 Europe Aircraft Piston Engines Revenue (US$ Mn) Market Share by End Use in 2019
      • FIG. 56 Europe Aircraft Piston Engines Market Attractiveness Analysis by End Use, 2013–2019
      • FIG. 57 Europe Aircraft Piston Engines Revenue (US$ Mn) Market Share by Region in 2018
      • FIG. 58 Europe Aircraft Piston Engines Market Attractiveness Analysis by Region, 2012–2018
      • FIG. 59 Europe Aircraft Piston Engines Market Revenue (US$ Mn) (2013-2020)
      • FIG. 60 Europe Aircraft Piston Engines Market Revenue (US$ Mn) (2021-2029)
      • FIG. 61 Europe Aircraft Piston Engines Market Revenue (US$ Mn) Comparison by Region (2013-2020)
      • FIG. 62 Europe Aircraft Piston Engines Market Revenue (US$ Mn) Comparison by Region (2021-2029)
      • FIG. 63 Europe Aircraft Piston Engines Market Revenue (US$ Mn) Comparison by Product Type (2013-2020)
      • FIG. 64 Europe Aircraft Piston Engines Market Revenue (US$ Mn) Comparison by Product Type (2021-2029)
      • FIG. 65 Europe Aircraft Piston Engines Market Revenue (US$ Mn) Comparison by End Use (2013-2020)
      • FIG. 66 Europe Aircraft Piston Engines Market Revenue (US$ Mn) Comparison by End Use (2021-2029)
      • FIG. 67 Europe Aircraft Piston Engines Market Y-o-Y Growth Rate Comparison by Region (2014-2020)
      • FIG. 68 Europe Aircraft Piston Engines Market Y-o-Y Growth Rate Comparison by Region (2021-2029)
      • FIG. 69 Europe Aircraft Piston Engines Market Y-o-Y Growth Rate Comparison by Product Type (2014-2020)
      • FIG. 70 Europe Aircraft Piston Engines Market Y-o-Y Growth Rate Comparison by Product Type (2021-2029)
      • FIG. 71 Europe Aircraft Piston Engines Market Y-o-Y Growth Rate Comparison by End Use (2014-2020)
      • FIG. 72 Europe Aircraft Piston Engines Market Y-o-Y Growth Rate Comparison by End Use (2021-2029)
      • FIG. 73 Europe Aircraft Piston Engines Market Share Comparison by Region (2013-2020)
      • FIG. 74 Europe Aircraft Piston Engines Market Share Comparison by Region (2021-2029)
      • FIG. 75 Europe Aircraft Piston Engines Market Share Comparison by Product Type (2013-2020)
      • FIG. 76 Europe Aircraft Piston Engines Market Share Comparison by Product Type (2021-2029)
      • FIG. 77 Europe Aircraft Piston Engines Market Share Comparison by End Use (2013-2020)
      • FIG. 78 Europe Aircraft Piston Engines Market Share Comparison by End Use (2021-2029)
      • FIG. 79 APAC Aircraft Piston Engines Revenue (US$ Mn) Market Share by Product Type in 2019
      • FIG. 80 APAC Aircraft Piston Engines Market Attractiveness Analysis by Product Type, 2013–2019
      • FIG. 81 APAC Aircraft Piston Engines Revenue (US$ Mn) Market Share by End Use in 2019
      • FIG. 82 APAC Aircraft Piston Engines Market Attractiveness Analysis by End Use, 2013–2019
      • FIG. 83 APAC Aircraft Piston Engines Revenue (US$ Mn) Market Share by Region in 2018
      • FIG. 84 APAC Aircraft Piston Engines Market Attractiveness Analysis by Region, 2012–2018
      • FIG. 85 APAC Aircraft Piston Engines Market Revenue (US$ Mn) (2013-2020)
      • FIG. 86 APAC Aircraft Piston Engines Market Revenue (US$ Mn) (2021-2029)
      • FIG. 87 APAC Aircraft Piston Engines Market Revenue (US$ Mn) Comparison by Region (2013-2020)
      • FIG. 88 APAC Aircraft Piston Engines Market Revenue (US$ Mn) Comparison by Region (2021-2029)
      • FIG. 89 APAC Aircraft Piston Engines Market Revenue (US$ Mn) Comparison by Product Type (2013-2020)
      • FIG. 90 APAC Aircraft Piston Engines Market Revenue (US$ Mn) Comparison by Product Type (2021-2029)
      • FIG. 91 APAC Aircraft Piston Engines Market Revenue (US$ Mn) Comparison by End Use (2013-2020)
      • FIG. 92 APAC Aircraft Piston Engines Market Revenue (US$ Mn) Comparison by End Use (2021-2029)
      • FIG. 93 APAC Aircraft Piston Engines Market Y-o-Y Growth Rate Comparison by Region (2014-2020)
      • FIG. 94 APAC Aircraft Piston Engines Market Y-o-Y Growth Rate Comparison by Region (2021-2029)
      • FIG. 95 APAC Aircraft Piston Engines Market Y-o-Y Growth Rate Comparison by Product Type (2014-2020)
      • FIG. 96 APAC Aircraft Piston Engines Market Y-o-Y Growth Rate Comparison by Product Type (2021-2029)
      • FIG. 97 APAC Aircraft Piston Engines Market Y-o-Y Growth Rate Comparison by End Use (2014-2020)
      • FIG. 98 APAC Aircraft Piston Engines Market Y-o-Y Growth Rate Comparison by End Use (2021-2029)
      • FIG. 99 APAC Aircraft Piston Engines Market Share Comparison by Region (2013-2020)
      • FIG. 100 APAC Aircraft Piston Engines Market Share Comparison by Region (2021-2029)
      • FIG. 101 APAC Aircraft Piston Engines Market Share Comparison by Product Type (2013-2020)
      • FIG. 102 APAC Aircraft Piston Engines Market Share Comparison by Product Type (2021-2029)
      • FIG. 103 APAC Aircraft Piston Engines Market Share Comparison by End Use (2013-2020)
      • FIG. 104 APAC Aircraft Piston Engines Market Share Comparison by End Use (2021-2029)
      • FIG. 105 South America Aircraft Piston Engines Revenue (US$ Mn) Market Share by Product Type in 2019
      • FIG. 106 South America Aircraft Piston Engines Market Attractiveness Analysis by Product Type, 2013–2019
      • FIG. 107 South America Aircraft Piston Engines Revenue (US$ Mn) Market Share by End Use in 2019
      • FIG. 108 South America Aircraft Piston Engines Market Attractiveness Analysis by End Use, 2013–2019
      • FIG. 109 South America Aircraft Piston Engines Revenue (US$ Mn) Market Share by Region in 2018
      • FIG. 110 South America Aircraft Piston Engines Market Attractiveness Analysis by Region, 2012–2018
      • FIG. 111 South America Aircraft Piston Engines Market Revenue (US$ Mn) (2013-2020)
      • FIG. 112 South America Aircraft Piston Engines Market Revenue (US$ Mn) (2021-2029)
      • FIG. 113 South America Aircraft Piston Engines Market Revenue (US$ Mn) Comparison by Region (2013-2020)
      • FIG. 114 South America Aircraft Piston Engines Market Revenue (US$ Mn) Comparison by Region (2021-2029)
      • FIG. 115 South America Aircraft Piston Engines Market Revenue (US$ Mn) Comparison by Product Type (2013-2020)
      • FIG. 116 South America Aircraft Piston Engines Market Revenue (US$ Mn) Comparison by Product Type (2021-2029)
      • FIG. 117 South America Aircraft Piston Engines Market Revenue (US$ Mn) Comparison by End Use (2013-2020)
      • FIG. 118 South America Aircraft Piston Engines Market Revenue (US$ Mn) Comparison by End Use (2021-2029)
      • FIG. 119 South America Aircraft Piston Engines Market Y-o-Y Growth Rate Comparison by Region (2014-2020)
      • FIG. 120 South America Aircraft Piston Engines Market Y-o-Y Growth Rate Comparison by Region (2021-2029)
      • FIG. 121 South America Aircraft Piston Engines Market Y-o-Y Growth Rate Comparison by Product Type (2014-2020)
      • FIG. 122 South America Aircraft Piston Engines Market Y-o-Y Growth Rate Comparison by Product Type (2021-2029)
      • FIG. 123 South America Aircraft Piston Engines Market Y-o-Y Growth Rate Comparison by End Use (2014-2020)
      • FIG. 124 South America Aircraft Piston Engines Market Y-o-Y Growth Rate Comparison by End Use (2021-2029)
      • FIG. 125 South America Aircraft Piston Engines Market Share Comparison by Region (2013-2020)
      • FIG. 126 South America Aircraft Piston Engines Market Share Comparison by Region (2021-2029)
      • FIG. 127 South America Aircraft Piston Engines Market Share Comparison by Product Type (2013-2020)
      • FIG. 128 South America Aircraft Piston Engines Market Share Comparison by Product Type (2021-2029)
      • FIG. 129 South America Aircraft Piston Engines Market Share Comparison by End Use (2013-2020)
      • FIG. 130 South America Aircraft Piston Engines Market Share Comparison by End Use (2021-2029)
      • FIG. 131 MEA Aircraft Piston Engines Revenue (US$ Mn) Market Share by Product Type in 2019
      • FIG. 132 MEA Aircraft Piston Engines Market Attractiveness Analysis by Product Type, 2013–2019
      • FIG. 133 MEA Aircraft Piston Engines Revenue (US$ Mn) Market Share by End Use in 2019
      • FIG. 134 MEA Aircraft Piston Engines Market Attractiveness Analysis by End Use, 2013–2019
      • FIG. 135 MEA Aircraft Piston Engines Revenue (US$ Mn) Market Share by Region in 2018
      • FIG. 136 MEA Aircraft Piston Engines Market Attractiveness Analysis by Region, 2012–2018
      • FIG. 137 MEA Aircraft Piston Engines Market Revenue (US$ Mn) (2013-2020)
      • FIG. 138 MEA Aircraft Piston Engines Market Revenue (US$ Mn) (2021-2029)
      • FIG. 139 MEA Aircraft Piston Engines Market Revenue (US$ Mn) Comparison by Region (2013-2020)
      • FIG. 140 MEA Aircraft Piston Engines Market Revenue (US$ Mn) Comparison by Region (2021-2029)
      • FIG. 141 MEA Aircraft Piston Engines Market Revenue (US$ Mn) Comparison by Product Type (2013-2020)
      • FIG. 142 MEA Aircraft Piston Engines Market Revenue (US$ Mn) Comparison by Product Type (2021-2029)
      • FIG. 143 MEA Aircraft Piston Engines Market Revenue (US$ Mn) Comparison by End Use (2013-2020)
      • FIG. 144 MEA Aircraft Piston Engines Market Revenue (US$ Mn) Comparison by End Use (2021-2029)
      • FIG. 145 MEA Aircraft Piston Engines Market Y-o-Y Growth Rate Comparison by Region (2014-2020)
      • FIG. 146 MEA Aircraft Piston Engines Market Y-o-Y Growth Rate Comparison by Region (2021-2029)
      • FIG. 147 MEA Aircraft Piston Engines Market Y-o-Y Growth Rate Comparison by Product Type (2014-2020)
      • FIG. 148 MEA Aircraft Piston Engines Market Y-o-Y Growth Rate Comparison by Product Type (2021-2029)
      • FIG. 149 MEA Aircraft Piston Engines Market Y-o-Y Growth Rate Comparison by End Use (2014-2020)
      • FIG. 150 MEA Aircraft Piston Engines Market Y-o-Y Growth Rate Comparison by End Use (2021-2029)
      • FIG. 151 MEA Aircraft Piston Engines Market Share Comparison by Region (2013-2020)
      • FIG. 152 MEA Aircraft Piston Engines Market Share Comparison by Region (2021-2029)
      • FIG. 153 MEA Aircraft Piston Engines Market Share Comparison by Product Type (2013-2020)
      • FIG. 154 MEA Aircraft Piston Engines Market Share Comparison by Product Type (2021-2029)
      • FIG. 155 MEA Aircraft Piston Engines Market Share Comparison by End Use (2013-2020)
      • FIG. 156 MEA Aircraft Piston Engines Market Share Comparison by End Use (2021-2029)

    • List of Tables
      • TABLE 1 Global Aircraft Piston Engines Market Comparison by Product Type (2013-2029)
      • TABLE 2 Global Aircraft Piston Engines Market Comparison by End Use (2013-2029)
      • TABLE 3 Global Aircraft Piston Engines Revenue (US$ Mn) Comparison by Region (2013-2029)
      • TABLE 4 Global Aircraft Piston Engines Market Revenue (US$ Mn) (2013-2020)
      • TABLE 5 Global Aircraft Piston Engines Market Revenue (US$ Mn) (2021-2029)
      • TABLE 6 Global Aircraft Piston Engines Market Revenue (US$ Mn) Comparison by Region (2013-2020)
      • TABLE 7 Global Aircraft Piston Engines Market Revenue (US$ Mn) Comparison by Region (2021-2029)
      • TABLE 8 Global Aircraft Piston Engines Market Revenue (US$ Mn) Comparison by Product Type (2013-2020)
      • TABLE 9 Global Aircraft Piston Engines Market Revenue (US$ Mn) Comparison by Product Type (2021-2029)
      • TABLE 10 Global Aircraft Piston Engines Market Revenue (US$ Mn) Comparison by End Use (2013-2020)
      • TABLE 11 Global Aircraft Piston Engines Market Revenue (US$ Mn) Comparison by End Use (2021-2029)
      • TABLE 12 Global Aircraft Piston Engines Market Y-o-Y Growth Rate Comparison by Region (2014-2020)
      • TABLE 13 Global Aircraft Piston Engines Market Y-o-Y Growth Rate Comparison by Region (2021-2029)
      • TABLE 14 Global Aircraft Piston Engines Market Y-o-Y Growth Rate Comparison by Product Type (2014-2020)
      • TABLE 15 Global Aircraft Piston Engines Market Y-o-Y Growth Rate Comparison by Product Type (2021-2029)
      • TABLE 16 Global Aircraft Piston Engines Market Y-o-Y Growth Rate Comparison by End Use (2014-2020)
      • TABLE 17 Global Aircraft Piston Engines Market Y-o-Y Growth Rate Comparison by End Use (2021-2029)
      • TABLE 18 Global Aircraft Piston Engines Market Share Comparison by Region (2013-2020)
      • TABLE 19 Global Aircraft Piston Engines Market Share Comparison by Region (2021-2029)
      • TABLE 20 Global Aircraft Piston Engines Market Share Comparison by Product Type (2013-2020)
      • TABLE 21 Global Aircraft Piston Engines Market Share Comparison by Product Type (2021-2029)
      • TABLE 22 Global Aircraft Piston Engines Market Share Comparison by End Use (2013-2020)
      • TABLE 23 Global Aircraft Piston Engines Market Share Comparison by End Use (2021-2029)
      • TABLE 24 Economic Indicators of the US, 2012-2017
      • TABLE 25 Economic Indicators of the US, 2018-2023
      • TABLE 26 Demographic Overview of the US
      • TABLE 27 Infrastructure Profile
      • TABLE 28 Ease of Doing Business Ranking, 2019
      • TABLE 29 Economic Indicators of Canada, 2012-2017
      • TABLE 30 Economic Indicators of Canada, 2018-2023
      • TABLE 31 Demographic Overview of Canada
      • TABLE 32 Infrastructure Profile
      • TABLE 33 Ease of Doing Business Ranking, 2019
      • TABLE 34 Economic Indicators of Mexico, 2012-2017
      • TABLE 35 Economic Indicators of Mexico, 2018-2023
      • TABLE 36 Demographic Overview of Mexico
      • TABLE 37 Infrastructure Profile
      • TABLE 38 Ease of Doing Business Ranking, 2019
      • TABLE 39 North America Aircraft Piston Engines Market Comparison by Product Type (2013-2029)
      • TABLE 40 North America Aircraft Piston Engines Market Comparison by End Use (2013-2029)
      • TABLE 41 North America Aircraft Piston Engines Revenue (US$ Mn) Comparison by Region (2013-2029)
      • TABLE 42 North America Aircraft Piston Engines Market Revenue (US$ Mn) (2013-2020)
      • TABLE 43 North America Aircraft Piston Engines Market Revenue (US$ Mn) (2021-2029)
      • TABLE 44 North America Aircraft Piston Engines Market Revenue (US$ Mn) Comparison by Region (2013-2020)
      • TABLE 45 North America Aircraft Piston Engines Market Revenue (US$ Mn) Comparison by Region (2021-2029)
      • TABLE 46 North America Aircraft Piston Engines Market Revenue (US$ Mn) Comparison by Product Type (2013-2020)
      • TABLE 47 North America Aircraft Piston Engines Market Revenue (US$ Mn) Comparison by Product Type (2021-2029)
      • TABLE 48 North America Aircraft Piston Engines Market Revenue (US$ Mn) Comparison by End Use (2013-2020)
      • TABLE 49 North America Aircraft Piston Engines Market Revenue (US$ Mn) Comparison by End Use (2021-2029)
      • TABLE 50 North America Aircraft Piston Engines Market Y-o-Y Growth Rate Comparison by Region (2014-2020)
      • TABLE 51 North America Aircraft Piston Engines Market Y-o-Y Growth Rate Comparison by Region (2021-2029)
      • TABLE 52 North America Aircraft Piston Engines Market Y-o-Y Growth Rate Comparison by Product Type (2014-2020)
      • TABLE 53 North America Aircraft Piston Engines Market Y-o-Y Growth Rate Comparison by Product Type (2021-2029)
      • TABLE 54 North America Aircraft Piston Engines Market Y-o-Y Growth Rate Comparison by End Use (2014-2020)
      • TABLE 55 North America Aircraft Piston Engines Market Y-o-Y Growth Rate Comparison by End Use (2021-2029)
      • TABLE 56 North America Aircraft Piston Engines Market Share Comparison by Region (2013-2020)
      • TABLE 57 North America Aircraft Piston Engines Market Share Comparison by Region (2021-2029)
      • TABLE 58 North America Aircraft Piston Engines Market Share Comparison by Product Type (2013-2020)
      • TABLE 59 North America Aircraft Piston Engines Market Share Comparison by Product Type (2021-2029)
      • TABLE 60 North America Aircraft Piston Engines Market Share Comparison by End Use (2013-2020)
      • TABLE 61 North America Aircraft Piston Engines Market Share Comparison by End Use (2021-2029)
      • TABLE 62 Economic Indicators of the Germany, 2012-2017
      • TABLE 63 Economic Indicators of the Germany, 2018-2023
      • TABLE 64 Demographic Overview of the Germany
      • TABLE 65 Infrastructure Profile
      • TABLE 66 Ease of Doing Business Ranking, 2019
      • TABLE 67 Economic Indicators of the UK, 2012-2017
      • TABLE 68 Economic Indicators of the UK, 2018-2023
      • TABLE 69 Demographic Overview of the UK
      • TABLE 70 Infrastructure Profile
      • TABLE 71 Ease of Doing Business Ranking, 2019
      • TABLE 72 Economic Indicators of the France, 2012-2017
      • TABLE 73 Economic Indicators of the France, 2018-2023
      • TABLE 74 Demographic Overview of the France
      • TABLE 75 Infrastructure Profile
      • TABLE 76 Ease of Doing Business Ranking, 2019
      • TABLE 77 Economic Indicators of the Italy, 2012-2017
      • TABLE 78 Economic Indicators of the Italy, 2018-2023
      • TABLE 79 Demographic Overview of the Italy
      • TABLE 80 Infrastructure Profile
      • TABLE 81 Ease of Doing Business Ranking, 2019
      • TABLE 82 Economic Indicators of the Russia, 2012-2017
      • TABLE 83 Economic Indicators of the Russia, 2018-2023
      • TABLE 84 Demographic Overview of the Russia
      • TABLE 85 Infrastructure Profile
      • TABLE 86 Ease of Doing Business Ranking, 2019
      • TABLE 87 Economic Indicators of the Spain, 2012-2017
      • TABLE 88 Economic Indicators of the Spain, 2018-2023
      • TABLE 89 Demographic Overview of the Spain
      • TABLE 90 Infrastructure Profile
      • TABLE 91 Ease of Doing Business Ranking, 2019
      • TABLE 92 Europe Aircraft Piston Engines Market Comparison by Product Type (2013-2029)
      • TABLE 93 Europe Aircraft Piston Engines Market Comparison by End Use (2013-2029)
      • TABLE 94 Europe Aircraft Piston Engines Revenue (US$ Mn) Comparison by Region (2013-2029)
      • TABLE 95 Europe Aircraft Piston Engines Market Revenue (US$ Mn) (2013-2020)
      • TABLE 96 Europe Aircraft Piston Engines Market Revenue (US$ Mn) (2021-2029)
      • TABLE 97 Europe Aircraft Piston Engines Market Revenue (US$ Mn) Comparison by Region (2013-2020)
      • TABLE 98 Europe Aircraft Piston Engines Market Revenue (US$ Mn) Comparison by Region (2021-2029)
      • TABLE 99 Europe Aircraft Piston Engines Market Revenue (US$ Mn) Comparison by Product Type (2013-2020)
      • TABLE 100 Europe Aircraft Piston Engines Market Revenue (US$ Mn) Comparison by Product Type (2021-2029)
      • TABLE 101 Europe Aircraft Piston Engines Market Revenue (US$ Mn) Comparison by End Use (2013-2020)
      • TABLE 102 Europe Aircraft Piston Engines Market Revenue (US$ Mn) Comparison by End Use (2021-2029)
      • TABLE 103 Europe Aircraft Piston Engines Market Y-o-Y Growth Rate Comparison by Region (2014-2020)
      • TABLE 104 Europe Aircraft Piston Engines Market Y-o-Y Growth Rate Comparison by Region (2021-2029)
      • TABLE 105 Europe Aircraft Piston Engines Market Y-o-Y Growth Rate Comparison by Product Type (2014-2020)
      • TABLE 106 Europe Aircraft Piston Engines Market Y-o-Y Growth Rate Comparison by Product Type (2021-2029)
      • TABLE 107 Europe Aircraft Piston Engines Market Y-o-Y Growth Rate Comparison by End Use (2014-2020)
      • TABLE 108 Europe Aircraft Piston Engines Market Y-o-Y Growth Rate Comparison by End Use (2021-2029)
      • TABLE 109 Europe Aircraft Piston Engines Market Share Comparison by Region (2013-2020)
      • TABLE 110 Europe Aircraft Piston Engines Market Share Comparison by Region (2021-2029)
      • TABLE 111 Europe Aircraft Piston Engines Market Share Comparison by Product Type (2013-2020)
      • TABLE 112 Europe Aircraft Piston Engines Market Share Comparison by Product Type (2021-2029)
      • TABLE 113 Europe Aircraft Piston Engines Market Share Comparison by End Use (2013-2020)
      • TABLE 114 Europe Aircraft Piston Engines Market Share Comparison by End Use (2021-2029)
      • TABLE 115 Economic Indicators of the China, 2012-2017
      • TABLE 116 Economic Indicators of the China, 2018-2023
      • TABLE 117 Demographic Overview of the China
      • TABLE 118 Infrastructure Profile
      • TABLE 119 Ease of Doing Business Ranking, 2019
      • TABLE 120 Economic Indicators of the Japan, 2012-2017
      • TABLE 121 Economic Indicators of the Japan, 2018-2023
      • TABLE 122 Demographic Overview of the Japan
      • TABLE 123 Infrastructure Profile
      • TABLE 124 Ease of Doing Business Ranking, 2019
      • TABLE 125 Economic Indicators of the India, 2012-2017
      • TABLE 126 Economic Indicators of the India, 2018-2023
      • TABLE 127 Demographic Overview of the India
      • TABLE 128 Infrastructure Profile
      • TABLE 129 Ease of Doing Business Ranking, 2019
      • TABLE 130 Economic Indicators of the South Korea, 2012-2017
      • TABLE 131 Economic Indicators of the South Korea, 2018-2023
      • TABLE 132 Demographic Overview of the South Korea
      • TABLE 133 Infrastructure Profile
      • TABLE 134 Ease of Doing Business Ranking, 2019
      • TABLE 135 APAC Aircraft Piston Engines Market Comparison by Product Type (2013-2029)
      • TABLE 136 APAC Aircraft Piston Engines Market Comparison by End Use (2013-2029)
      • TABLE 137 APAC Aircraft Piston Engines Revenue (US$ Mn) Comparison by Region (2013-2029)
      • TABLE 138 APAC Aircraft Piston Engines Market Revenue (US$ Mn) (2013-2020)
      • TABLE 139 APAC Aircraft Piston Engines Market Revenue (US$ Mn) (2021-2029)
      • TABLE 140 APAC Aircraft Piston Engines Market Revenue (US$ Mn) Comparison by Region (2013-2020)
      • TABLE 141 APAC Aircraft Piston Engines Market Revenue (US$ Mn) Comparison by Region (2021-2029)
      • TABLE 142 APAC Aircraft Piston Engines Market Revenue (US$ Mn) Comparison by Product Type (2013-2020)
      • TABLE 143 APAC Aircraft Piston Engines Market Revenue (US$ Mn) Comparison by Product Type (2021-2029)
      • TABLE 144 APAC Aircraft Piston Engines Market Revenue (US$ Mn) Comparison by End Use (2013-2020)
      • TABLE 145 APAC Aircraft Piston Engines Market Revenue (US$ Mn) Comparison by End Use (2021-2029)
      • TABLE 146 APAC Aircraft Piston Engines Market Y-o-Y Growth Rate Comparison by Region (2014-2020)
      • TABLE 147 APAC Aircraft Piston Engines Market Y-o-Y Growth Rate Comparison by Region (2021-2029)
      • TABLE 148 APAC Aircraft Piston Engines Market Y-o-Y Growth Rate Comparison by Product Type (2014-2020)
      • TABLE 149 APAC Aircraft Piston Engines Market Y-o-Y Growth Rate Comparison by Product Type (2021-2029)
      • TABLE 150 APAC Aircraft Piston Engines Market Y-o-Y Growth Rate Comparison by End Use (2014-2020)
      • TABLE 151 APAC Aircraft Piston Engines Market Y-o-Y Growth Rate Comparison by End Use (2021-2029)
      • TABLE 152 APAC Aircraft Piston Engines Market Share Comparison by Region (2013-2020)
      • TABLE 153 APAC Aircraft Piston Engines Market Share Comparison by Region (2021-2029)
      • TABLE 154 APAC Aircraft Piston Engines Market Share Comparison by Product Type (2013-2020)
      • TABLE 155 APAC Aircraft Piston Engines Market Share Comparison by Product Type (2021-2029)
      • TABLE 156 APAC Aircraft Piston Engines Market Share Comparison by End Use (2013-2020)
      • TABLE 157 APAC Aircraft Piston Engines Market Share Comparison by End Use (2021-2029)
      • TABLE 158 Economic Indicators of the Brazil, 2012-2017
      • TABLE 159 Economic Indicators of the Brazil, 2018-2023
      • TABLE 160 Demographic Overview of the Brazil
      • TABLE 161 Infrastructure Profile
      • TABLE 162 Ease of Doing Business Ranking, 2019
      • TABLE 163 Economic Indicators of the Argentina, 2012-2017
      • TABLE 164 Economic Indicators of the Argentina, 2018-2023
      • TABLE 165 Demographic Overview of the Argentina
      • TABLE 166 Infrastructure Profile
      • TABLE 167 Ease of Doing Business Ranking, 2019
      • TABLE 168 Economic Indicators of the Colombia, 2012-2017
      • TABLE 169 Economic Indicators of the Colombia, 2018-2023
      • TABLE 170 Demographic Overview of the Colombia
      • TABLE 171 Infrastructure Profile
      • TABLE 172 Ease of Doing Business Ranking, 2019
      • TABLE 173 South America Aircraft Piston Engines Market Comparison by Product Type (2013-2029)
      • TABLE 174 South America Aircraft Piston Engines Market Comparison by End Use (2013-2029)
      • TABLE 175 South America Aircraft Piston Engines Revenue (US$ Mn) Comparison by Region (2013-2029)
      • TABLE 176 South America Aircraft Piston Engines Market Revenue (US$ Mn) (2013-2020)
      • TABLE 177 South America Aircraft Piston Engines Market Revenue (US$ Mn) (2021-2029)
      • TABLE 178 South America Aircraft Piston Engines Market Revenue (US$ Mn) Comparison by Region (2013-2020)
      • TABLE 179 South America Aircraft Piston Engines Market Revenue (US$ Mn) Comparison by Region (2021-2029)
      • TABLE 180 South America Aircraft Piston Engines Market Revenue (US$ Mn) Comparison by Product Type (2013-2020)
      • TABLE 181 South America Aircraft Piston Engines Market Revenue (US$ Mn) Comparison by Product Type (2021-2029)
      • TABLE 182 South America Aircraft Piston Engines Market Revenue (US$ Mn) Comparison by End Use (2013-2020)
      • TABLE 183 South America Aircraft Piston Engines Market Revenue (US$ Mn) Comparison by End Use (2021-2029)
      • TABLE 184 South America Aircraft Piston Engines Market Y-o-Y Growth Rate Comparison by Region (2014-2020)
      • TABLE 185 South America Aircraft Piston Engines Market Y-o-Y Growth Rate Comparison by Region (2021-2029)
      • TABLE 186 South America Aircraft Piston Engines Market Y-o-Y Growth Rate Comparison by Product Type (2014-2020)
      • TABLE 187 South America Aircraft Piston Engines Market Y-o-Y Growth Rate Comparison by Product Type (2021-2029)
      • TABLE 188 South America Aircraft Piston Engines Market Y-o-Y Growth Rate Comparison by End Use (2014-2020)
      • TABLE 189 South America Aircraft Piston Engines Market Y-o-Y Growth Rate Comparison by End Use (2021-2029)
      • TABLE 190 South America Aircraft Piston Engines Market Share Comparison by Region (2013-2020)
      • TABLE 191 South America Aircraft Piston Engines Market Share Comparison by Region (2021-2029)
      • TABLE 192 South America Aircraft Piston Engines Market Share Comparison by Product Type (2013-2020)
      • TABLE 193 South America Aircraft Piston Engines Market Share Comparison by Product Type (2021-2029)
      • TABLE 194 South America Aircraft Piston Engines Market Share Comparison by End Use (2013-2020)
      • TABLE 195 South America Aircraft Piston Engines Market Share Comparison by End Use (2021-2029)
      • TABLE 196 Economic Indicators of the Saudi Arabia, 2012-2017
      • TABLE 197 Economic Indicators of the Saudi Arabia, 2018-2023
      • TABLE 198 Demographic Overview of the Saudi Arabia
      • TABLE 199 Infrastructure Profile
      • TABLE 200 Ease of Doing Business Ranking, 2019
      • TABLE 201 Economic Indicators of the UAE, 2012-2017
      • TABLE 202 Economic Indicators of the UAE, 2018-2023
      • TABLE 203 Demographic Overview of the UAE
      • TABLE 204 Infrastructure Profile
      • TABLE 205 Ease of Doing Business Ranking, 2019
      • TABLE 206 Economic Indicators of the Israel, 2012-2017
      • TABLE 207 Economic Indicators of the Israel, 2018-2023
      • TABLE 208 Demographic Overview of the Israel
      • TABLE 209 Infrastructure Profile
      • TABLE 210 Ease of Doing Business Ranking, 2019
      • TABLE 211 Economic Indicators of the South Africa, 2012-2017
      • TABLE 212 Economic Indicators of the South Africa, 2018-2023
      • TABLE 213 Demographic Overview of the South Africa
      • TABLE 214 Infrastructure Profile
      • TABLE 215 Ease of Doing Business Ranking, 2019
      • TABLE 216 MEA Aircraft Piston Engines Market Comparison by Product Type (2013-2029)
      • TABLE 217 MEA Aircraft Piston Engines Market Comparison by End Use (2013-2029)
      • TABLE 218 MEA Aircraft Piston Engines Revenue (US$ Mn) Comparison by Region (2013-2029)
      • TABLE 219 MEA Aircraft Piston Engines Market Revenue (US$ Mn) (2013-2020)
      • TABLE 220 MEA Aircraft Piston Engines Market Revenue (US$ Mn) (2021-2029)
      • TABLE 221 MEA Aircraft Piston Engines Market Revenue (US$ Mn) Comparison by Region (2013-2020)
      • TABLE 222 MEA Aircraft Piston Engines Market Revenue (US$ Mn) Comparison by Region (2021-2029)
      • TABLE 223 MEA Aircraft Piston Engines Market Revenue (US$ Mn) Comparison by Product Type (2013-2020)
      • TABLE 224 MEA Aircraft Piston Engines Market Revenue (US$ Mn) Comparison by Product Type (2021-2029)
      • TABLE 225 MEA Aircraft Piston Engines Market Revenue (US$ Mn) Comparison by End Use (2013-2020)
      • TABLE 226 MEA Aircraft Piston Engines Market Revenue (US$ Mn) Comparison by End Use (2021-2029)
      • TABLE 227 MEA Aircraft Piston Engines Market Y-o-Y Growth Rate Comparison by Region (2014-2020)
      • TABLE 228 MEA Aircraft Piston Engines Market Y-o-Y Growth Rate Comparison by Region (2021-2029)
      • TABLE 229 MEA Aircraft Piston Engines Market Y-o-Y Growth Rate Comparison by Product Type (2014-2020)
      • TABLE 230 MEA Aircraft Piston Engines Market Y-o-Y Growth Rate Comparison by Product Type (2021-2029)
      • TABLE 231 MEA Aircraft Piston Engines Market Y-o-Y Growth Rate Comparison by End Use (2014-2020)
      • TABLE 232 MEA Aircraft Piston Engines Market Y-o-Y Growth Rate Comparison by End Use (2021-2029)
      • TABLE 233 MEA Aircraft Piston Engines Market Share Comparison by Region (2013-2020)
      • TABLE 234 MEA Aircraft Piston Engines Market Share Comparison by Region (2021-2029)
      • TABLE 235 MEA Aircraft Piston Engines Market Share Comparison by Product Type (2013-2020)
      • TABLE 236 MEA Aircraft Piston Engines Market Share Comparison by Product Type (2021-2029)
      • TABLE 237 MEA Aircraft Piston Engines Market Share Comparison by End Use (2013-2020)
      • TABLE 238 MEA Aircraft Piston Engines Market Share Comparison by End Use (2021-2029)
      • TABLE 239 Table Key Data Information from Secondary Sources
  • ondemand_videoVideos
    • 14734
    • $3,495.00
    • $5,100.00
    • $7,200.00
    Buy Now
    • Textron Inc.
    • Aviation Industry Corporation of China
    • Austro Engines
    • BRP Inc
    • Safran SA
    • Jabiru Aircraft Pty Ltd and Limbach Flugmotoren GmbH.
  • settingsSettings

Our Clients

Subscribe

Subscribe Now

Request for Sample


  • 14734
  • $3,495.00
  • $5,100.00
  • $7,200.00
Buy Now
  • location_on420 Lexington Avenue, Suite 300 New York City, NY 10170,
    United States
  • phone+1 718 618 4351 (International)
  • phone+91 78878 22626 (Asia)
  • emailinquiry@market.us

Find Help

  • Contact Us
  • How to Order

Legal

  • Privacy Policy
  • Refund Policy
  • Frequently Asked Questions
  • Terms and Conditions

Explore

  • About Us
  • All Reports
  • All Sectors
  • Infographics
  • Statistics and Facts

Secured Payment Options

PayPal Payment System
Payoneer Payment System

© 2021 Market.Us. All Rights Reserved.

Share
Tweet
Share
Pin
0 Shares