


Report Overview
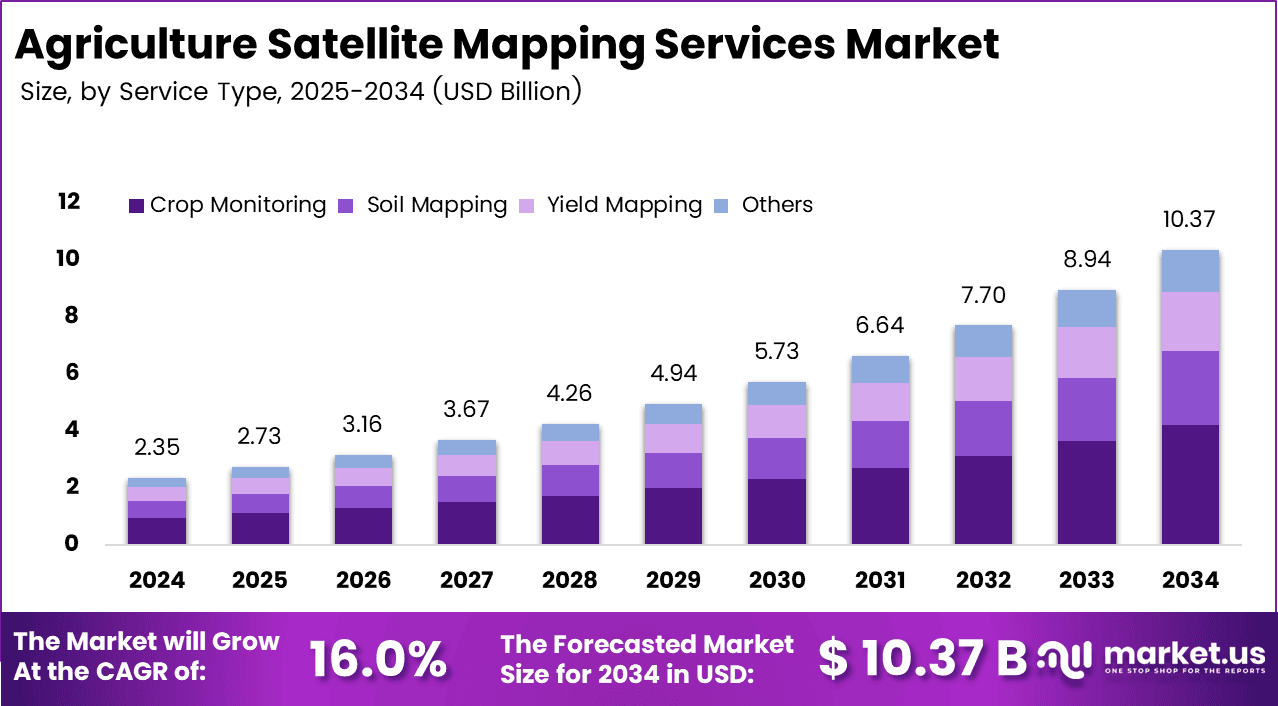
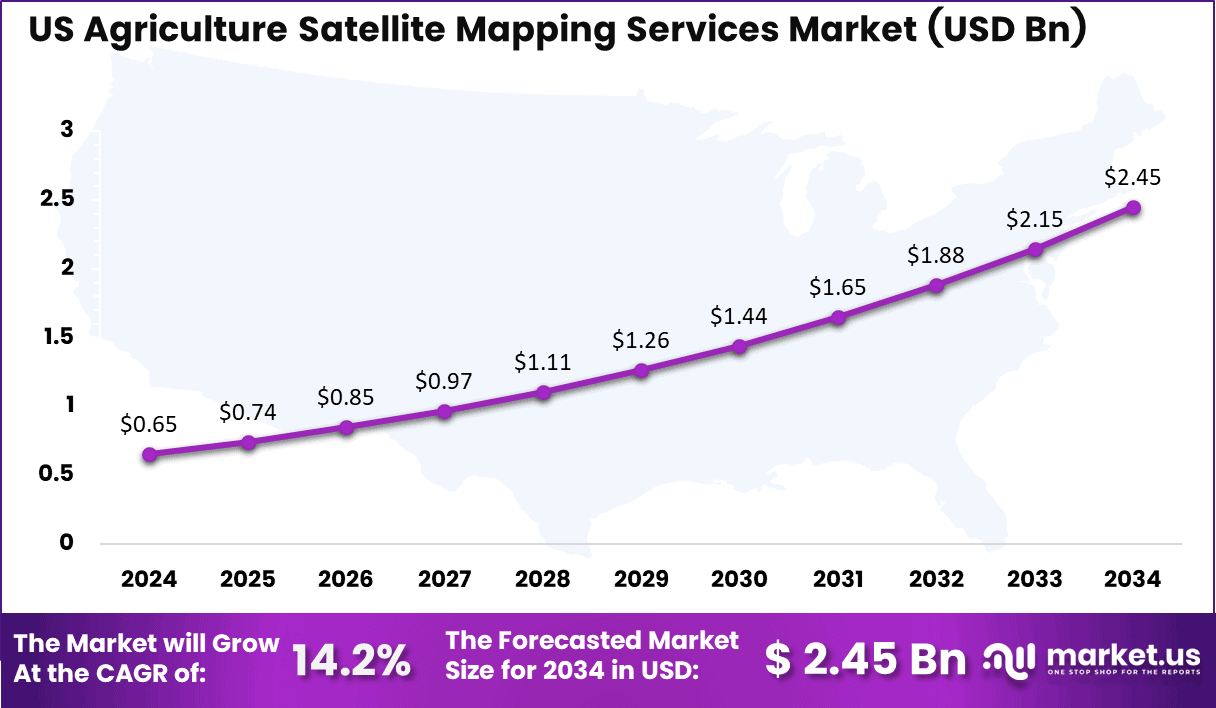
In 2024, the Global Agriculture Satellite Mapping Services Market was valued at USD 2.35 billion. The market is projected to grow at a CAGR of 16.0% during 2025–2034, reaching approximately USD 10.37 billion by 2034. North America dominated the global market in 2024, accounting for more than 32.8% of the total market share and generating approximately USD 0.77 billion in revenue.
Agriculture accounts for more than 70% of global freshwater withdrawals, making efficient irrigation planning increasingly important. Satellite mapping helps farmers identify dry areas, crop stress, and uneven plant growth before applying inputs across entire fields, supporting better water and resource management.
NASA’s Harmonized Landsat and Sentinel-2 program provides global land observations every 2–3 days at 30-meter resolution. This enables frequent crop-health, field-boundary, and water-use monitoring, making satellite data more practical for precision farming, crop monitoring, and yield planning.
The 2022 U.S. Census of Agriculture recorded 1,900,487 farms operating around 880 million acres, while U.S. agricultural product sales exceeded USD 543 billion in 2022, supporting strong demand for remote monitoring, soil mapping, crop scouting, and yield-analysis services.
Key Takeaways
- The Global Agriculture Satellite Mapping Services Market was valued at USD 2.35 billion in 2024 and is projected to reach USD 10.37 billion by 2034, growing at a 16.0% CAGR.
- Crop Monitoring dominated the service type segment with a 40.6% share, supported by frequent in-season crop health decisions.
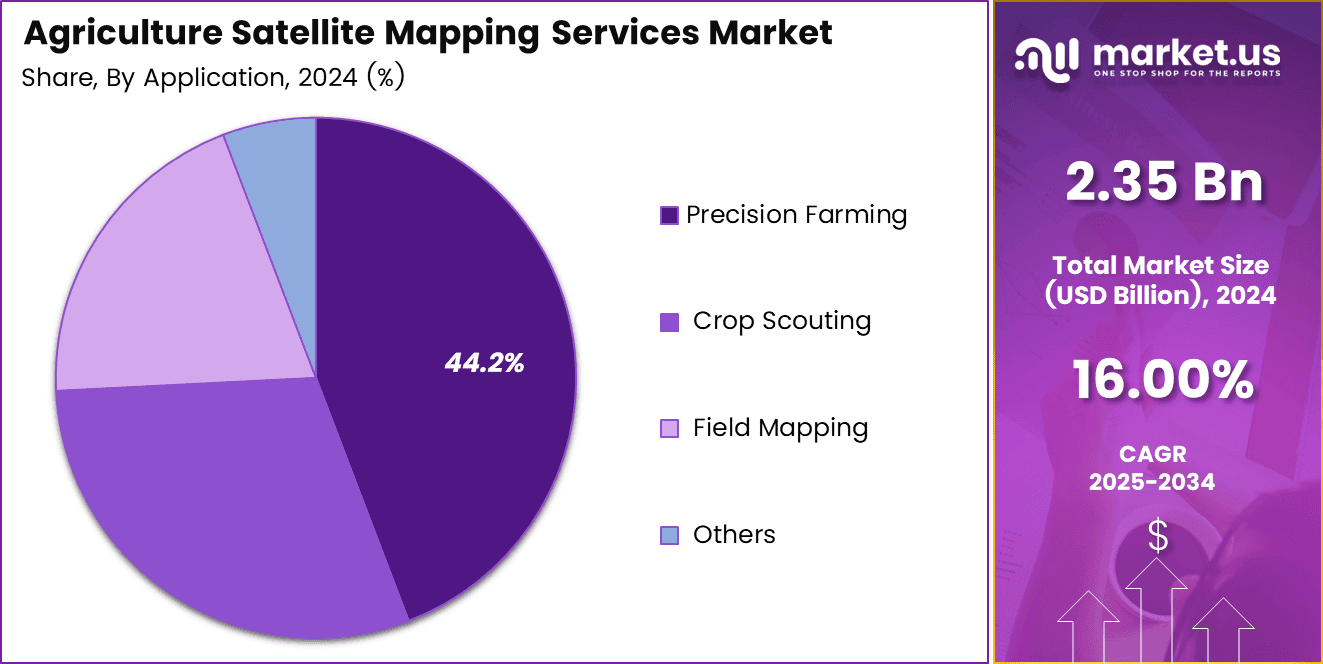
- Precision Farming led the application segment with a 44.2% share, driven by input savings across large agricultural fields.
- Optical Imaging dominated the technology segment with a 58.5% share, supported by detailed crop color and vegetation-vigor data.
- Agricultural Enterprises led the end-user segment with a 42.6% share, driven by large-scale farms requiring recurring mapping services.
- North America led the market in 2024 with more than 32.8% share, generating approximately USD 0.77 billion in revenue.
By Service Type
Crop Monitoring dominates with 40.6% due to frequent in-season crop health decisions.
Crop monitoring leads because growers need regular field-level signals throughout the season, not only after harvest. Satellite images show crop vigor, water stress, pest risk, and uneven growth across large areas, helping farm teams target visits and inputs.
FAO reports that global primary-crop output reached 9.9 billion tonnes in 2023, up 3% from 2022, so small losses across large crop areas can have major farm and food-system effects. FAO also recorded 3.1 billion tonnes of cereals in 2023, which makes timely crop-health tracking important for major grain producers.
By Application
Precision Farming dominates with 44.2% due to input savings across large fields.
Precision farming leads because it turns satellite maps into direct choices on seeding, fertilizer, irrigation, and fieldwork. Farm operators use mapped crop zones to apply inputs only where they can produce a clear result, which helps control costs and protect output.
USDA’s 2022 Census of Agriculture counted 1.9 million farms and ranches in the United States, operating 880 million acres of farmland. It also reported an average farm size of 463 acres, a scale that makes manual field checking costly and gives satellite-led planning clear value.
By Technology
Optical Imaging dominates with 58.5% due to rich crop color and vigor data.
Optical imaging dominates because it captures visible and near-infrared signals that users can convert into easy crop-health maps. These maps show differences in plant cover, leaf condition, crop type, and moisture response, which makes them useful for routine monitoring and farm advice.
Optical systems also give users clear map products that they can compare with field notes, machine data, and historical growing patterns. Radar imaging is likely to grow fastest because it can collect data through clouds and without daylight, solving a key limitation in optical services during wet seasons.
By End-User
Agricultural Enterprises dominate with 42.6% due to scaled farms needing repeat mapping.
Agricultural enterprises dominate because large operators manage many fields, crops, workers, and suppliers at the same time. They need one view of crop condition and land use across their full operations, which supports steady demand for satellite subscriptions, data tools, and advisory services.
The U.S. Census Bureau reported that farms and ranches produced agricultural goods worth more than $543 billion in 2022. The same release counted more than 1.6 million family or individual farms, showing that commercial agriculture includes both large business units and many smaller operators that need practical tools.
Enterprises can spread mapping costs across more acres, link services to machinery, and use multi-year data to guide buying and planting plans. Government agencies are likely to grow fastest because they use satellite mapping for crop estimates, drought response, land records, and food-security planning. USDA’s Cropland Data Layer increased its spatial resolution from 30 meters to 10 meters beginning in 2024.
Key Market Segments
By Service Type
- Crop Monitoring
- Soil Mapping
- Yield Mapping
- Others
By Application
- Precision Farming
- Crop Scouting
- Field Mapping
- Others
By Technology
- Optical Imaging
- Radar Imaging
- Others
By End-User
- Agricultural Enterprises
- Government Agencies
- Research Institutions
- Others
Regional Analysis
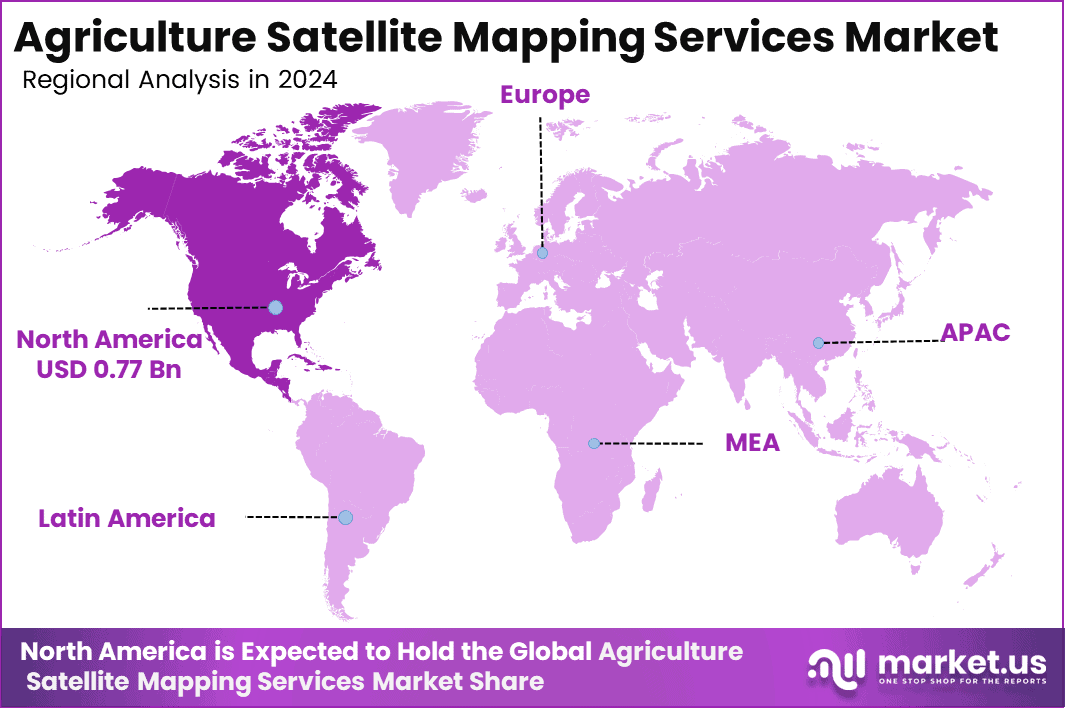
North America led with a market value of USD 0.77 billion, accounting for about 32.8% of the global share, driven by advanced technology adoption and supportive policies like USDA subsidies. The US market, starting at USD 0.65 billion in 2024, is projected to grow at a CAGR of 14.2%, reaching USD 2.45 billion by 2034, reflecting a strong demand for data-driven agricultural solutions.
U.S Market Size
The US Agriculture Satellite Mapping Services Market is an emerging sector harnessing satellite technology to transform farming. Starting at USD 0.65 billion in 2024, the market is valued at approximately USD 0.74 billion today, with a projected compound annual growth rate (CAGR) of 14.2%.
This growth is driven by the adoption of precision agriculture, utilizing satellite data for crop monitoring, soil analysis, and yield prediction. By 2034, the market is expected to reach USD 2.45 billion, reflecting rising demand for data-driven solutions to enhance resource efficiency and agricultural productivity across the United States.
Key Regions and Countries
North America
- US
- Canada
Europe
- Germany
- France
- The UK
- Spain
- Italy
- Rest of Europe
Asia Pacific
- China
- Japan
- South Korea
- India
- Australia
- Rest of APAC
Latin America
- Brazil
- Mexico
- Rest of Latin America
Middle East & Africa
- GCC
- South Africa
- Rest of MEA
Market Dynamics
Drivers
| Driver | (~) % Impact on CAGR Forecast | Geographic Relevance | Impact Timeline |
|---|---|---|---|
| Precision farming adoption | +2.5% | North America, Europe and Asia Pacific | Short term (2 years or less) |
| Water efficiency demand | +2.0% | Middle East, Africa and Asia Pacific | Medium term (2 to 4 years) |
| Satellite data availability | +1.7% | Global | Short term (2 years or less) |
| Crop insurance digitization | +1.3% | North America, Europe and Latin America | Medium term (2 to 4 years) |
| Farm labor constraints | +1.1% | North America, Europe and Japan | Medium term (2 to 4 years) |
Precision farming adoption
Precision farming adoption is the strongest current driver because satellite mapping turns field observations into repeatable operating decisions on seeding, nutrient use, irrigation, and crop scouting. The U.S. Government Accountability Office reported that only 27% of U.S. farms and ranches used precision-agriculture practices during the period from June 2022 to June 2023.
USDA’s National Agricultural Statistics Service increased the Cropland Data Layer resolution from 30 meters to 10 meters beginning in 2024, improving the quality of crop and boundary information available to service providers.
Restraints
| Restraint | (~) % Impact on CAGR Forecast | Geographic Relevance | Impact Timeline |
|---|---|---|---|
| Small-farm affordability limits | -1.6% | Asia Pacific, Africa and Latin America | Short term (2 years or less) |
| Rural connectivity gaps | -1.3% | Africa, Asia Pacific and Latin America | Medium term (2 to 4 years) |
| Farm income volatility | -1.1% | Global | Short term (2 years or less) |
| Fragmented land holdings | -0.9% | Asia Pacific, Africa and Europe | Long term (4 years or more) |
| Public procurement delays | -0.7% | Europe, Africa and Latin America | Medium term (2 to 4 years) |
Small-farm affordability limits
Small-farm affordability remains the clearest sales restraint because recurring imagery, analytics and advisory fees compete with seed, fertilizer, fuel and labor costs that growers must pay before harvest income arrives.
The World Bank reports that rainfed farming accounts for 80% of global agriculture and produces about 60% of food, while around 500 million smallholder farmers remain exposed to unstable rainfall, limited finance and weak access to inputs.
The Food and Agriculture Organization states that agriculture uses more than 70% of global freshwater withdrawals, yet many smaller farms cannot fund the data, devices, and advisory support needed to use water maps well. The International Telecommunication Union reported that 2.6 billion people remained offline in 2023, concentrating access barriers in many rural farming areas.
Challenges
| Challenge | (~) % CAGR Friction Drag | Geographic Relevance | Mitigation Horizon |
|---|---|---|---|
| Cloud cover data gaps | -1.7% | Tropical and monsoon regions | Medium term (2 to 4 years) |
| Ground truth data scarcity | -1.4% | Global | Long term (4 years or more) |
| Farm data interoperability | -1.1% | North America, Europe and Asia Pacific | Medium term (2 to 4 years) |
| Seasonal model accuracy | -0.9% | Global | Long term (4 years or more) |
| Remote sensing skill gaps | -0.8% | Africa, Asia Pacific and Latin America | Long term (4 years or more) |
Cloud cover data gaps
Cloud cover creates the highest operational friction because optical images cannot reliably show crop condition when persistent clouds block the land surface during critical planting, irrigation, and disease-monitoring periods.
NASA’s Landsat 9 records surface data at 30-meter resolution, while its scene footprint covers roughly 185 kilometers by 180 kilometers; such broad coverage helps scale services but does not remove cloud-related observation loss.
FAO’s WaPOR program uses remote sensing to support water-productivity monitoring across 13 countries and has co-developed about 30 local and national decision tools, illustrating the need for local calibration. Providers must combine optical images with radar, weather data, and farm records, which raises data-processing costs and model-validation needs but remains necessary to protect accuracy and retain user trust.
Opportunities
| Opportunity | (~) % Potential CAGR Upside | Geographic Relevance | Execution Window |
|---|---|---|---|
| Carbon and nature verification | +2.1% | North America, Europe and Latin America | Medium term (2 to 4 years) |
| Parametric crop insurance | +1.7% | Africa, Asia Pacific and Latin America | Medium term (2 to 4 years) |
| Livestock forage mapping | +1.3% | Australia, Africa and Latin America | Long term (4 years or more) |
| Input supplier integration | +1.1% | Global | Short term (2 years or less) |
| Public climate services | +0.9% | Asia Pacific, Africa and Middle East | Long term (4 years or more) |
Carbon and nature verification
Carbon and nature verification offers the largest future upside because satellite mapping providers can move from seasonal crop advice into independent measurement of cover crops, land-use change, biomass, and field-practice outcomes; this remains white space because many farm maps still support operational decisions rather than auditable environmental claims.
The European Commission reported that satellite-based Area Monitoring Systems helped correct more than 3 million hectares in 2024, showing that field-scale remote checks can work across large public programs. The European Union’s Common Agricultural Policy has used area-monitoring systems since 2023, creating a practical foundation for verified land-management records.
Standardized digital verification can reduce repeated field-inspection costs by an estimated 20% to 35% and shift revenue toward higher-margin annual assurance subscriptions, provided suppliers establish accepted methods, independent checks, and farmer consent controls.
Key Players Analysis
Tier-1 leadership is concentrated among companies controlling farmer workflows, machinery data, and high-frequency Earth-observation capacity. Deere’s Production & Precision Agriculture segment generated USD 17.3 billion in FY2025 net sales, despite a 16.9% year-on-year decline, giving it a strong route to market through connected equipment and digital agronomy tools.
Trimble remains a leading independent farm-technology platform, with FY2025 Field Systems revenue of USD 1.54 billion. Its total R&D spending reached USD 630.7 million, equal to about 17.7% of its USD 3.59 billion segment revenue base. Planet Labs generated USD 307.7 million in FY2026 revenue, up 26%, while planned capital expenditure of USD 80–95 million supports expansion of satellite capacity.
Together, Deere, Trimble, and Planet Labs represent an estimated 45–55% of the addressable commercial mapping-services revenue among the named companies. The second Tier-1 group includes Airbus Defence and Space, Bayer’s Climate Corporation, BASF, and Geosys. BASF’s Agricultural Solutions sales reached EUR 9.587 billion in 2025, with an EBITDA-before-special-items margin of 21.7%.
BASF also spent EUR 1.995 billion on group R&D and employed around 9,000 R&D staff, while Bayer’s Crop Science unit reported EUR 6.6 billion in first-half 2025 sales.
Tier-2 challengers include Taranis, SatSure, Farmers Edge, Orbital Insight, Descartes Labs, Sentera, Mavrx, SlantRange, and AgEagle/EagleNXT. EagleNXT generated USD 12.8 million in FY2025 revenue and spent USD 3.6 million on R&D, equal to 28.1% of revenue, while drone revenue accounted for USD 7.9 million. These firms compete through specialized analytics, drone-satellite workflows, regional datasets, and recurring farm-management services.
Top Key Players
- Trimble Inc.
- John Deere
- Planet Labs Inc.
- Airbus Defence and Space
- BASF SE
- The Climate Corporation (a subsidiary of Bayer AG)
- GeoOptics Inc.
- Orbital Insight
- Taranis
- Descartes Labs
- Farmers Edge Inc.
- AgEagle Aerial Systems Inc.
- Earth-i Ltd.
- SatSure Ltd.
- Geosys
- Mavrx Inc.
- PrecisionHawk Inc.
- Ag Leader Technology
- Sentera
- SlantRange Inc.
- Other
Recent Development
- In July 2026, Planet Labs secured a one-year, seven-figure contract with the Scottish Government’s Agricultural and Rural Economy Directorate to supply PlanetScope imagery and advanced analytics for agricultural and land-management decisions.
- In May 2026, John Deere recognized Planet Labs with its 2025 Supplier Sustainability Award, formalizing Planet’s role as a satellite-data supplier for Deere’s next-generation precision-agriculture development.
- In March 2025, Syngenta renewed and expanded its strategic partnership with Planet Labs, integrating near-daily satellite imagery into the Cropwise digital agriculture platform. The multi-year agreement gives farmers access to Planet Dove imagery at 3-metre resolution for crop-health monitoring.
Report Scope
| Report Features | Description |
|---|---|
| Market Value (2024) | USD 2.35 Billion |
| Forecast Revenue (2034) | USD 10.37 Billion |
| CAGR(2025-2034) | 16.0% |
| Base Year for Estimation | 2024 |
| Historic Period | 2020-2023 |
| Forecast Period | 2025-2034 |
| Report Coverage | Revenue forecast, AI impact on Market trends, Share Insights, Company ranking, competitive landscape, Recent Developments, Market Dynamics, nd Emerging Trends |
| Segments Covered | By Service Type (Crop Monitoring, Soil Mapping, Yield Mapping, Others), By Application (Precision Farming, Crop Scouting, Field Mapping, Others), By Technology (Optical Imaging, Radar Imaging, Others), By End-User (Agricultural Enterprises, Government Agencies, Research Institutions, Others) |
| Regional Analysis | North America – US, Canada; Europe – Germany, France, The UK, Spain, Italy, Russia, Netherlands, Rest of Europe; Asia Pacific – China, Japan, South Korea, India, New Zealand, Singapore, Thailand, Vietnam, Rest of Latin America; Latin America – Brazil, Mexico, Rest of Latin America; Middle East & Africa – South Africa, Saudi Arabia, UAE, Rest of MEA |
| Competitive Landscape | Trimble Inc., John Deere, Planet Labs Inc., Airbus Defence and Space, BASF SE, The Climate Corporation (a subsidiary of Bayer AG), GeoOptics Inc., Orbital Insight, Taranis, Descartes Labs, Farmers Edge Inc., AgEagle Aerial Systems Inc., Earth-i Ltd., SatSure Ltd., Geosys, Mavrx Inc., PrecisionHawk Inc., Ag Leader Technology, Sentera, SlantRange Inc., Other |
| Customization Scope | Customization for segments, region/country-level will be provided. Moreover, additional customization can be done based on the requirements. |
| Purchase Options | We have three licenses to choose from: Single User License, Multi-User License (Up to 5 Users), Corporate Use License (Unlimited Users, Printable PDF) |





























