


Report Overview
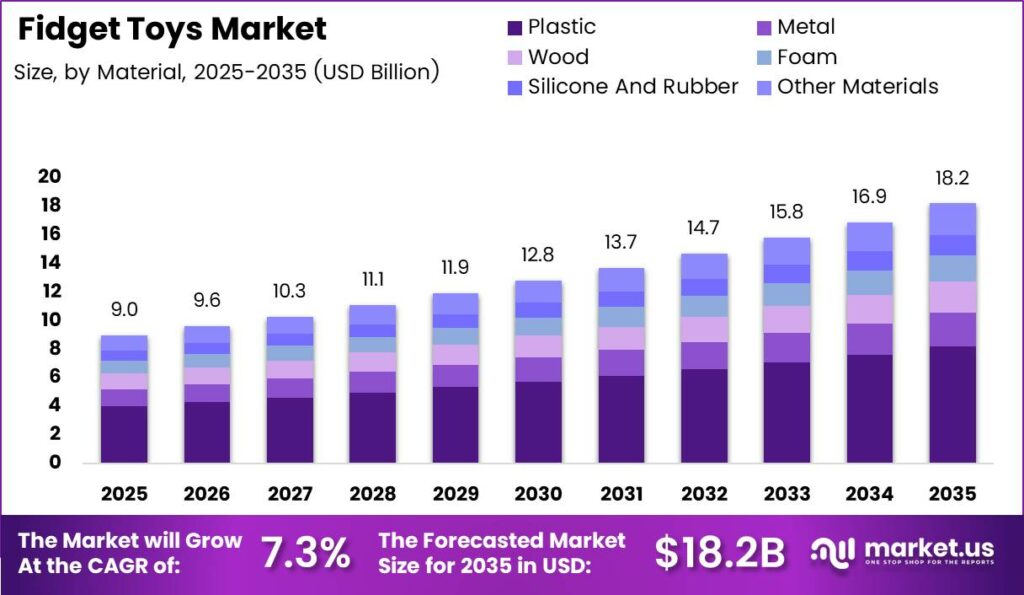
Global Fidget Toys Market size is expected to be worth around USD 18.2 Billion by 2035 from USD 9.0 Billion in 2025, growing at a CAGR of 7.3% during the forecast period 2026 to 2035.
The fidget toys market encompasses handheld tactile products designed to engage motor activity through spinning, clicking, pressing, squeezing, or manipulating. Product formats span fidget spinners, cubes, pop-it toys, sensory and stress balls, putty and slime, and fidget rings, chains, and boards. This reflects a category that serves children, teenagers, and adults across entertainment, stress relief, focus, sensory development, and autism-spectrum support applications.
According to the Toy Association, global toy sales increased 7% by value across 12 tracked markets in 2025. This recovery signals renewed consumer confidence in discretionary spending. Vendors who position fidget toys within premium and wellness-adjacent categories can capture a disproportionate share of this recovered consumer spending before price-led competitors reposition.
Key Takeaways
- The Global Fidget Toys Market is valued at USD 9.0 Billion in 2025 and is forecast to reach USD 18.2 Billion by 2035, at a CAGR of 7.3%.
- By Product Type, Fidget Spinners dominate with a 40.00% share in 2025.
- By Material, Plastic leads with a 45.00% share in 2025.
- By Age Group, Children hold the dominant share at 56.00% in 2025.
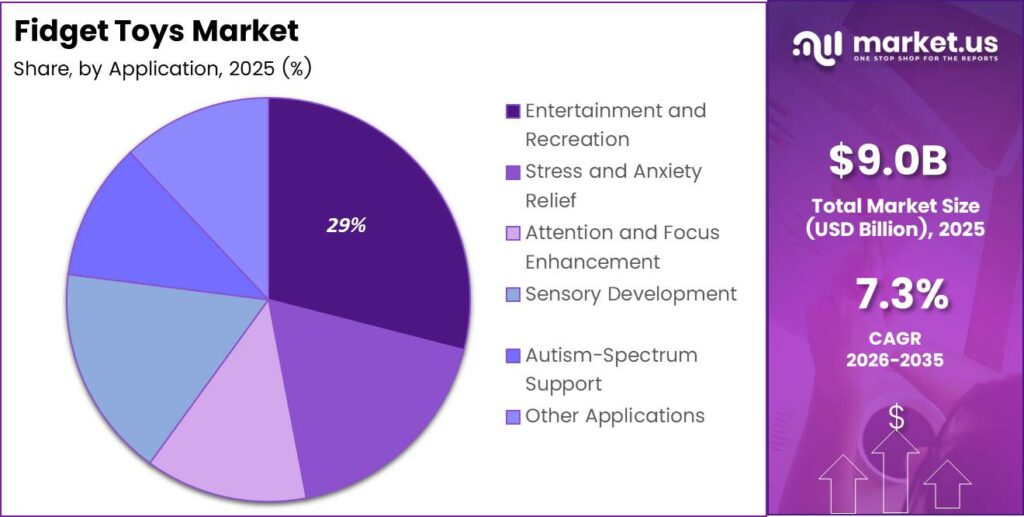
- By Application, Entertainment and Recreation leads with a 29.00% share in 2025.
- By Distribution Channel, Online Retail holds the largest share at 50.00% in 2025.
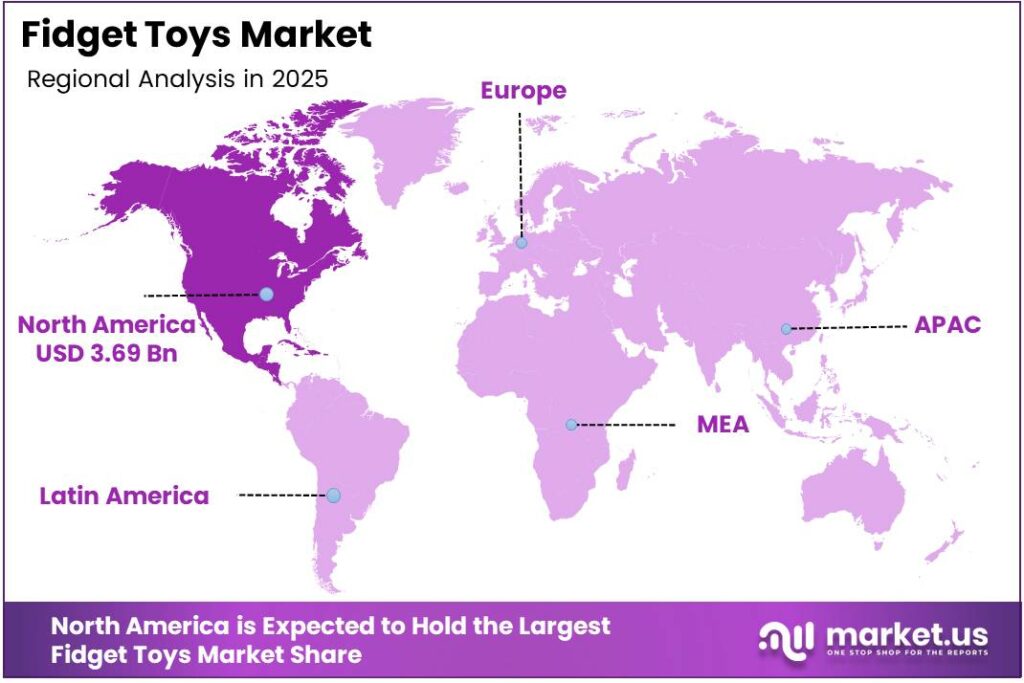
- North America is the dominant region with a 41.00% market share, valued at USD 3.69 Billion in 2025.
As reported by the Toy Association, licensed toy sales increased 15% in 2025 and represented 37% of the global toy market. This concentration of spend around intellectual property creates a durable entry barrier for unbranded fidget producers. Brands that secure character licenses or franchise partnerships shift from commodity pricing into protected revenue streams. VTech announced a new generation of Touch and Learn Activity Desk for FY2026, signaling that leading players actively invest in proprietary formats that resist direct price comparison. Hasbro also announced more than 60 active entertainment projects, including a partnership with HBO to develop a Baldur’s Gate series, reinforcing how top-tier toy groups embed IP deeply into multi-channel pipelines.
Data from the World Bank shows global economic growth of 2.3% in 2025, with projections of 2.5% for 2026 to 2027. As per our research, renewable and recycled content in materials purchased for LEGO bricks reached an estimated average of 52% in 2025 versus 33% in 2024. Global trade in goods and services surpassed US$35 trillion in 2025, according to UNCTAD. These conditions combine to support a market where sustainable sourcing and trade-route diversification are becoming baseline competitive requirements rather than optional differentiators.
Product Type Analysis
Fidget Spinners dominate with 40.00% due to mass retail visibility and viral social adoption.
In 2025, Fidget Spinners held a dominant market position in the By Product Type segment of the Fidget Toys Market, with a 40.00% share. Their compact form, low unit cost, and strong social media presence have sustained repeat purchase behavior across both children and adult demographics. Toy Association data shows global toy unit sales increased 3% across 12 tracked markets in 2025, confirming that volume demand in accessible price tiers remains structurally intact for spinner formats.
Fidget Cubes address users who prefer multi-sensory button, dial, and switch interactions over rotational motion. Their desktop utility has driven adoption among office workers and students seeking discreet focus tools. Average toy selling prices increased 3% across tracked markets in 2025, suggesting that buyers accept modest premiums for products that offer functional differentiation beyond single-axis spinning. This pricing trend directly benefits cube formats priced above entry-level spinners.
Pop-It Toys capture the silicone tactile segment through repeatable bubble-pressing mechanics that appeal across age groups. Collectibles increased 32% globally in 2025 and represented nearly 19% of global toy dollar sales, according to the Toy Association. This collectibles surge benefits pop-it producers who release limited-edition colorways and character-themed shapes, converting single-purchase buyers into multi-unit collectors and lifting per-household revenue meaningfully.
Sensory and Stress Balls serve therapeutic and occupational use cases through squeeze mechanics that support fine motor development. Data from the National Center for Education Statistics shows 59% of U.S. children aged 3 to 5 were enrolled in school in 2022, establishing a large institutionalized child audience for sensory tools. State-funded preschool enrolled 1,751,109 children in the United States in 2023 to 2024, up 7% year over year, per NIEER data.
Putty and Slime Toys, Fidget Rings, Chains, and Boards, and Other Fidget Toys hold the remaining share collectively, serving niche tactile preferences and hobbyist segments. VTech announced a new motion-based learning platform and revamped interactive reading system for FY2026, confirming that leading players are fusing sensory engagement with educational outcomes.
Hasbro reported more than 1 million unique players in Magic: The Gathering organized play during 2025 through more than 10,000 active Wizards Play Network stores, illustrating how structured community play drives sustained category engagement beyond impulse purchase cycles.
Material Analysis
Plastic dominates with 45.00% due to low unit cost and high-volume manufacturing scale.
In 2025, Plastic held a dominant market position in the By Material segment of the Fidget Toys Market, with a 45.00% share. Plastic enables manufacturers to achieve low tooling costs, rapid color variation, and lightweight portability. Building sets grew 18% in 2025 and achieved a sixth consecutive year of growth, according to the Toy Association. This sustained trajectory confirms that plastic-based construction play maintains broad consumer appeal, which reinforces investment in plastic molding infrastructure across the wider toy category.
Metal commands a premium tier within the fidget toys market through heavier weight, tighter mechanical tolerances, and longer product lifespans. Adult buyers seeking desk accessories and quiet mechanisms consistently select metal variants over plastic at higher unit prices. Games and puzzles was the fastest-growing toy supercategory, rising 30% in 2025 per the Toy Association. This expansion of considered-purchase behavior among adults signals a receptive audience for durable, precision-engineered metal fidget formats that justify higher price points.
Wood, Foam, and Silicone and Rubber address sensory-specific and therapeutic segments where texture and tactile response outweigh cost considerations. As per our research, 61.1% of U.S. children and adolescents aged 12 to 17 achieved 60 minutes of physical activity most days or every day during July 2021 to December 2023, per CDC data. Active youth populations generate demand for tactile tools that complement physical engagement rather than replace it. Other Materials hold the remaining share collectively, covering emerging bio-based and recycled-content inputs that respond to sustainability procurement criteria in institutional and European markets.
Age Group Analysis
Children dominate with 56.00% due to strong preschool enrollment and developmental play demand.
In 2025, Children held a dominant market position in the By Age Group segment of the Fidget Toys Market, with a 56.00% share. Institutional enrollment creates a reliable, recurring demand channel for sensory and tactile products in classroom settings. ASER data shows 83.3% of four-year-olds in rural India were enrolled in preschool or early-childhood education in 2024, confirming that emerging-market enrollment rates now generate addressable volume for child-oriented fidget formats beyond traditional Western markets.
Teenagers represent a distinct purchasing segment driven by social media discovery, peer influence, and identity expression through collectible and limited-edition fidget formats. Nearly 40% of European consumers purchased toys for themselves or another adult in 2025, according to the Toy Association. This adult-buying behavior extends naturally into teenager-directed gift purchasing, where gifters apply adult discretionary budgets to youth-oriented products. Adults hold the remaining share, anchoring demand in stress relief, focus, and wellness positioning. This segment sustains premium price tiers through metal construction, quieter mechanisms, and desk-accessory branding that commands higher average selling prices than child-targeted formats.
Application Analysis
Entertainment and Recreation dominates with 29.00% due to broad consumer accessibility and impulse-buy positioning.
In 2025, Entertainment and Recreation held a dominant market position in the By Application segment of the Fidget Toys Market, with a 29.00% share. Mass-market retail placement and low unit prices drive high-volume impulse sales in this segment. Products priced for impulse purchase benefit from the 3% average toy price increase recorded across 12 tracked markets in 2025, as minor price lifts do not meaningfully suppress volume in the entertainment tier.
Stress and Anxiety Relief serves adult and teenage consumers who use tactile engagement as a behavioral coping mechanism during work, commuting, or screen time. This segment benefits directly from the adult stress-relief demand driver, which contributed an estimated +1.4% to the market’s baseline CAGR. Brands that position products explicitly around anxiety management access wellness retail, corporate gifting, and digital-health adjacent channels beyond standard toy distribution.
Attention and Focus Enhancement addresses students, remote workers, and neurodiverse users who seek tactile stimulation to sustain concentration during cognitive tasks. Sensory Development and Autism-Spectrum Support serve therapeutic and clinical use cases where product specifications and safety documentation determine purchase decisions rather than price. Other Applications holds the remaining share, covering occupational therapy tools and specialized institutional procurement that command premium average selling prices through documented clinical utility.
Distribution Channel Analysis
Online Retail dominates with 50.00% due to price transparency, algorithm-driven discovery, and direct-to-consumer margins.
In 2025, Online Retail held a dominant market position in the By Distribution Channel segment of the Fidget Toys Market, with a 50.00% share. Marketplace algorithms amplify trend-driven products within hours of social media virality, compressing the time between discovery and purchase. This channel advantage benefits established brands and agile direct-to-consumer sellers equally, provided listings maintain strong review velocity and search-optimized content.
Specialty Toy Stores serve engaged buyers who prioritize curated assortments, staff expertise, and hands-on product evaluation before purchase. These retailers carry higher-margin SKUs and generate stronger attachment rates for premium and therapeutic fidget categories. Supermarkets and Hypermarkets, Gift and Stationery Stores, and Other Channels hold the remaining share collectively. These physical channels capture impulse and convenience purchases, sustaining volume at lower average price points while providing shelf visibility that reinforces brand recognition built through online discovery.
Key Market Segments
By Product Type
- Fidget Spinners
- Fidget Cubes
- Pop-It Toys
- Sensory and Stress Balls
- Putty and Slime Toys
- Fidget Rings, Chains, And Boards
- Other Fidget Toys
By Material
- Plastic
- Metal
- Wood
- Foam
- Silicone And Rubber
- Other Materials
By Age Group
- Children
- Teenagers
- Adults
By Application
- Entertainment and Recreation
- Stress and Anxiety Relief
- Attention and Focus Enhancement
- Sensory Development
- Autism-Spectrum Support
- Other Applications
By Distribution Channel
- Online Retail
- Specialty Toy Stores
- Supermarkets and Hypermarkets
- Gift And Stationery Stores
- Other Channels
Regional Analysis
North America Dominates the Fidget Toys Market with a Market Share of 41.00%, Valued at USD 3.69 Billion
North America holds the largest share of the global fidget toys market, driven by high consumer spending on discretionary categories, strong e-commerce penetration, and an established retail infrastructure for toy distribution. The Toy Association data shows consumers aged 18 and above generated an 18% year-on-year increase in toy spending in the United States during the first half of 2025. This adult spending uplift is disproportionately concentrated in North America, giving regional suppliers a structural advantage in premium fidget and desk-accessory formats. VTech’s Tecate, Mexico contract-manufacturing facility became fully operational during FY2025, reducing regional supply-chain lead times and reinforcing North America’s capacity to serve fast-turnaround retail replenishment cycles.
Asia Pacific is the fastest-growing region for fidget toys, supported by rising middle-class purchasing power, rapid social commerce adoption, and expanding early-childhood education enrollment. ASER data shows 77.4% of three-year-olds in rural India were enrolled in preschool or early-childhood education in 2024. This enrollment density creates institutional demand for sensory and tactile products well beyond urban retail channels. VTech also announced plans to expand its Muar, Malaysia facilities to support demand, signaling that leading manufacturers are actively scaling Asia Pacific production to meet regional volume growth.
Europe accounts for a material share of global fidget toy revenue, with adult toy purchasing reinforcing category breadth beyond child-focused SKUs. The Toy Association reports that nearly 40% of European consumers purchased toys for themselves or another adult in 2025. This adult-buyer concentration supports premium positioning strategies for European retail channels. Latin America and the Middle East and Africa hold the remaining regional shares collectively, representing early-stage markets where social commerce and affordable impulse formats offer the fastest near-term penetration pathway for price-competitive fidget products.
Key Regions and Countries
North America
- US
- Canada
Europe
- Germany
- France
- The UK
- Spain
- Italy
- Rest of Europe
Asia Pacific
- China
- Japan
- South Korea
- India
- Australia
- Rest of APAC
Latin America
- Brazil
- Mexico
- Rest of Latin America
Middle East and Africa
- GCC
- South Africa
- Rest of MEA
Drivers
Rising adoption of small tactile products by older consumers is shifting fidget toys from a child-focused novelty into an everyday desk, commute, and wellness accessory. In the United States, consumers aged 18 and above generated an 18% year-on-year increase in toy spending during the first half of 2025, while overall toy dollar sales rose 6%. Adult-oriented products sustain average selling prices roughly 15% to 35% above entry-level children’s items through metal construction, quieter mechanisms, and collectible colorways. This mix improvement supports an estimated +1.4% incremental contribution to the 7.3% baseline CAGR.
| Driver | (~) % Impact on CAGR Forecast | Geographic Relevance | Impact Timeline |
|---|---|---|---|
| Adult Stress-Relief Demand | +1.4% | North America, Europe, East Asia | Short term (≤ 2 years) |
| Licensed Character Merchandising | +1.2% | North America, Europe, Japan, China | Short term (≤ 2 years) |
| Sensory Play Adoption | +1.0% | North America, Europe, Australia | Medium term (2–4 years) |
| Social Commerce Discovery | +0.8% | Global, strongest in Asia-Pacific | Short term (≤ 2 years) |
| Affordable Impulse Gifting | +0.6% | Global urban retail markets | Short term (≤ 2 years) |
| Portable Desk-Play Formats | +0.5% | North America, Europe, East Asia | Medium term (2–4 years) |
Restraints
Magnetic haptic products face an immediate sales constraint because small high-powered magnets can cause severe internal injury when swallowed, triggering mandatory product-rule exposure, retailer delisting, and reverse logistics costs. A United States safety recall announced on May 15, 2025 covered magnetic haptic fidget toys sold online from October 2022 through February 2025 at approximately $10 per unit, because the product violated the federal magnet standard and posed an ingestion hazard. For a small supplier, such a recall can convert gross-margin-positive volume into refund, disposal, legal, and customer-service costs exceeding original contribution margin. This suppresses innovation in magnet-based formats and is estimated to deduct -1.3% from the market’s baseline CAGR unless manufacturers shift toward captive magnets or non-magnetic tactile mechanisms.
| Restraint | (~) % Impact on CAGR Forecast | Geographic Relevance | Impact Timeline |
|---|---|---|---|
| Magnet Safety Enforcement | -1.3% | United States, Canada, Europe, Australia | Short term (≤ 2 years) |
| Low-Cost Product Commoditization | -1.1% | Global mass-market channels | Short term (≤ 2 years) |
| Short Product Life Cycles | -0.9% | Global, especially online marketplaces | Short term (≤ 2 years) |
| Child-Safety Testing Costs | -0.7% | North America, Europe, Japan | Medium term (2–4 years) |
| Retail Shelf Rationalization | -0.6% | North America and Western Europe | Short term (≤ 2 years) |
| Household Discretionary Pressure | -0.5% | Price-sensitive emerging markets | Medium term (2–4 years) |
Challenges
Fidget-toy producers increasingly need batch-level material declarations, supplier documentation, laboratory records, and digital product information across fragmented global supply chains. The European Union’s Regulation (EU) 2025/2509, published in December 2025, introduces a toy safety framework applying from August 1, 2030, with strengthened chemical restrictions, online-marketplace obligations, and Digital Product Passports. Manufacturers selling into Europe must begin reformulating plastics, validating colorants, and adapting digital records well before launch. Compliance-system investment can add approximately 2% to 5% to administrative overhead for smaller importers, creating an estimated -1.0% drag on achievable growth.
| Challenge | (~) % CAGR Friction Drag | Geographic Relevance | Mitigation Horizon |
|---|---|---|---|
| Cross-Border Compliance Traceability | -1.0% | Europe, North America, export manufacturing hubs | Medium term (2–4 years) |
| Volatile Polymer Input Costs | -0.8% | Global manufacturing supply chains | Short term (≤ 2 years) |
| Marketplace Counterfeit Monitoring | -0.8% | Global digital commerce channels | Medium term (2–4 years) |
| Demand Forecasting Volatility | -0.7% | Global trend-led retail markets | Short term (≤ 2 years) |
| Multi-Supplier Quality Control | -0.6% | China, Southeast Asia, import markets | Medium term (2–4 years) |
| Sustainable Material Scalability | -0.5% | Europe, North America, Japan | Long term (≥ 4 years) |
Opportunities
Therapeutic retail partnerships remain future upside rather than a current market driver because most fidget products distribute through mass toy, gift, and online channels rather than occupational-therapy, sensory-support, or clinician-adjacent retail ecosystems. A supplier that develops age-appropriate, non-magnetic, cleanable, low-noise products with documented sensory-use guidance can move from impulse sales toward curated multipacks and institution-ready assortments. The commercial model can lift realized gross margins by roughly 10% to 18% through premium material selection and bundle economics. Capturing this channel could add approximately +1.5% above the 7.3% baseline CAGR by expanding addressable demand into professional and institutional purchasing budgets.
| Opportunity | (~) % Potential CAGR Upside | Geographic Relevance | Execution Window |
|---|---|---|---|
| Therapeutic Retail Partnerships | +1.5% | North America, Europe, Australia | Medium term (2–4 years) |
| Premium Refillable Fidget Systems | +1.2% | North America, Europe, Japan, South Korea | Medium term (2–4 years) |
| Corporate Wellness Bundles | +1.0% | North America, Europe, India, East Asia | Short term (≤ 2 years) |
| Educational Sensory Kits | +0.9% | North America, Europe, Gulf markets | Medium term (2–4 years) |
| Circular Take-Back Programs | +0.7% | Europe, Japan, selected North American cities | Long term (≥ 4 years) |
| Localized Digital-First Collections | +0.6% | India, Southeast Asia, Latin America | Short term (≤ 2 years) |
Key Company Insights
The LEGO Group delivered record financial results in 2025, with revenue increasing 12% to DKK 83.5 billion, operating profit rising 18% to DKK 22.0 billion, and net profit climbing 21% to DKK 16.7 billion. Consumer sales grew 16% and free cash flow reached DKK 10.8 billion. Capital investment totaled DKK 9.2 billion, up from DKK 9.0 billion in 2024, directed at new factory construction and facility expansion.
The group launched more than 860 products in 2025, with approximately half being new introductions, and activated its Formula 1 partnership across more than 20 Grand Prix events. LEGO Fortnite Odyssey exceeded 1 billion player hours since launch, demonstrating deep digital engagement that extends brand reach well beyond physical product sales. The acquisition of 29 Discovery Centres and LEGOLAND Discovery Centres across 9 countries, attracting around 5 million annual visitors, converts the LEGO brand into an experiential retail platform that competitors cannot replicate without equivalent capital commitment.
VTech Holdings Limited reported group revenue of US$2.1772 billion for FY2025, a 1.5% increase year over year, with gross profit margin expanding to 31.5% from 29.6% in FY2024. Profit attributable to shareholders declined 5.9% to US$156.8 million, reflecting ongoing investment in supply-chain restructuring. North America accounted for 41.0% of group revenue at US$893.1 million, though this declined 3.2% year over year, while Electronic Learning Products revenue in North America grew 7.0% to US$444.9 million.
European revenue increased 8.2% to US$960.7 million, representing 44.1% of group revenue, signaling that VTech’s geographic mix is shifting toward Europe. VTech sells products in more than 90 countries across a global workforce of more than 20,000 employees in 19 countries, and won more than 60 industry awards in FY2025. At Toy Fair 2025, VTech launched six new educational products and four new LeapFrog products, confirming an active product pipeline that sustains retailer shelf presence across key markets.
Key Players
- The LEGO Group
- Hasbro, Inc.
- Mattel, Inc.
- Spin Master Corp.
- ZURU Inc.
- Ravensburger AG
- Fat Brain Toys, LLC
- Schylling Inc.
- Goliath Games, LLC
- Fun In Motion Toys, Inc.
- Tangle Creations
- Antsy Labs LLC
- ARK Therapeutic Services, Inc.
- The Pencil Grip, Inc.
- Harkla
Recent Developments
- March 2026 – LEGO Group completed the acquisition of 29 LEGO Discovery Centres and LEGOLAND Discovery Centres across 9 countries, collectively attracting around 5 million visitors annually.
- March 2026 – LEGO Group reported DKK 9.2 billion of 2025 capital investment, directed primarily at new factory construction and expansion of existing manufacturing facilities.
- March 2026 – LEGO Group confirmed the 2025 opening of a new factory and regional distribution centre in Vietnam.
- March 2026 – LEGO Group expanded existing manufacturing facilities in Hungary, Mexico, and China during 2025.
- March 2026 – LEGO Group announced a Formula 1 Academy partnership to bring LEGO Racing to the track in 2026.
- May 2025 – VTech Holdings Limited confirmed that Electronic Learning Products production for U.S.-bound products was being transferred away from China, with full completion targeted within 2026.
- May 2025 – VTech Holdings Limited announced plans to add artificial-intelligence-enabled baby-monitor models by September 2025.
- February 2026 – Hasbro, Inc. reported almost US$800 million in gross cost savings delivered through 2025 under its Operational Excellence program.
- February 2026 – Hasbro, Inc. announced a target to exceed US$1.0 billion in gross cost savings through the Operational Excellence program.
- February 2026 – Hasbro, Inc. announced that its Magic: The Gathering Final Fantasy set was its highest-selling set of all time based on net revenues.
Report Scope
| Report Features | Description |
|---|---|
| Market Value (2025) | USD 9.0 Billion |
| Forecast Revenue (2035) | USD 18.2 Billion |
| CAGR (2026-2035) | 7.3% |
| Base Year for Estimation | 2025 |
| Historic Period | 2020-2024 |
| Forecast Period | 2026-2035 |
| Report Coverage | Revenue Forecast, Market Dynamics, Market Opportunity Analysis, Technology and Innovation Landscape, Competitive Landscape, Recent Developments |
| Segments Covered | By Product Type (Fidget Spinners, Fidget Cubes, Pop-It Toys, Sensory and Stress Balls, Putty and Slime Toys, Fidget Rings, Chains, And Boards, Other Fidget Toys), By Material (Plastic, Metal, Wood, Foam, Silicone And Rubber, Other Materials), By Age Group (Children, Teenagers, Adults), By Application (Entertainment and Recreation, Stress and Anxiety Relief, Attention and Focus Enhancement, Sensory Development, Autism-Spectrum Support, Other Applications), By Distribution Channel (Online Retail, Specialty Toy Stores, Supermarkets and Hypermarkets, Gift And Stationery Stores, Other Channels) |
| Regional Analysis | North America (US and Canada), Europe (Germany, France, The UK, Spain, Italy, and Rest of Europe), Asia Pacific (China, Japan, South Korea, India, Australia, and Rest of APAC), Latin America (Brazil, Mexico, and Rest of Latin America), Middle East and Africa (GCC, South Africa, and Rest of MEA) |
| Competitive Landscape | The LEGO Group, Hasbro, Inc., Mattel, Inc., Spin Master Corp., ZURU Inc., Ravensburger AG, Fat Brain Toys, LLC, Schylling Inc., Goliath Games, LLC, Fun In Motion Toys, Inc., Tangle Creations, Antsy Labs LLC, ARK Therapeutic Services, Inc., The Pencil Grip, Inc., Harkla |
| Customization Scope | Customization for segments, region/country-level will be provided. Additional customization can be done based on requirements. |
| Purchase Options | We have three licenses to opt for: Single User License, Multi-User License (Up to 5 Users), Corporate Use License (Unlimited User and Printable PDF) |





































