


Quick Navigation
Report Overview
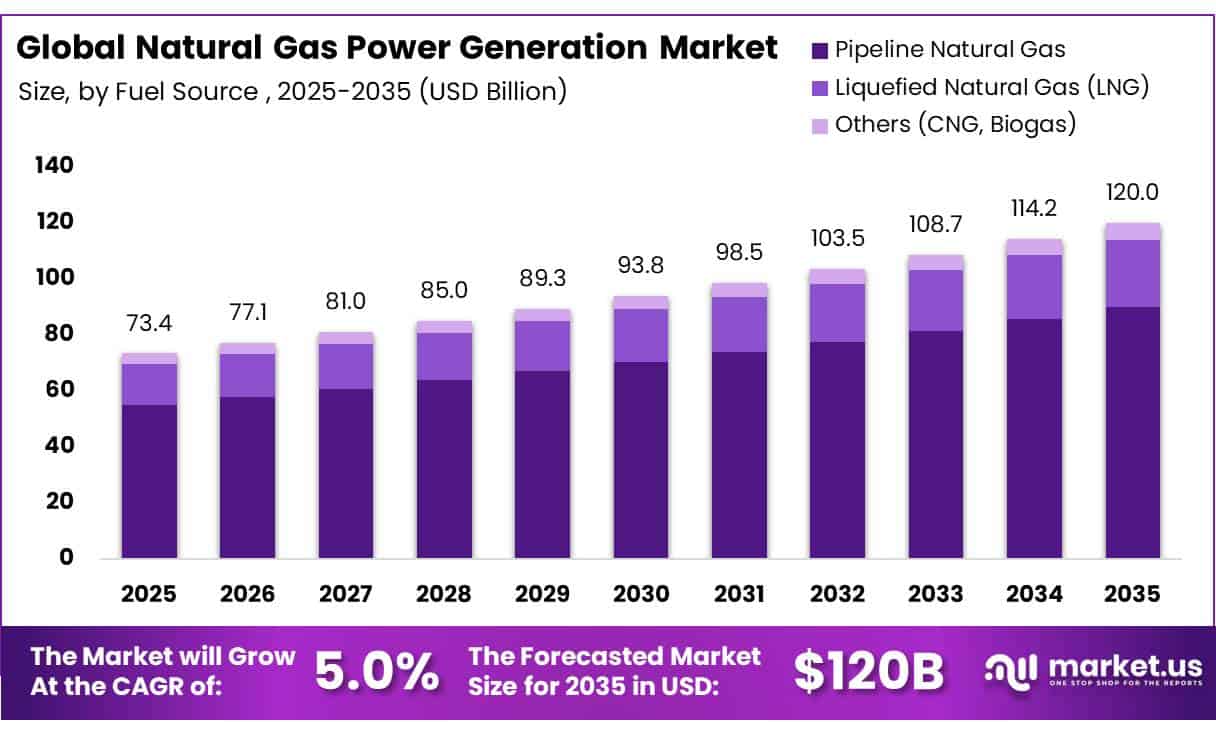
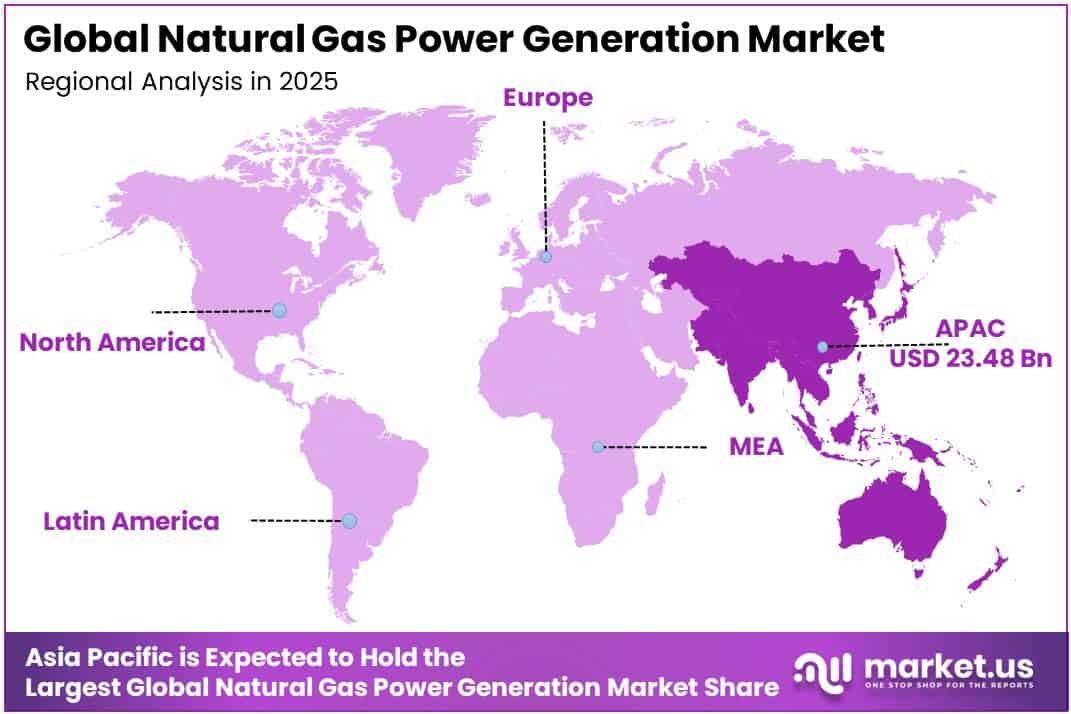
In 2025, the Global Natural Gas Power Generation Market was valued at USD 73.4 billion, and between 2026 and 2035, this market is estimated to register a CAGR of 5.0%, reaching about USD 120.0 billion by 2035. Asia Pacific held a dominant market position, capturing more than a 32.0% share, holding USD 23.48 billion in revenue.
Natural gas power generation converts pipeline gas, Liquefied Natural Gas (LNG), compressed natural gas, or biogas into electricity through gas turbines, steam turbines, combined-cycle plants, and reciprocating engines. In March 2025, according to the International Energy Agency (IEA), global electricity demand increased 4.3% in 2024, while natural gas remained the second-largest generation source and supplied more than 20% of global electricity. This installed role supports utilities seeking dispatchable capacity for peak demand and renewable balancing.
- In July 2025, according to the IEA, global gas-fired generation was expected to increase 3% during 2025 and reach a new high, following 1.9% growth in 2024. Expansion was led by oil-to-gas switching in the Middle East and sustained generation growth in Asia, while weaker wind and hydropower output also increased gas use in parts of Europe.
Key Takeaways
- The global natural gas power generation market was valued at USD 73.4 billion in 2025.
- The global market is projected to grow at a CAGR of 5.0% and is estimated to reach USD120.0 billion by 2035.
- On the basis of fuel source, the pipeline natural gas segment dominated the market, constituting 75.0% of the total market share.
- Based on power output, the 501–1000 MW segment dominated the market, accounting for 45.0% of the total market share.
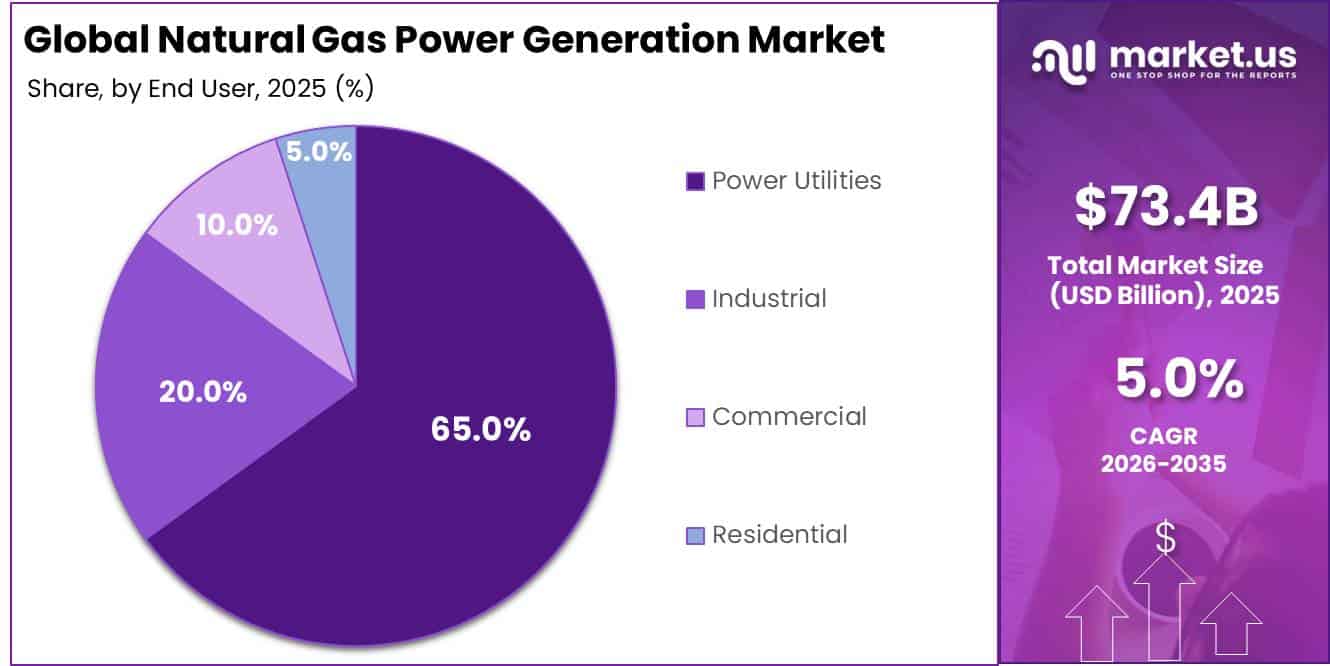
- Among end users, power utilities held the largest share in the natural gas power generation market, representing 65.0% of the market share.
- In 2025, Asia Pacific was the most dominant region in the natural gas power generation market, accounting for 32.0% of the total global market share.
Fuel availability creates further growth opportunities. In June 2025, according to the IEA, global LNG liquefaction capacity stood at about 670 billion cubic metres annually, with nearly 290 billion cubic metres of additional export capacity expected between 2025 and 2030 from projects already under construction. A larger traded supply base can improve procurement options for importing countries and support new power plants where domestic pipelines are limited, although terminals, storage, and transmission infrastructure remain essential.
Government programmes are encouraging lower-emission generation technologies. In January 2025, according to the United States Department of Energy, USD 101 million was awarded to 5 projects developing carbon dioxide capture, removal, and conversion test centres for power plants and cement facilities. These initiatives can support future gas-fired projects through improved emissions control, while digital monitoring, hydrogen-ready equipment, combined-cycle upgrades, and flexible engine systems create opportunities for manufacturers, engineering contractors, utilities, and independent power producers across both mature and emerging markets.
Fuel Source Analysis
Pipeline Natural Gas dominates with 75.0% because established networks support dependable power generation.
In 2025, Pipeline Natural Gas held a dominant market position, capturing more than a 75.0% share. Its leadership was supported by direct access to established transmission systems, predictable fuel delivery, and continuous supply for large power stations. Pipeline connections reduce dependence on on-site storage and repeated marine or road deliveries. They also help utilities operate combined-cycle plants efficiently, respond to changing demand, and maintain regular generation schedules. These advantages make pipeline gas practical in regions with mature infrastructure and concentrated industrial or urban demand.
- For instance, in June 2026, according to GE Vernova, the company secured an H-class equipment order for EVN’s Quang Trach II LNG Power Plant in Vietnam, supporting the development of new gas-fired generation capacity.
Liquefied Natural Gas is expected to be a growing segment as markets seek access where pipeline supply remains limited. LNG terminals connect gas sources with power plants, diversify supply, and support coastal generation. Expansion is encouraged by regasification infrastructure, floating terminals, and demand for dispatchable electricity alongside renewable power.
Power Output Analysis
501–1000 MW leads with 45.0% while Above 1000 MW gains momentum
In 2025, 501–1000 MW held a dominant market position, capturing more than a 45.0% share. Plants in this output range are preferred because they provide substantial grid capacity without the financing, construction, and fuel-supply pressures associated with larger facilities. Combined-cycle units also support quick load adjustment, efficient operation, and renewable power integration. In June 2025, the U.S. Energy Information Administration reported that developers planned 18.7 GW of combined-cycle capacity through 2028, with 4.3 GW already under construction.
- For instance, in May 2026, according to Siemens Energy, the company signed an agreement to supply equipment and long-term services for Taiwan’s Mai-Liao gas-fired project, comprising two 1,200 MW units with 2,400 MW of total capacity.
Above 1000 MW is the growing segment as utilities develop large combined-cycle sites to replace ageing thermal assets and serve rising electricity demand. These projects benefit from economies of scale, advanced turbines, centralised maintenance, and the ability to supply major cities and industrial regions through one generation complex.
End User Analysis
Power Utilities lead with 65.0%, while Industrial demand builds momentum
In 2025, Power Utilities held a dominant market position, capturing more than a 65.0% share. Utilities remained the main buyers of natural gas generation because combined-cycle plants provide dependable electricity, respond quickly to peak demand, and balance variable renewable output. In March 2026, the U.S. Energy Information Administration reported that electric-power gas demand averaged 35.8 billion cubic feet per day in 2025, highlighting the operating scale of grid-based generators.
- For instance, in April 2025, according to Duke Energy and GE Vernova, the companies formed an equipment partnership creating a path for Duke Energy to procure up to 11 natural gas turbines for projects supporting manufacturing, data centres, population growth, and wider electricity demand.
Industrial is the growing segment as factories, refineries, chemical plants, and processing facilities adopt onsite gas engines and combined heat and power systems. In May 2026, the U.S. Energy Information Administration stated that industrial natural gas consumption reached a record 23.6 billion cubic feet per day in 2025 and was expected to rise further through 2027.
Key Market Segments
By Fuel Source
- Pipeline Natural Gas
- Liquefied Natural Gas (LNG)
- Others (CNG, Biogas)
By Power Output
- 501–1000 MW
- Above 1000 MW
- 201–500 MW
- 51–200 MW
- Up to 50 MW
By End-User
- Power Utilities
- Industrial
- Commercial
- Residential
Driver Analysis
AI Data-Centre Load and Firm-Power Procurement
Data-centre expansion is shifting gas generation from a predominantly merchant-energy asset toward contracted, high-availability infrastructure: global data-centre electricity consumption is expected to rise from 460 TWh in 2024 to more than 1,000 TWh in 2030, while advanced economies are projected to derive more than 20% of incremental electricity-demand growth through 2030 from data centres.
In the United States, gas already supplies more than 40% of data-centre electricity demand, and the IEA expects gas-fired output supporting data centres to add more than 130 TWh annually by 2030; this favours combined-cycle gas turbine (CCGT) projects with firm gas transport, dual-feed interconnection, black-start capability and long-duration power-purchase agreements rather than uncontracted peak plants.
U.S. developers plan 6.3 GW of gas-fired capacity additions in 2026, including 3.3 GW of CCGT and 2.8 GW of combustion-turbine capacity, with more than 80% concentrated in Texas, Oklahoma, Ohio, Tennessee and Florida evidence that load-location economics and time-to-power are becoming decisive project-selection criteria.
Drivers Impact Analysis
| Driver | (~) % Impact on CAGR | Geographic Relevance | Impact Timeline |
|---|---|---|---|
| AI data-centre load and firm-power procurement | +1.3 pp | North America core, Europe, APAC hubs | Short term (≤ 2 years) |
| LNG supply expansion and gas-market liquidity | +0.9 pp | Asia LNG buyers, Europe, Latin America | Medium term (2–4 years) |
| Renewable balancing and grid-congestion resilience | +0.8 pp | EU, China, India, Australia, US | Medium term (2–4 years) |
| Coal retirement and flexible CCGT replacement | +0.7 pp | US, Europe, South & Southeast Asia | Medium term (2–4 years) |
| Capacity-market and energy-security procurement | +0.6 pp | Europe, Brazil, US, Japan, Korea | Short term (≤ 2 years) |
| Decarbonisation-ready turbines, CCS and hydrogen pathways | +0.4 pp | North America, EU, Gulf, Japan/Korea | Long term (≥ 4 years) |
Restraint Analysis
Gas-Price and LNG Volatility
Fuel-price volatility remains the most immediate restraint because gas-fired assets convert a volatile commodity input directly into dispatch cost, eroding dispatch competitiveness and destabilising contracted power margins when fuel pass-through is incomplete. Global gas demand rose only around 1% in 2025, while high spot LNG prices weakened demand in price-sensitive Asian markets; Henry Hub spot prices increased about 60% year on year during 2025, encouraging gas-to-coal switching in the United States, and power-sector gas demand grew by less than 1% globally despite stronger electricity demand.
For gas-dependent generation, a higher delivered-LNG price raises variable cost per MWh before carbon, transmission and balancing charges, forcing generators either to absorb margin compression, pass through higher tariffs subject to regulatory approval, reduce utilisation, or procure hedges that add collateral and credit-support costs; this is particularly punitive for merchant plants, emerging-market utilities with regulated tariffs, and projects dependent on spot LNG rather than long-term supply indexed to diversified benchmarks.
Restraint Impact Analysis
| Restraint | (~) % Impact on CAGR | Geographic Relevance | Impact Timeline |
|---|---|---|---|
| Gas-price and LNG volatility | -1.4 pp | Asia LNG buyers, Europe, Latin America | Short term (≤ 2 years) |
| Turbine and component backlog | -1.2 pp | North America core, EU, APAC corridors | Medium term (2–4 years) |
| Carbon and methane compliance | -0.9 pp | EU, North America, Japan/Korea | Medium term (2–4 years) |
| Renewables and storage substitution | -0.8 pp | China, EU, India, Australia, US | Medium term (2–4 years) |
| Pipeline, LNG and grid constraints | -0.7 pp | India, Southeast Asia, Africa, Latin America | Medium term (2–4 years) |
| Financing and stranded-asset risk | -0.6 pp | EU, OECD Asia, emerging LNG importers | Long term (≥ 4 years) |
Opportunity Analysis
Behind-the-Meter Data-Centre Power
This is an opportunity rather than a baseline driver because conventional forecasts largely count utility-scale grid supply, whereas the underpenetrated white space is integrated, behind-the-meter or physically dedicated gas generation sold as a firm-power service to hyperscalers, colocation operators and AI campuses facing multi-year grid-interconnection delays.
Global data-centre electricity demand is projected to rise from roughly 460 TWh in 2024 to more than 1,000 TWh by 2030, and in advanced economies data centres alone are expected to contribute more than 20% of electricity-demand growth through 2030; suppliers can convert this demand into 10- to 20-year availability contracts combining CCGT or reciprocating-engine capacity, gas transport, backup generation, switchgear, heat recovery and operational guarantees.
The strategic value is not simply incremental MWh sales: a 100 MW dedicated project operating at 90% availability produces about 788 GWh annually, enabling developers to monetise capacity, energy, resilience and maintenance under one contract, reduce customer exposure to grid-queue risk and create higher-quality contracted cash flows than merchant generation, although air-permit, gas-pipeline and carbon-intensity requirements will determine scalability.
Opportunity Impact Analysis
| Opportunity | (~) % Potential CAGR | Geographic Relevance | Execution Window |
|---|---|---|---|
| Behind-the-meter data-centre power | +1.4 pp | North America core, Europe, APAC hubs | Short term (≤ 2 years) |
| Flexibility-as-a-service | +1.1 pp | EU, US, Australia, India | Medium term (2–4 years) |
| Stranded-plant repowering roll-ups | +0.9 pp | India, Southeast Asia, Latin America | Short term (≤ 2 years) |
| Industrial CHP microgrids | +0.8 pp | North America, EU, Gulf, China | Medium term (2–4 years) |
| Hydrogen/CCS cluster conversion | +0.7 pp | EU, Gulf, US, Japan/Korea | Long term (≥ 4 years) |
| Gas-to-power infrastructure M&A | +0.6 pp | Latin America, Africa, South Asia | Medium term (2–4 years) |
Challenges Analysis
Turbine Lifecycle Bottlenecks
Heavy-duty gas-turbine lead times have extended from about 2 years in 2021 to nearly 5 years for orders placed in 2025–2026, while developers are expected to seek equipment for around 63 GW of U.S. gas capacity additions during 2026–2030, concentrating demand on a limited OEM and component supplier base; a 12-month delay in a 500 MW CCGT’s commercial-operation date can defer approximately 3.5–4.0 TWh of potential annual generation at an 80%–90% capacity factor.
Developers must therefore reserve manufacturing slots before final investment decision, hold 10%–15% higher schedule contingencies than pre-2021 projects, standardise fleet equipment, secure spare-part rights and diversify repair pathways to prevent supply-chain dependency from converting construction milestones into prolonged revenue leakage.
Challenges Impact Analysis
| Challenge | (~) % CAGR Friction | Geographic Relevance | Mitigation Horizon |
|---|---|---|---|
| Turbine Lifecycle Bottlenecks | -1.0 pp | North America, EU, APAC | Medium term (2–4 years) |
| Cycling-Induced Asset Wear | -0.8 pp | EU, US, Australia, China | Medium term (2–4 years) |
| Fuel Logistics Synchronisation | -0.7 pp | Asia LNG markets, Europe, Latin America | Medium term (2–4 years) |
| Grid Dispatch Digitalisation | -0.6 pp | North America, EU, India, ASEAN | Long term (≥ 4 years) |
| Specialist Workforce Attrition | -0.5 pp | North America, EU, Japan, Korea | Long term (≥ 4 years) |
| Emissions-Data Interoperability | -0.4 pp | EU regulatory hubs, global LNG exporters | Medium term (2–4 years) |
Geopolitical Impact Analysis
Pipeline Realignment and Liquefied Natural Gas Competition Reshaping Gas-Fired Power Generation.
Current geopolitical tensions are reshaping the global natural gas power generation market through pipeline disruptions, sanctions, import restrictions, and changing fuel-supply alliances. In April 2026, the European Commission reported that Russian gas declined from 45% of European Union gas imports before the energy crisis to 12% in 2025. However, the region still imported 36 billion cubic metres of Russian gas during 2025, showing continued exposure to political and supply risks.
- In January 2026, the International Energy Agency reported that Russian pipeline deliveries to the European Union fell 90% between 2021 and 2025. European measures are expected to reduce combined Russian pipeline gas and LNG deliveries by 33 billion cubic metres between 2025 and 2028, encouraging utilities to diversify contracts, terminals, storage facilities, and generation-fuel sources.
Export policy is also influencing global fuel availability. In August 2025, the United States Department of Energy authorized Commonwealth LNG to export up to 1.21 billion cubic feet per day to non-free-trade-agreement countries. Such approvals can strengthen supply options for gas-fired power producers, although they may also increase competition between domestic generators and international buyers.
Shipping instability adds further uncertainty. In September 2025, United Nations Trade and Development projected maritime trade growth of only 0.5%, while geopolitical rerouting had increased ton-miles by nearly 6% during 2024. These conditions encourage gas power operators to secure multiple suppliers, maintain fuel inventories, and invest in flexible generation, but freight costs, sanctions, and regional price differences continue to affect plant dispatch and profitability.
Regional Analysis
Asia Pacific Held the Largest Share of the Global Natural Gas Power Generation Market.
In 2025, Asia-Pacific held a dominant position in the global natural gas power generation market, accounting for 32.0% of total market revenue and reaching approximately USD 23.48 billion. The region’s leadership is driven by rising electricity consumption, expanding urban and industrial activity, and continued investments in reliable power generation infrastructure. Natural gas-fired power plants have become increasingly important in supporting grid stability while complementing the growing deployment of renewable energy sources.
The region benefits from a growing natural gas supply network, including pipeline systems, liquefied natural gas (LNG) import terminals, and regasification infrastructure that support fuel availability for power producers.
- In February 2025, according to the International Energy Agency’s Electricity 2025 report, Asia-Pacific remained a major contributor to global electricity demand growth, supported by expanding industrial production, digital infrastructure, data centres, and increasing electrification. These factors continued to strengthen demand for dependable power generation assets capable of operating alongside renewable energy resources.
Government-backed energy security initiatives and investments in cleaner generation technologies have further supported market expansion. Utilities across the region are modernizing aging power infrastructure and deploying high-efficiency gas-fired generation systems to improve reliability and operational performance. As electricity demand continues to rise and energy systems become more diversified, Asia-Pacific is expected to maintain its dominant position within the global natural gas power generation market over the forecast period.
Key Regions and Countries Covered
- North America
- The US
- Canada
- Europe
- Germany
- France
- The UK
- Spain
- Italy
- Russia & CIS
- Rest of Europe
- APAC
- China
- Japan
- South Korea
- India
- ASEAN
- Rest of APAC
- Latin America
- Brazil
- Mexico
- Rest of Latin America
- Middle East & Africa
- GCC
- South Africa
- Rest of MEA
Key Players Analysis
The natural gas power generation market includes established equipment manufacturers, engineering companies, and distributed power system providers competing through efficiency, reliability, operating flexibility, and service quality. Major players such as GE Vernova Inc., Siemens Energy AG, Mitsubishi Heavy Industries, Ltd., Wärtsilä Corporation, Caterpillar Inc., and Cummins Inc. maintain strong positions through broad technology portfolios, engineering expertise, and established customer networks.
Leading companies are strengthening their market presence through new equipment orders, manufacturing investment, power plant modernization, and long-term service agreements. GE Vernova, Siemens Energy, and Mitsubishi Heavy Industries focus on large gas turbine and combined-cycle projects, while Wärtsilä, Caterpillar, Cummins, Generac Power Systems, and Tecogen compete across distributed and engine-based generation.
Market Key Players
- GE Vernova Inc.
- Siemens Energy AG
- Mitsubishi Heavy Industries, Ltd.
- Wärtsilä Corporation
- Caterpillar Inc.
- Ansaldo Energia S.p.A.
- Kawasaki Heavy Industries, Ltd.
- Tecogen, Inc.
- Cummins Inc.
- Generac Power Systems, Inc.
- Kohler Co.
- Clarke Energy
- Bechtel Corporation
- Fluor Corporation
- Worley Limited
- Others
Key Development
- In June 2026, GE Vernova secured an order to supply two 9HA.02 gas turbines and two generators for Vietnam’s Quang Trach II liquefied natural gas power plant, which is expected to provide more than 1.6 gigawatts of generation capacity.
- In May 2026, Wärtsilä signed two equipment supply contracts with Origem Energia for 371 megawatts of new balancing power projects in Brazil, covering 36 Wärtsilä 34SG gas engines.
- In February 2026, Siemens Energy announced a USD 1 billion investment to expand United States grid and gas turbine manufacturing, including the resumption of gas turbine production in Charlotte and additional component capacity in Florida.
Report Scope
| Report Features | Description |
|---|---|
| Market Value (2025) | USD 73.4 Bn |
| Forecast Revenue (2035) | USD 120.0 Bn |
| CAGR (2026-2035) | 5.0% |
| Base Year for Estimation | 2025 |
| Historic Period | 2020-2024 |
| Forecast Period | 2026-2035 |
| Report Coverage | Revenue Forecast, Market Dynamics, Competitive Landscape, Recent Developments |
| Segments Covered | By Fuel Source (Pipeline Natural Gas, Liquefied Natural Gas (LNG), and Others (CNG, Biogas)), By Power Output (Up to 50 MW, 51–200 MW, 201–500 MW, 501–1000 MW, and Above 1000 MW), By End-User (Power Utilities, Industrial, Commercial, and Residential) |
| Regional Analysis | North America – The US & Canada; Europe – Germany, France, The UK, Spain, Italy, Russia & CIS, Rest of Europe; APAC– China, Japan, South Korea, India, ASEAN & Rest of APAC; Latin America– Brazil, Mexico & Rest of Latin America; Middle East & Africa– GCC, South Africa, & Rest of MEA |
| Competitive Landscape | GE Vernova Inc., Siemens Energy AG, Mitsubishi Heavy Industries, Ltd., Wärtsilä Corporation, Caterpillar Inc., Ansaldo Energia S.p.A., Kawasaki Heavy Industries, Ltd., Tecogen, Inc., Cummins Inc., Generac Power Systems, Inc., Kohler Co., Clarke Energy, Bechtel Corporation, Fluor Corporation, Worley Limited, Others. |
| Customization Scope | Customization for segments, region/country-level will be provided. Moreover, additional customization can be done based on the requirements. |
| Purchase Options | We have three licenses to opt for: Single User License, Multi-User License (Up to 5 Users), Corporate Use License (Unlimited Users and Printable PDF) |





































