
Quick Navigation
- Company Overview
- History of Unilever PLC
- Environmental, Sustainability, and Supply-Chain Performance Highlights
- Unilever Financial Analysis Statistics
- Unilever Geographic Statistics Revenue Analysis
- Unilever Market-Based Turnover Performance Statistics
- Unilever Segmental Analysis Statistics
- Unilever Category-Level Revenue Contribution Statistics
- Unilever Age-Based Workforce Distribution Statistics
- Unilevers Patents
- Recent Developments
Company Overview
Unilever Statistics: Unilever PLC is a global manufacturer and supplier of fast-moving consumer goods with a diverse portfolio spanning food, beverages, beauty and personal Care, home care, and health-focused products such as vitamins, siminerals, and supplements Sunlight,. Its brands include Clear, Dermalogica, Sunsilk, Horlicks, Pond’s, Rexona, Cornetto, Hellmann’s, Ben & Jerry’s, Wall’s,Knorr, Magnum, Axe, Dove, Lifebuoy, Lux, Domestos, Omo, Equilibra, and Nutrafol. The company distributes its products through a broad network of brick-and-mortar retailers, small family-owned shops, online platforms, and value retail channels.
Unilever operates through 5 core business segments: Personal Care, Home Care, Beauty & Wellbeing, Foods (previously Nutrition), and Ice Cream. The Beauty & Wellbeing segment includes hair care, skin care, and Prestige Beauty ranges, while Personal Care focuses on skin cleansing, deodorants, and oral-care products. Home Care encompasses fabric care and household cleaning solutions. The Foods segment covers cooking aids, seasonings, condiments, and foodservice offerings through Unilever Food Solutions. The Ice Cream segment comprises the company’s global ice cream portfolio.
Regional Overview
With a presence in more than 190 countries, Unilever maintains one of the highest household penetration levels globally. Its brands are used 3.4 billion times every day, supported by a strong marketing capability and significant annual brand-building investment of €9.4 billion.
Companies’ operations are supported by 7 global operational hubs that enhance efficiency across the full value chain. At the same time, the capability to fulfil customer demand is reflected in the 24 million customer orders processed each year. With a strong focus on innovation, more than 5,000 R&D experts drive product superiority, supported by a substantial €987 million investment in research and development. To strengthen fragrance leadership, a planned multi-year investment of €100 million is dedicated to expanding in-house fragrance expertise. Our sustainability agenda is anchored by 15 short- and medium-term goals, contributing to a 72% absolute reduction in Scope 1 and 2 greenhouse gas emissions since 2015. Additionally, digital platforms are enabling 2.58 million small retailers in the value chain to grow and strengthen their businesses.
History of Unilever PLC
- 1850s–1900s: Foundations laid through separate businesses—Lever Brothers in the UK (soap manufacturing) and Jurgens & Van den Bergh in the Netherlands (margarine production).
- 1902: Lever Brothers begin securing raw materials through Lever Pacific Plantations to support expanding soap operations.
- 1908: Jurgens and Van den Bergh form a profit-pooling agreement to strengthen their position in the margarine industry.
- 1911: Lever Brothers establishes their first purpose-built research laboratory at Port Sunlight, enhancing innovation and product testing.
- 1917: Lever Brothers acquires Pears Soap; Jurgens and Van den Bergh set up margarine factories in England, including the long-standing Purfleet site.
- 1922: Lever Brothers purchased Wall’s and initiated Britain’s first factory-made ice cream distribution using tricycles.
- 1926: Lifebuoy launches the Clean Hands Campaign, promoting hygiene and handwashing in schools.
- 1927–1929: Jurgens, Van den Bergh, Centra, and Schicht form Margarine Unie, later acquiring Calvé-Delft (1928) and Hartog’s (1929).
- 1930: Margarine Unie and Lever Brothers officially merge on January 1 to create Unilever, one of Europe’s largest industrial combinations.
- 1930s: Despite the Great Depression, Unilever expands into frozen foods, household cleaning innovations, and new global markets.
- 1938: Vitamin-enriched margarine brands like Stork and Blue Band revitalize consumer confidence and boost demand.
- 1940s: WWII disrupts global operations, leading to decentralised management and stronger local market autonomy.
- 1941: Lifebuoy provides mobile emergency washing services during the Blitz, supporting London communities.
- 1943: Unilever acquires Frosted Foods and Batchelors, gaining early leadership in deep-freezing and convenience foods.
- 1946: Birds Eye introduces the first frozen peas in the UK, helping establish Unilever’s long-term presence in frozen foods.
- 1950s onward: Unilever expands globally across foods, personal Care, home care, beverages, and beauty, becoming one of the world’s largest FMCG companies.
(Source: Company Website)
Environmental, Sustainability, and Supply-Chain Performance Highlights
- Material nature-related influences, dependencies, and risks are addressed mainly in the upstream value chain through existing policies and codes.
- The company does not maintain a dedicated biodiversity and ecosystem protection policy for operational sites near sensitive biodiversity areas.
- Policies such as the Unilever Code, Environmental Policy, People & Nature Policy, and Sustainable Agriculture Principles support traceability, sourcing management, and biodiversity maintenance.
- Unilever does not implement specific sustainable oceans or seas policies because it sources only minimally from marine environments.
- The sustainability agenda is supported by 15 short- and medium-term goals focused on environmental and social priorities.
- A total of 17 new regenerative agriculture projects were implemented in 2024, bringing the total to 23 since 2021.
- These regenerative agriculture initiatives cover nearly 130,000 hectares across 11 countries, with plans to expand to more than 200,000 hectares by 2025.
- The regenerative agriculture framework uses an MRV (Measure, Report, Verify) system that tracks biodiversity, climate, and ecosystem metrics annually.
- In 2024, 79% of key crops were sourced sustainably, comprising 63% physically sustainable sources and 16% sustainability credits.
- Unilever aims to reach 95% sustainable sourcing of key crops by 2030.
Moreover
- Updated Sustainable Agriculture Principles include strengthened requirements for environmental management, human rights, climate compliance, traceability, and regenerative practices.
- In 2024, 95% of the order volumes for palm oil, paper and board, tea, soy, and cocoa were verified as deforestation-free under Unilever’s sourcing criteria.
- Since 2021, the company has invested €218 million in Unilever Oleochemical International to transform the palm supply chain and support independent mills and smallholder programmes.
- Around 12,500 smallholders across Indonesian provinces were trained in 2024 as part of Unilever’s smallholder hub initiative.
- Over 20 independent mills are being onboarded to strengthen traceability between smallholders and Unilever’s supply chain.
- Three new protection and restoration programmes were implemented in 2024, bringing the cumulative number to 13 since 2021.
- These programmes now cover approximately 425,000 hectares, primarily in Southeast Asia, and integrate Indigenous knowledge into mapping, land-use assessment, and forest management.
- All conservation actions contribute toward the long-term target of protecting and restoring 1million hectares by 2030.
(Source: Unilever PLC)
Unilever Financial Analysis Statistics
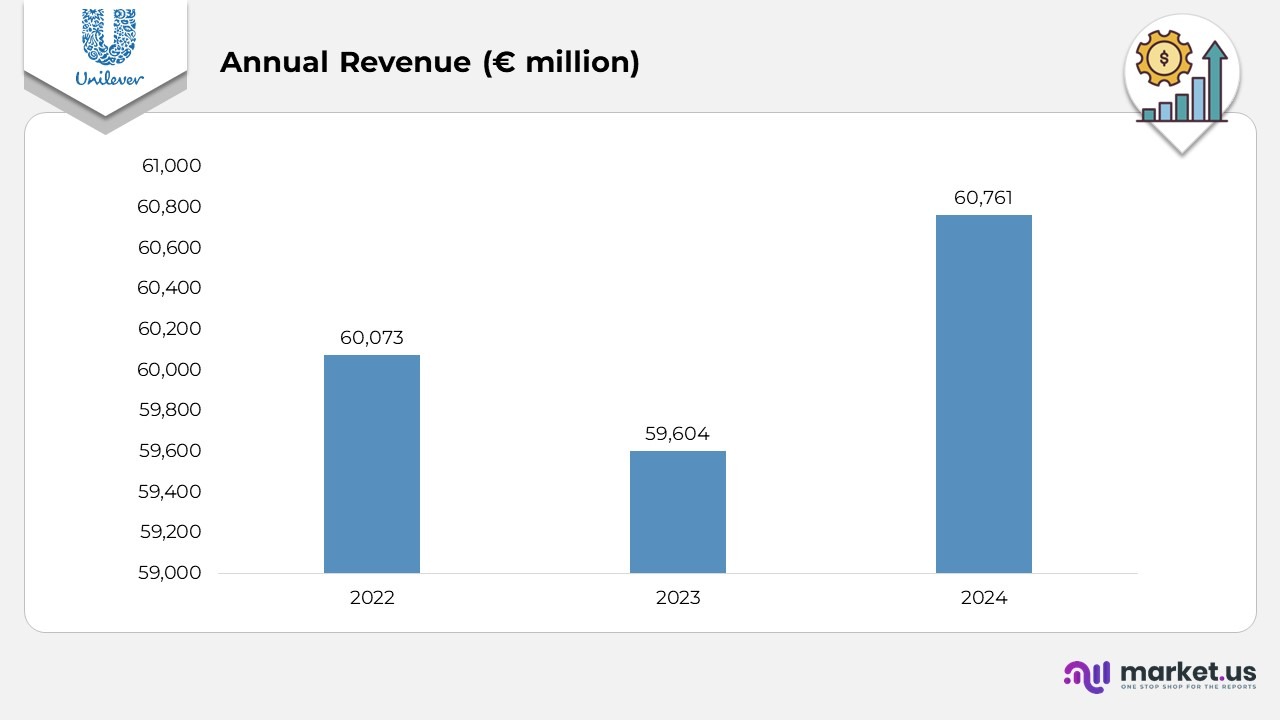
- Revenue in 2022 stood at 60,073 EUR million, forming the baseline for subsequent performance comparisons.
- In 2023, revenue decreased to 59,604 EUR million, marking a YoY decline of 469 EUR million, reflecting softer demand and external market pressures.
- By 2024, revenue rebounded to 60,761 EUR million, up 1,157 EUR million YoY from 2023, signalling recovery and stronger operational momentum.
- Comparing 2024 to 2022, the company achieved a net two-year increase of 688 EUR million, indicating overall positive growth despite interim fluctuations.
- Turnover rose 1.9% to €60.8 billion, reflecting steady topline expansion.
- Underlying sales grew 2%, supported by a 2.9% increase in volumes, with all Business Groups delivering positive momentum; Power Brands continued to drive performance with 5.3% USG.
- Gross margin improved by 280 bps to 0%, enabling stronger brand-building investment equivalent to 15.5% of turnover.
- Underlying operating profit reached €11.2 billion, representing a 6% increase, while reported operating profit totalled €9.4 billion.
- Cash conversion stood at 106%, supported by free cash flow generation of €6.9 billion.
- Underlying earnings per share advanced 7%, whereas diluted EPS declined 10.6%, influenced by non-operational factors.
(Source: Unilever PLC)
Unilever Geographic Statistics Revenue Analysis
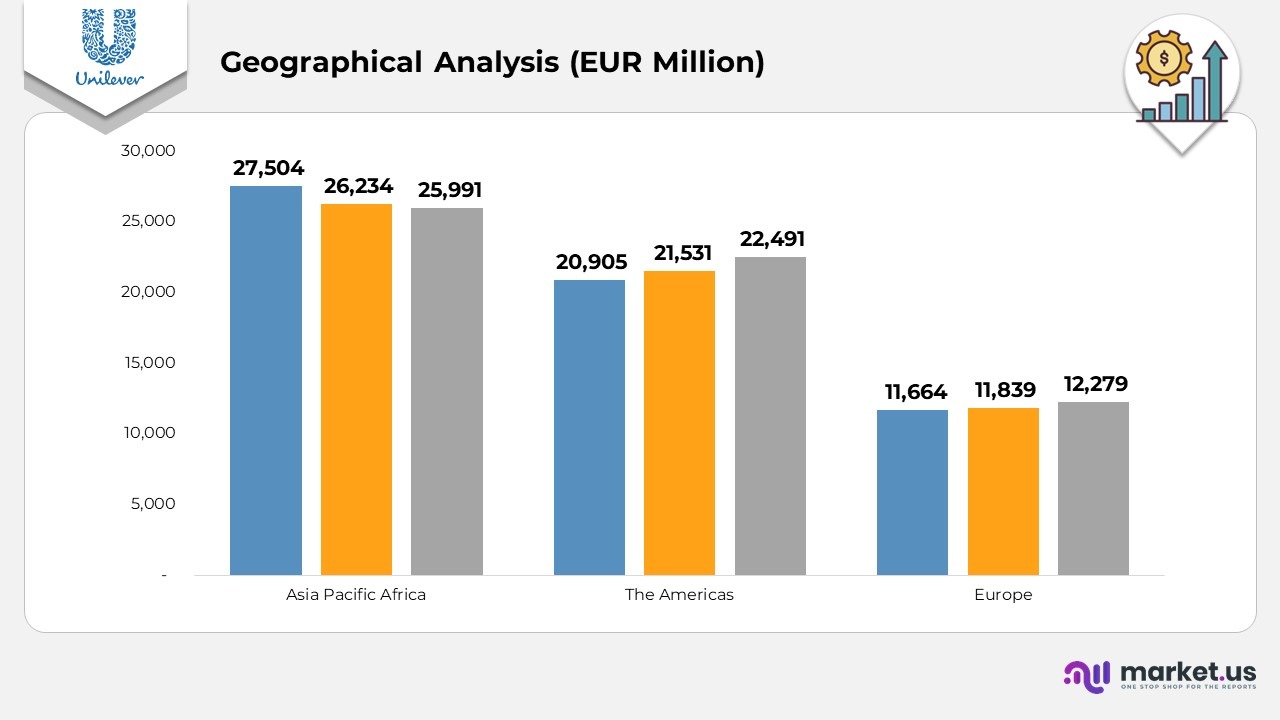
- Asia Pacific Africa delivered revenues of €25,991 million in 2024, a YoY decline of €243 million from 2023, and a larger drop of €1,513 million compared with 2022, reflecting market normalization after earlier highs.
- The Americas recorded €22,491 million in 2024, up €960 million YoY from 2023 and €1,586 million versus 2022, indicating strong consumer demand and resilient pricing.
- Europe generated €12,279 million in 2024, marking a YoY improvement of €440 million from 2023, and an increase of €615 million compared with 2022, supported by a steady recovery across key categories.
(Source: Unilever PLC)
Unilever Market-Based Turnover Performance Statistics
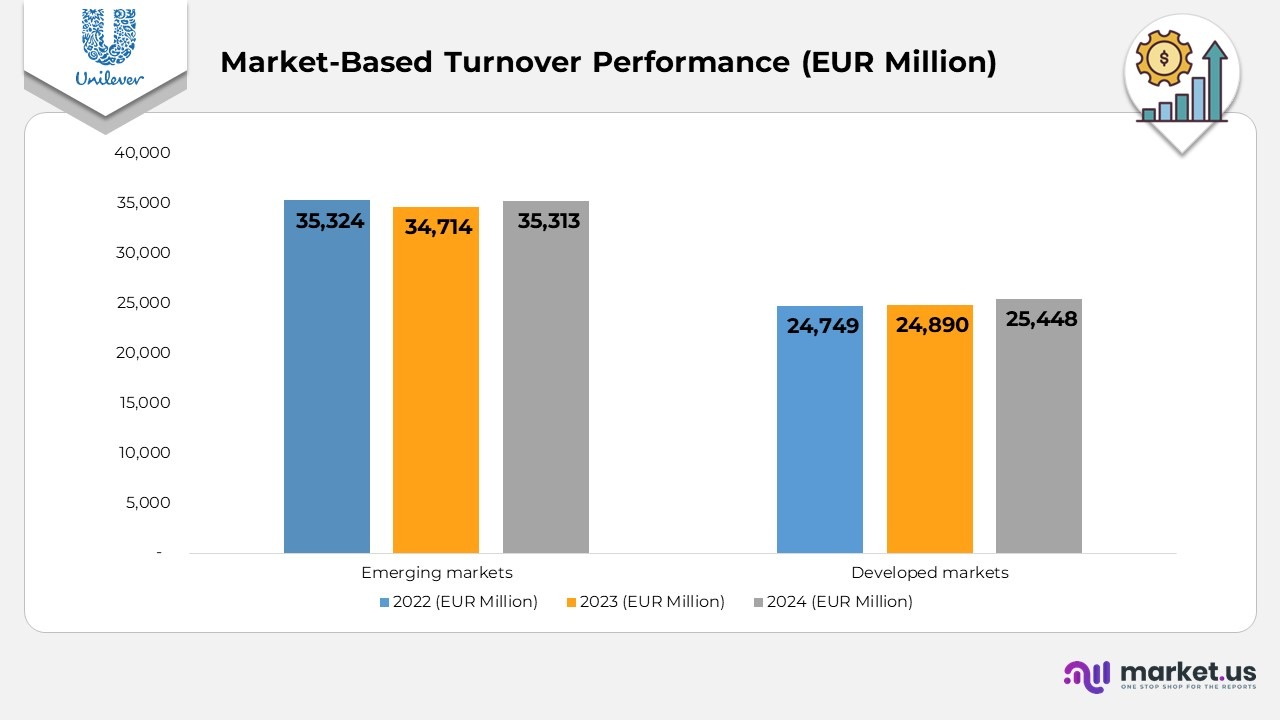
- Emerging markets generated €35,313 million in turnover in 2024, reflecting continued strength across high-growth regions and an increase from 2023, when turnover reached €34,714 million.
- Developed markets delivered €25,448 million in turnover in 2024, improving from €24,890 million recorded in 2023, supported by stable consumer demand and resilient category performance.
- Compared with 2022, emerging markets remained broadly stable, moving from €35,324 million to €35,313 million, while developed markets increased from €24,749 million to €25,448 million, signalling incremental recovery and improved pricing dynamics.
(Source: Unilever PLC)
Unilever Segmental Analysis Statistics
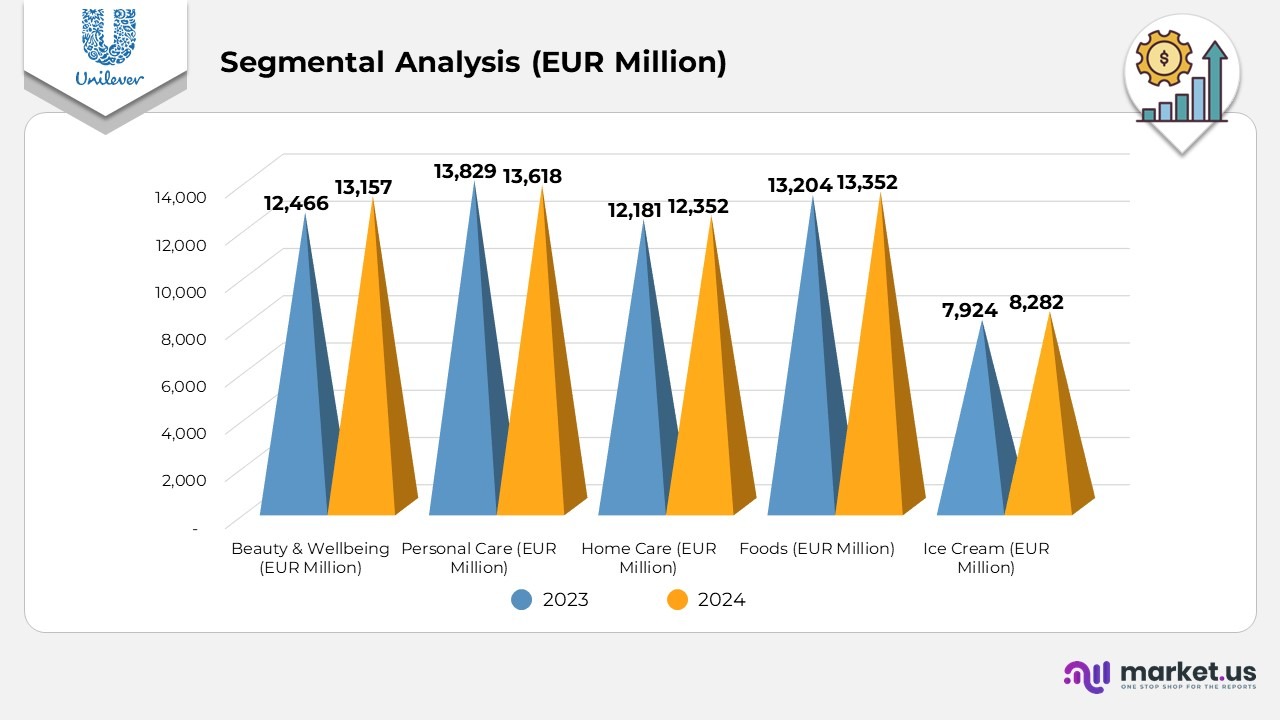
- Beauty & Wellbeing turnover increased from €12,466 million in 2023 to €13,157 million in 2024, reflecting stronger demand in premium beauty and wellbeing categories.
- Personal Care recorded a slight moderation, moving from €13,829 million in 2023 to €13,618 million in 2024, driven by portfolio adjustments and competitive pricing dynamics.
- Home Care delivered higher turnover, rising from €12,181 million in 2023 to €12,352 million in 2024, supported by fabric care and hygiene innovations.
- Food turnover improved from €13,204 million in 2023 to €13,352 million in 2024, supported by stable out-of-home demand and solid retail performance.
- Ice Cream achieved significant growth, increasing from €7,924 million in 2023 to €8,282 million in 2024, driven by stronger seasonal sales and brand-led innovations.
Beauty & Wellbeing
- Turnover reached €13.2bn in 2024, compared with €12.5bn in 2023 and €12.3bn in 2022, reflecting steady category expansion.
- Turnover growth strengthened to 5% in 2024, recovering from 1.8% in 2023 and contrasting with the very high 20.8% seen in 2022.
- Underlying sales grew 5% in 2024, moderating from 8.3% in 2023 but holding above the 7.8% pace recorded in 2022.
- Operating margin eased to 0% in 2024, down from 17.7% in 2023 and 17.6% in 2022.
- Underlying operating margin improved to 4% in 2024, compared with 18.7% in 2023 and 18.7% in 2022.
Personal Care
- Turnover was €13.6bn in 2024, slightly softer than €13.8bn in 2023 but comparable with €13.6bn in 2022.
- Turnover growth contracted by (1.5%) in 2024, following 4% growth in 2023 and a strong 15.9% in 2022.
- Underlying sales expanded 2% in 2024, below 8.9% in 2023, yet higher than 7.2% in 2022.
- Operating margin remained robust at 1% in 2024, up from 21.4% in 2023 and 16.6% in 2022.
- Underlying operating margin increased to 1% in 2024, rising from 20.2% in 2023 and 19.6% in 2022.
Home Care
- Turnover reached €12.3bn in 2024, consistent with €12.2bn in 2023 and €12.4bn in 2022.
- Turnover growth improved to 4% in 2024 after a (1.8%) decline in 2023 and 17.3% growth in 2022.
- Underlying sales increased 9% in 2024 but were below 5.9% in 2023 and 11.8% in 2022.
- Operating margin stood at 3% in 2024, compared with 11.6% in 2023 and 8.6% in 2022.
- Underlying operating margin improved to 5% in 2024, up from 12.3% in 2023 and 10.8% in 2022.
Foods
- 4bn in 2024, compared with €13.2bn in 2023 and €13.9bn in 2022.
- Turnover growth recovered to 1% in 2024 after a significant (5.0%) drop in 2023, following 6.1% growth in 2022.
- Underlying sales growth registered 6% in 2024, down from 7.7% in 2023 and 8.6% in 2022.
- Operating margin strengthened to 5% in 2024, up from 18.3% in 2023 but below 32.4% in 2022.
- Underlying operating margin increased to 3% in 2024, from 18.6% in 2023 and 17.6% in 2022.
Ice Cream
- Turnover increased to €8.3bn in 2024 from €7.9bn in 2023 and €7.9bn in 2022, driven by stronger seasonal momentum.
- Turnover growth improved to 5% in 2024, up from 0.5% in 2023. Although it remains below the 14.8% recorded in 2022.
- Underlying sales grew 7% in 2024, compared with 2.3% in 2023 and 9.9% in 2022.
- Operating margin stood at 9% in 2024, down from 9.6% in 2023 and 9.6% in 2022.
- Underlying operating margin improved to 8% in 2024, up from 10.8% in 2023 but slightly lower than 11.7% in 2022.
(Source: Unilever PLC)
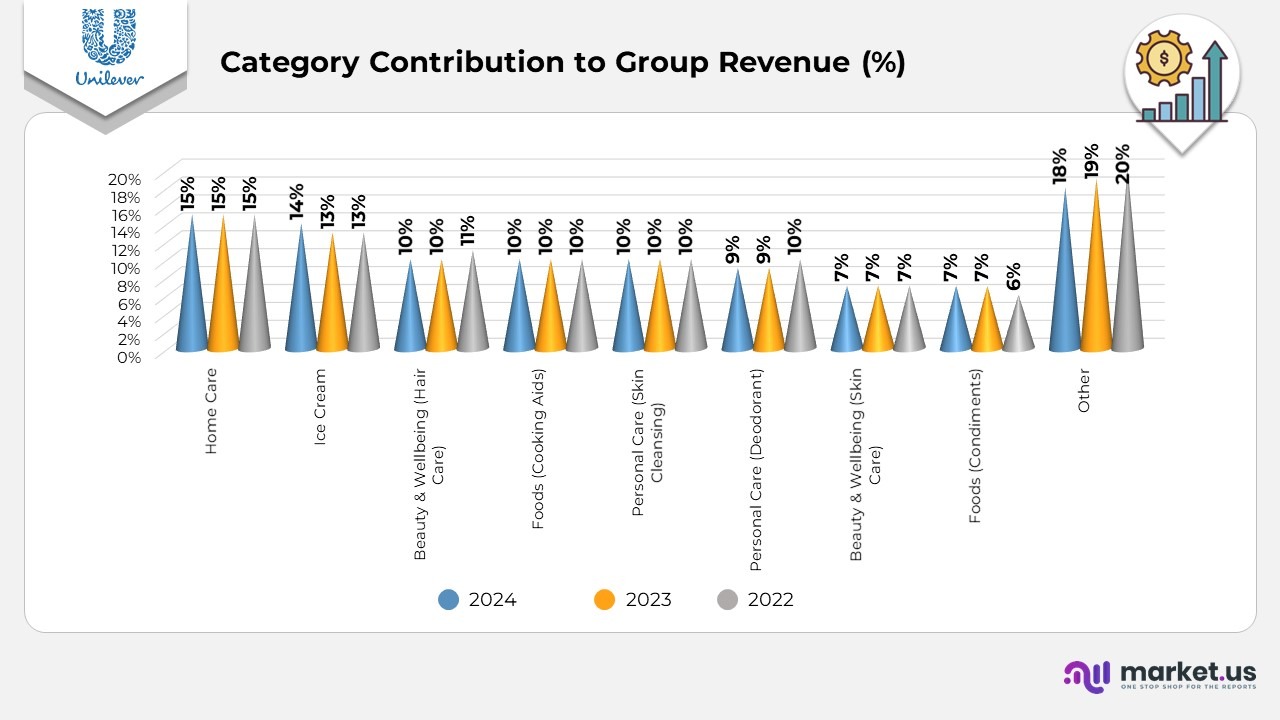
Unilever Category-Level Revenue Contribution Statistics
- Fabric products in the Home Care segment consistently accounted for 15% of Group revenue across 2022, 2023, and 2024, indicating stable performance in fabric care.
- Ice Cream accounted for 14% of revenue in 2024, rising from 13% in both 2023 and 2022. Reflecting strengthening demand and brand-driven growth.
- Hair Care within Beauty & Wellbeing maintained a steady 10% contribution across all three years. Demonstrating resilience and sustained category relevance.
- Cooking Aids, aligned with the Foods segment, delivered a consistent 10% contribution from 2022 to 2024, supported by continued household usage.
- Skin Cleansing in the Personal Care segment remained stable at 10% each year. Driven by core hygiene needs and strong brand penetration.
- Deodorants contributed 9% in 2024, unchanged from 2023 but slightly down from 10% in 2022, reflecting modest category shifts.
- Skin Care, part of Beauty & Wellbeing, held a consistent 7% share across all three years, supported by growing demand in facial and body Care.
- Condiments within Foods contributed 7% in 2024 and 2023, slightly higher than 6% in 2022. showing a gradual recovery and consumer engagement.
- The “Other” category accounted for 18% in 2024, down from 19% in 2023 and 20% in 2022. Indicating portfolio rationalization and category-mix effects.
(Source: Unilever PLC)
Unilever Age-Based Workforce Distribution Statistics
- The company employs 21,635 individuals aged under 30, representing 18% of the total workforce and reflecting a strong base of early-career talent.
- The largest age group is 30–50 years, comprising 78,113 employees and accounting for 65% of the total headcount, highlighting a predominantly mid-career workforce.
- Employees aged over 50 total 19,970, contributing 17% to overall representation and underscoring continued experience and tenure within the organisation.
- A small group of 322 employees (0.2%) falls into the unknown age category, mainly due to incomplete demographic data.
- The total workforce for 2024 is 120,040, representing the entire employee base across global operations.
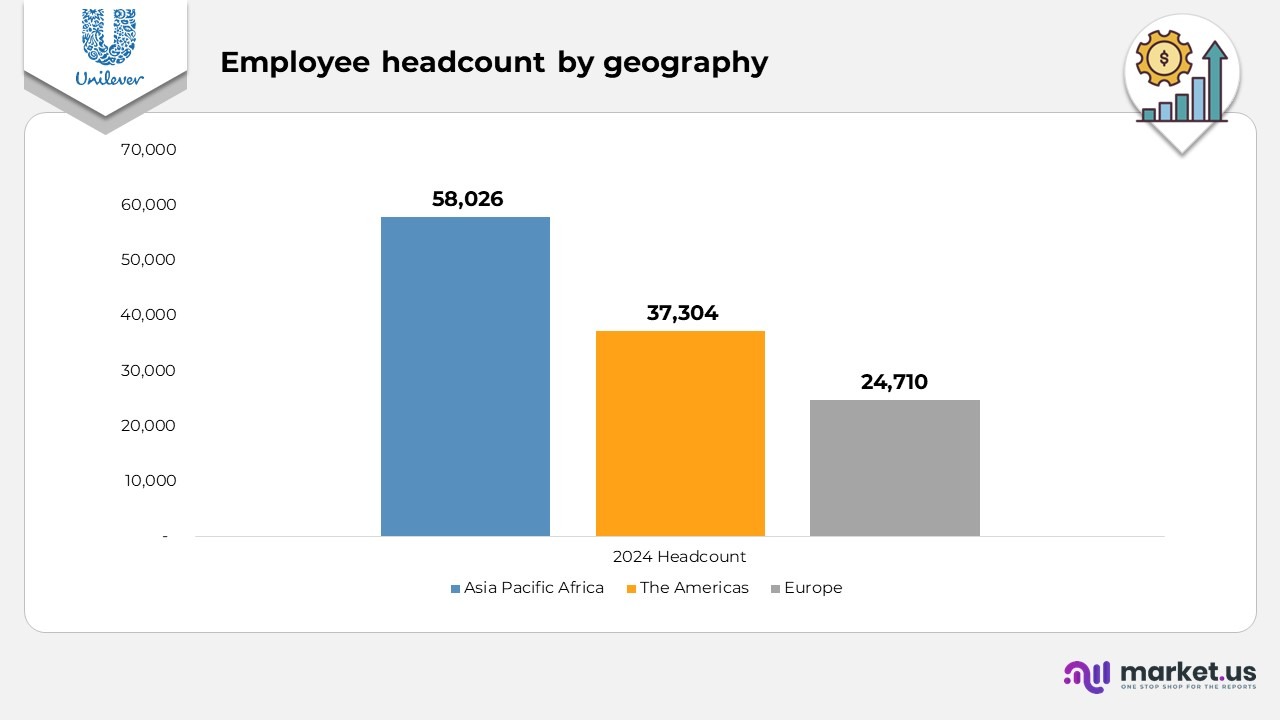
- Asia Pacific Africa accounted for 58,026 employees, representing the largest geographic share of the company’s global workforce.
- A total of 37,304 employees are based across North and South America, reflecting strong regional operational presence.
- The European region employs 24,710 individuals, forming an important part of Unilever’s mature-market workforce.
- Combined, these regions account for 120,040 employees as of 2024.
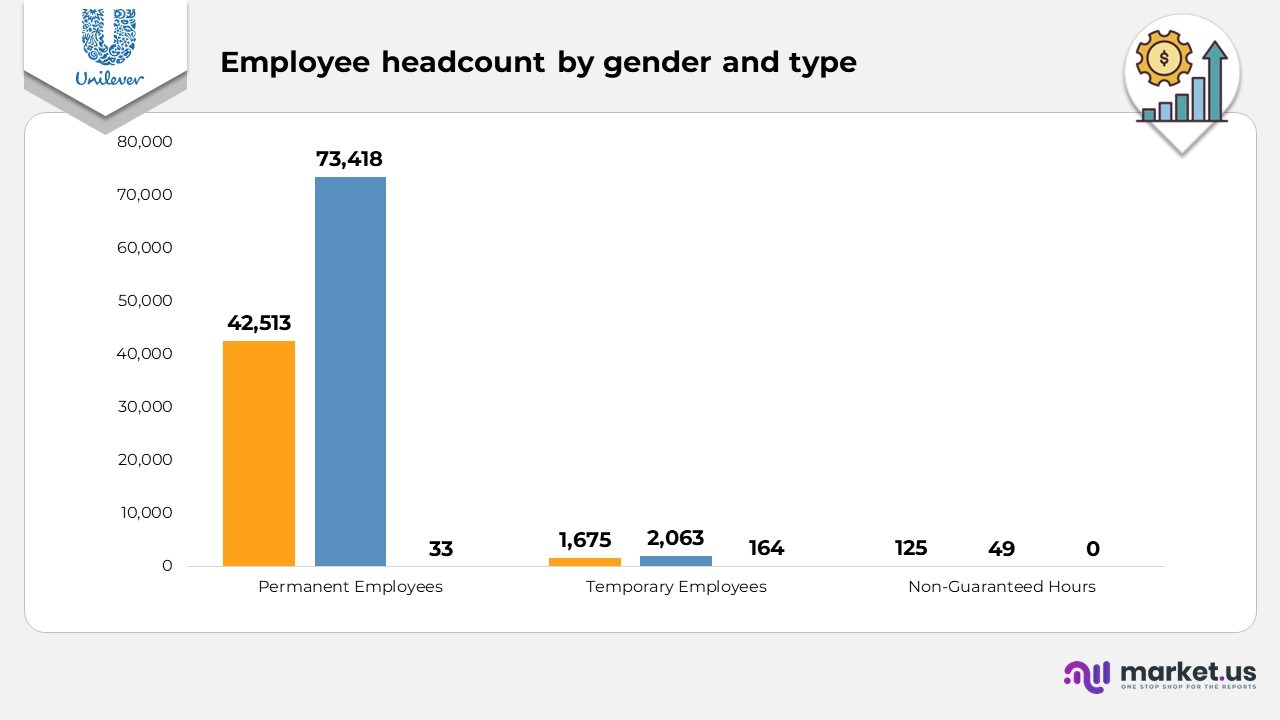
- The permanent workforce includes 42,513 female employees, 73,418 male employees, and 33 employees whose gender was not reported, for a total of 115,964.
- Temporary employment includes 1,675 female workers, 2,063 male workers, and 164 not-reported cases, for a total temporary workforce of 3,902.
- Within the non-guaranteed hours category, the company employs 125 female workers, 49 male workers, and 0 unreported cases, totalling 174 non-guaranteed hours employees.
- Across all employment categories, the company’s overall workforce totals 120,040
(Source: Unilever PLC)
Unilevers Patents
| Publication Number | Title | Type | Filed Date | Publication Date |
|---|---|---|---|---|
| 20230390175 | Hair Care Composition | Application | December 21, 2021 | December 7, 2023 |
| 20220211596 | Personal Care Compositions with Glutathione Precursor | Application | January 31, 2022 | July 7, 2022 |
| 20200179338 | 4-(4-chlorophenyl)-5-methylene-pyrrol-2-one for Bacterial Infections | Application | July 13, 2017 | June 11, 2020 |
| 20200000139 | Process of Compacting a Microporous Fat Powder | Application | June 29, 2018 | January 2, 2020 |
| 20190209544 | Antimicrobial Compositions for Topical Use | Application | May 4, 2017 | July 11, 2019 |
| 20190062675 | Manganese Bleach Catalyst Granules | Application | March 13, 2017 | February 28, 2019 |
| 20180343884 | Preparing Fat Continuous Emulsions (Midstock/Cream) | Application | November 3, 2016 | December 6, 2018 |
| 20180332868 | Preparing Fat Continuous Emulsions | Application | November 8, 2016 | November 22, 2018 |
| 20180325137 | Preparing Low-Fat Water-in-Oil Emulsions | Application | November 8, 2016 | November 15, 2018 |
| 20180153187 | Preparing Fat Slurries | Application | May 2, 2016 | June 7, 2018 |
| US 9888700 | Structured Oil Phase Preparation | Grant | September 24, 2013 | February 13, 2018 |
| 20170251690 | Preparing Fat Slurry & Spread | Application | October 9, 2015 | September 7, 2017 |
| 20170251689 | Preparing Fat Slurry (Reduced Pressure) | Application | September 18, 2015 | September 7, 2017 |
| 20170231242 | Edible Aerated Water-in-Oil Emulsions | Application | October 9, 2015 | August 17, 2017 |
| US 9661864 | Spreadable Dispersion Preparation | Grant | December 29, 2014 | May 30, 2017 |
| 20170086470 | Water-in-Oil Emulsion Manufacture | Application | April 14, 2015 | March 30, 2017 |
| 20170042173 | Liquid Edible Frying Medium | Application | March 10, 2015 | February 16, 2017 |
| US 9504971 | Mixing Apparatus for Edible Dispersions | Grant | August 17, 2012 | November 29, 2016 |
| 20160295880 | Food with Improved Aroma and Taste | Application | November 14, 2014 | October 13, 2016 |
| US 9359585 | Reactive Skin Care & Cleansing Compositions | Grant | December 8, 2003 | June 7, 2016 |
(Source: Justia Patents)
Recent Developments
- In May 2025, Unilever announced a £80 million investment to strengthen its in-house fragrance capabilities in the UK, including the development of a new advanced fragrance facility in Port Sunlight, expansion of digital innovation capabilities, and recruitment of top global fragrance specialists.
- In April 2025, the company entered a partnership with World Rugby’s flagship tournaments, enabling its Personal Care brands to run integrated, multi-market campaigns engaging both fans and athletes across all Rugby World Cups through 2029.
- Also in April 2025, the company acquired Wild, a fast-growing personal care brand, further aligning its portfolio with premium and high-growth categories under the Growth Action Plan 2030.
- In February 2025, the company expanded its commitment to women’s sports by sponsoring the UEFA Women’s EURO 2025, building on the momentum from the UEFA EURO 2024 campaign, which spanned 16 brands, 24 markets, and activation across 126,000+ stores.
- In January 2025, the company acquired Minimalist, reinforcing the strategic transformation of its Beauty & Wellbeing division toward high-demand, rapidly expanding product segments.
(Source: Unilever PLC Press Release)