
Quick Navigation
- Introduction
- Editor’s Choice
- General Mobile App Statistics and Facts
- Mobile App Market Statistics
- Statistics of Mobile App Usage
- Mobile App Usage for Android Apps
- Mobile App Usage for Apple (iOS) Apps
- Revenue Statistics of Mobile Apps
- Mobile App Download Statistics
- Mobile App Downloads Statistics by Platform
- Users and Behaviours of Mobile Apps
- Mobile App Fun Facts
- Recent Developments
- Mobile App Future Predictions
- Conclusion
Introduction
Mobile App Download and Usage Statistics: The mobile application market is vast and continuously growing, boasting billions of downloads and trillions in market capitalisation, fueled by the widespread adoption of smartphones and significant daily user engagement. Although app downloads are on the rise, user retention poses a significant challenge, as many individuals utilise an app only once, underscoring the importance of user experience and retention strategies for achieving success.
The industry is progressively monetised through in-app purchases, subscriptions, and advertising, particularly for free applications. In 2024, it is estimated that around 137.8 billion applications were downloaded worldwide, with Google Play representing the majority of these downloads. Consumers allocated over $935 billion towards mobile applications in 2024, and the typical user engages with approximately 9 applications each day.
Editor’s Choice
- Android is the most prevalent operating system, commanding a market share of 71.7% in 2024.
- In 2021 alone, 2 million new applications were introduced.
- In 2024, the cumulative mobile app downloads across the Google Play and App Store platforms reached 136 billion, indicating a 1% decrease from the previous year.
- There are approximately 2,325,565 Android applications available on Google Play.
- There are 2.08 million applications available for download in the Apple App Store.
- Each year, 255 billion mobile applications are downloaded globally.
- iOS represents 60% of the total revenue in the United States.
General Mobile App Statistics and Facts
- Android is the most prevalent operating system, commanding a market share of 71.7% in 2024.
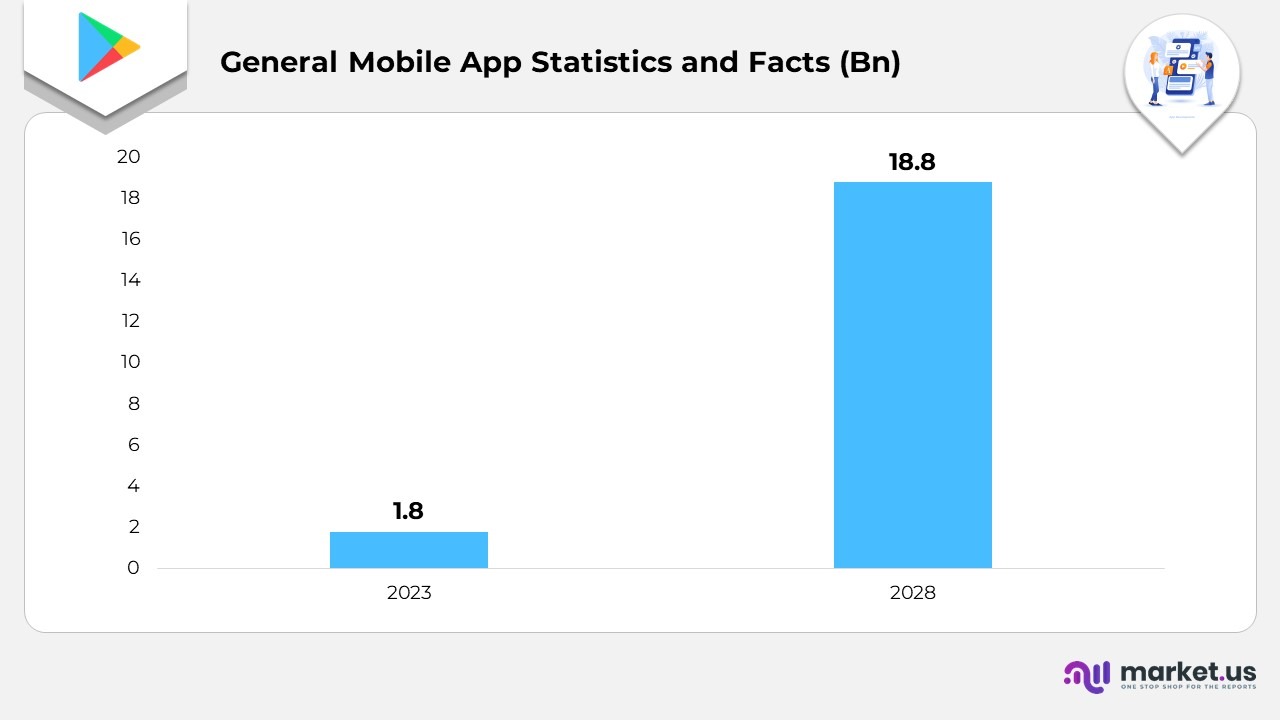
- The artificial intelligence application sector generated a revenue of $1.8 billion in 2023 and is anticipated to reach $18.8 billion by 2028.
- A total of 233 million users interact with AI mobile applications, with the majority utilising chatbots or photo editing tools.
- Between the years 2023 and 2024, ChatGPT achieved 209 million downloads, establishing itself as the most downloaded chatbot application.
- Between 2019 and 2022, the duration spent on mobile applications by users worldwide increased by 46%.
- From January to May 2024, Candy Crush Saga achieved nearly 46.9 million downloads across both the App Store and Google Play globally, solidifying its status as the most popular gaming application.
- The number of apps available for download has surged by 82% since 2016 on a global scale.
- In February 2024, approximately 52,000 mobile applications were launched on the Google Play Store.
- In 2023, global mobile app downloads reached 257 billion, indicating a 1% annual growth.
- In February 2024, around 37,000 mobile applications were introduced on the Apple App Store.
- The United States ranked third in total mobile app downloads in 2023.
- In 2023, China dominated the mobile app market, generating nearly 52 billion US dollars in app spending.
- The Asia-Pacific region has the largest mobile gaming population in the world, with over 1.3 billion gamers, followed by Europe, Latin America, and North America.
Mobile App Market Statistics
- In 2021 alone, 2 million new applications were introduced.
- Mobile advertising expenditure exceeds $350 billion.
- Globally, there are over 2.6 billion users of mobile gaming.
- The mobile gaming industry is projected to surpass $116 billion by 2024.
- Asia has the largest number of mobile gaming users, totaling nearly 1.3 billion, followed by Europe with 550 million, Latin America with 309 million, and North America with 207 million.
- A significant 94% of iOS applications are offered for free.
- In the Google Play Store, 97% of Android applications are available at no cost.
- There are 2.3 million applications that can be downloaded from app stores in China.
- From 2018 to 2022, the number of applications in Chinese app stores fell from 4.5 million to 2.3 million, marking a 48% decline.
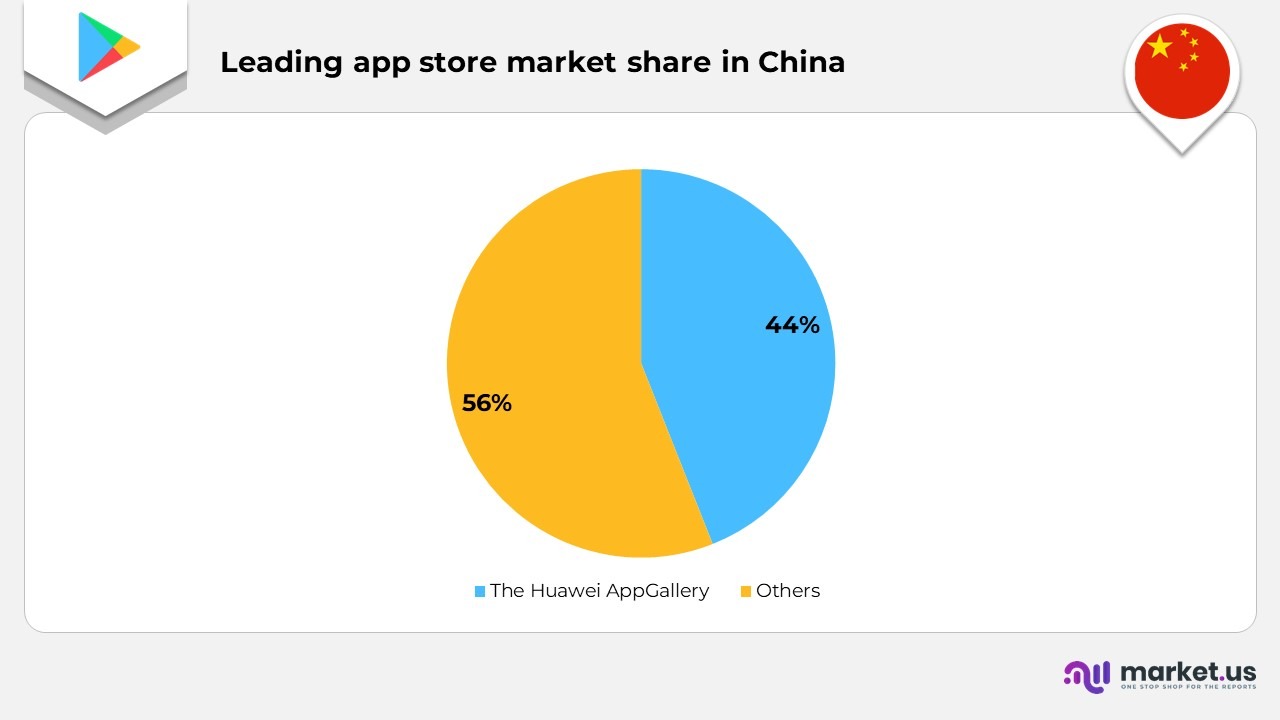
- The Huawei AppGallery holds the position of the leading app store in China, commanding a market share of 44%.
- Gaming applications represent 28% of the total apps available in China.
Statistics of Mobile App Usage
- A majority of consumers (55%) favour mobile applications as their main method for engaging with brands, completing tasks, and conducting transactions, while 22% utilise both mobile and web platforms.
- In 2024, the cumulative mobile app downloads across the Google Play and App Store platforms reached 136 billion, indicating a 1% decrease from the previous year.
- On average, 65.6% of consumers engage with between 3 and 10 applications daily.
- In 2024, users dedicated an average of 3.5 hours each day to mobile applications, reflecting a 2.9% increase year-over-year.
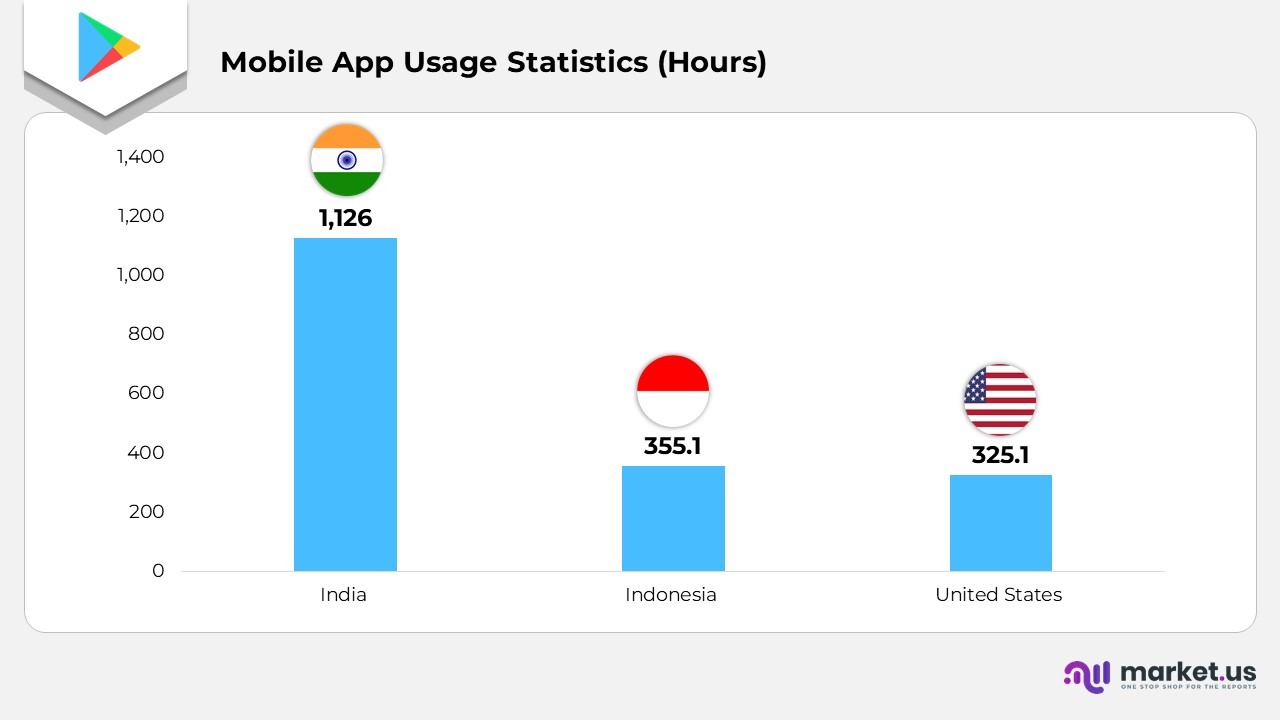
- The leading countries in terms of hours spent on mobile applications in 2024 are India (1.126 trillion hours), Indonesia (355.1 billion hours), and the United States (325.1 billion hours).
Moreover
- Typically, active users have between fewer than 10 to 45 app sessions within a month.
- 51% of mobile phone users check their applications between 1 to 10 times each day, while an additional 25% of users access their apps 11 to 20 times daily.
- Overall, approximately 79% of app downloads and consumer expenditures originated from outside the nation where the app was created. Only users in China, Japan, South Korea, and the United States predominantly preferred applications from local developers.
- In 2024, the peak app download rates were observed during the three autumn months, with Google Play exceeding 10 billion downloads and the App Store surpassing 4 billion.
- Among the primary reasons cited for uninstalling mobile applications, customers mention an excess of in-app advertisements (30%), the app not meeting their expectations (25%), unclear, malfunctioning, or sluggish experiences (19%), an overload of notifications or in-app messages (18%), and switching to an alternative app (18%).
- On average, over 95% of users discontinue use after 30 days, and fewer than 5% of those who remain will subscribe.
Mobile App Usage for Android Apps
- There are approximately 2,325,565 Android applications available on Google Play.
- Among the 2.26 million Android applications on the Google Play Store, 244,917 are categorized as gaming apps, while 1,817,940 are classified as non-gaming applications.
- In the year 2023, the most frequently downloaded Android applications from the Play Store included Meta’s Instagram, Facebook, and WhatsApp.
- The average star rating assigned by users to all Android applications on the Google Play Store is 4.0.
- As of January 2024, close to 114 thousand applications in the Google Play Store have received a rating of 4.5 stars.
- By 2026, it is anticipated that consumers will download 143 million mobile applications from the Google Play Store.
- It is projected that by 2025, there will be 7.49 billion users of Android applications on the Play Store.
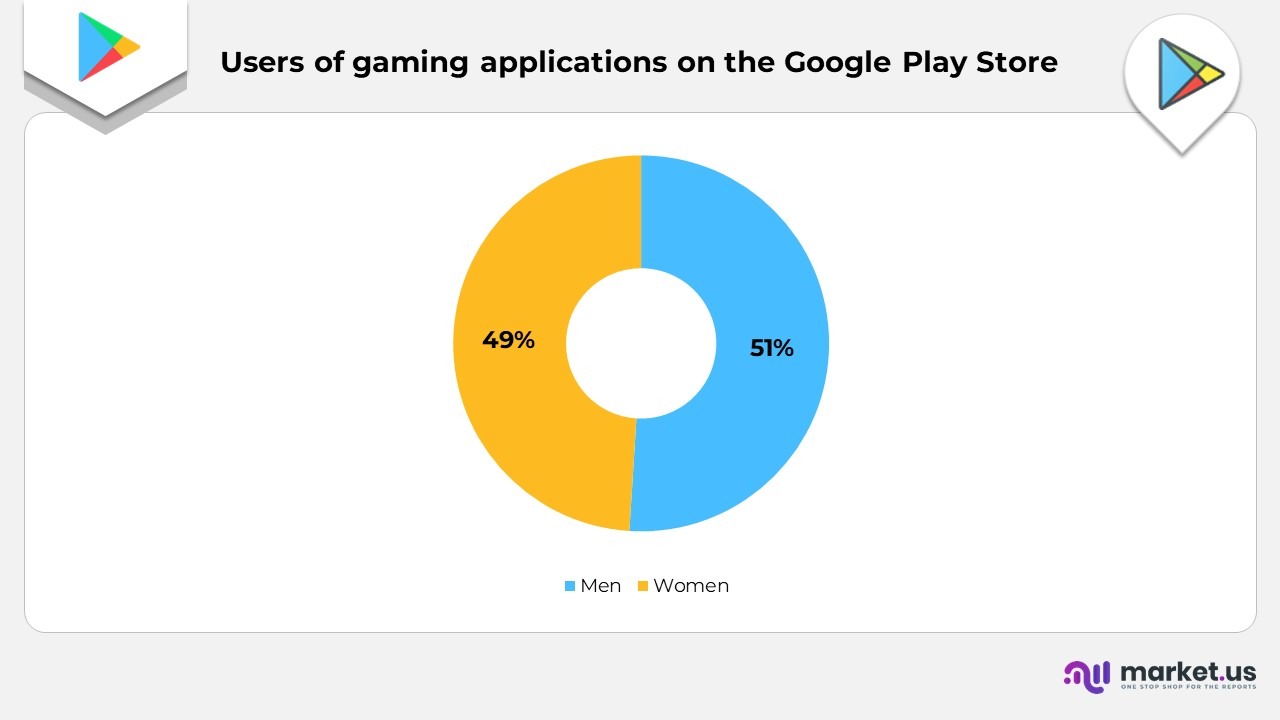
- Almost 49% of the users of gaming applications on the Google Play Store are women.
Mobile App Usage for Apple (iOS) Apps
- There are 2.08 million applications available for download in the Apple App Store.
- To date, approximately 846,054 publishers have released applications on the App Store.
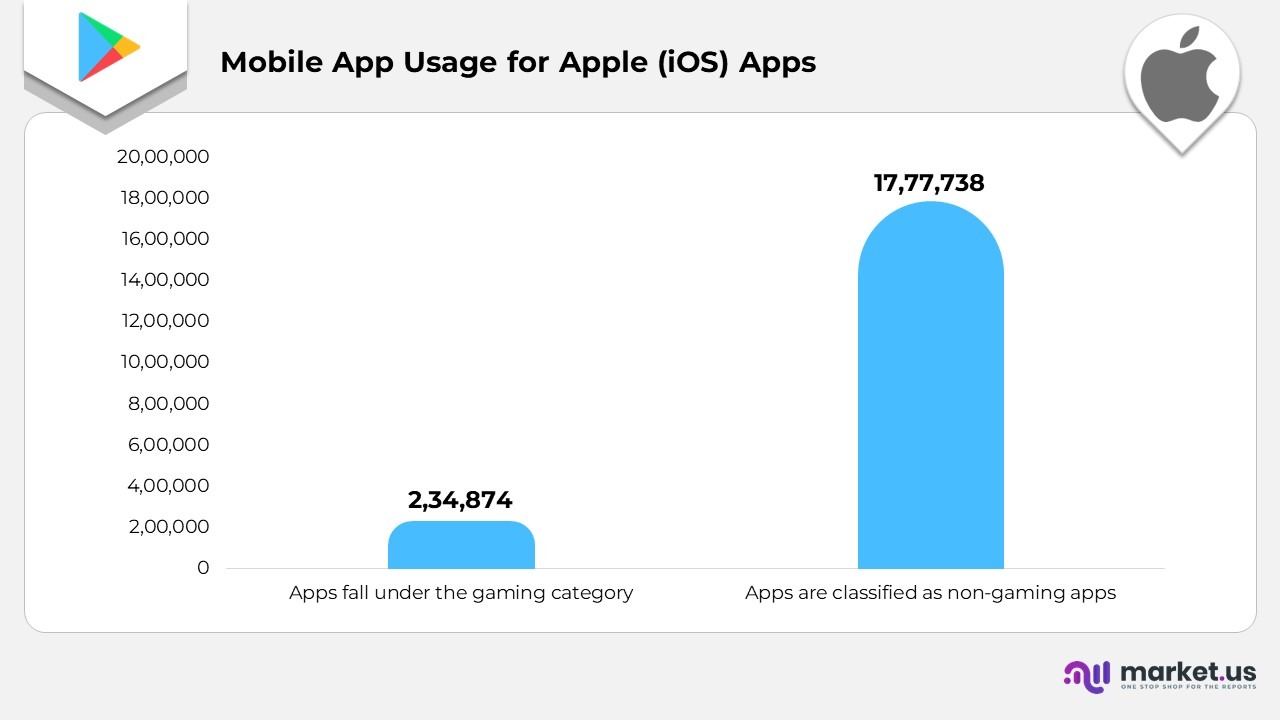
- Among the apps on the App Store, 234,874 fall under the gaming category, whereas 1,777,738 are classified as non-gaming apps.
- As of July 2024, there have been 9 million downloads of iOS apps, with Move to iOS being the most downloaded.
- Each week, over 8,000 new apps are published in the Apple App Store.
- The gaming category remains the most favoured among apps in the App Store.
- Cloud mobile applications are increasingly popular within the App Store, with Google Drive, Dropbox, and Microsoft Office 365 being the most sought-after.
- The estimated cost of an iOS gaming application is 0.47 U.S. dollars, while the overall estimated price for apps and games was 0.73 U.S. dollars as of January 2024.
Revenue Statistics of Mobile Apps
- In the first quarter of 2025, total consumer expenditure on applications from both iPhone and Android users reached approximately $40 billion, indicating an 11% increase in comparison to the same period in 2024.
- Among non-gaming applications, film and television streaming services, along with social media platforms, generated the highest revenue from in-app purchases, each accounting for nearly $12 billion in 2024, reflecting significant global growth.
- Mobile gaming applications constituted the largest share of consumer spending, surpassing $80 billion in 2024; however, the year-over-year growth rate decelerated to around 4%.
- While mobile games continue to be the most lucrative category of applications, generating about 64% of total earnings, the revenue distribution between apps and games in 2024 indicated a slight shift towards apps, showcasing gradual changes in monetization strategies.
- Among all types of applications, six non-gaming apps exceeded $1 billion in global gross revenue in 2024, in contrast to eleven gaming apps, thereby continuing the year-over-year trend in this distribution.
- Generally, it takes 65 days for an application to achieve a monthly revenue of $1,000 and 120 days to reach $5,000, a pattern that remains consistent across most app categories.
Moreover
- In 2024, 44% of total app revenue was derived from subscriptions, while paid app downloads and in-app purchases represented the other leading monetization methods.
- 12% of subscribers who terminated their monthly subscription choose to resubscribe within a year.
- Users show a greater inclination to reactivate monthly subscriptions (11.95%) compared to weekly (9.29%) or annual subscriptions (5.89%).
- After a year of app usage, weekly subscriptions yield a higher user lifetime value (LTV) than monthly subscriptions.
- In 2024, the pricing for subscription plans largely remained unchanged from the previous year, with the cost for 1-week at $4.99, 1-month at $9.99, and both 3-month and 1-year plans starting at $29.99.
- The conversion rate of users following the trial period fell to 37.3% in 2024, indicating a decline of approximately 3% from the prior year.
- On Google Play, 57.64% of advertising traffic was generated by apps, with the Finance category representing 15.86% of the total ad traffic. In the App Store, the majority of ad traffic (71.83%) came from games, with Entertainment being the leading game category at 29.05%.
- Among the various creative asset formats utilized in mobile advertising, video garnered the highest share of ad traffic (51.52%), followed by banners (39.39%) and playables (9.09%).
Mobile App Download Statistics
- Each year, 255 billion mobile applications are downloaded globally.
- From 2016 to 2022, there has been an increase of 82% in the annual number of app downloads.
- The Google Play Store and Apple App Store together account for 35-36 billion app downloads every quarter.
- Mobile games represent the most favored category, achieving nearly 100 billion downloads annually. Following this, mobile photo and video applications come in second, with almost 20 billion downloads.
- On average, a user in the United States downloads between 10 and 12 apps each month.
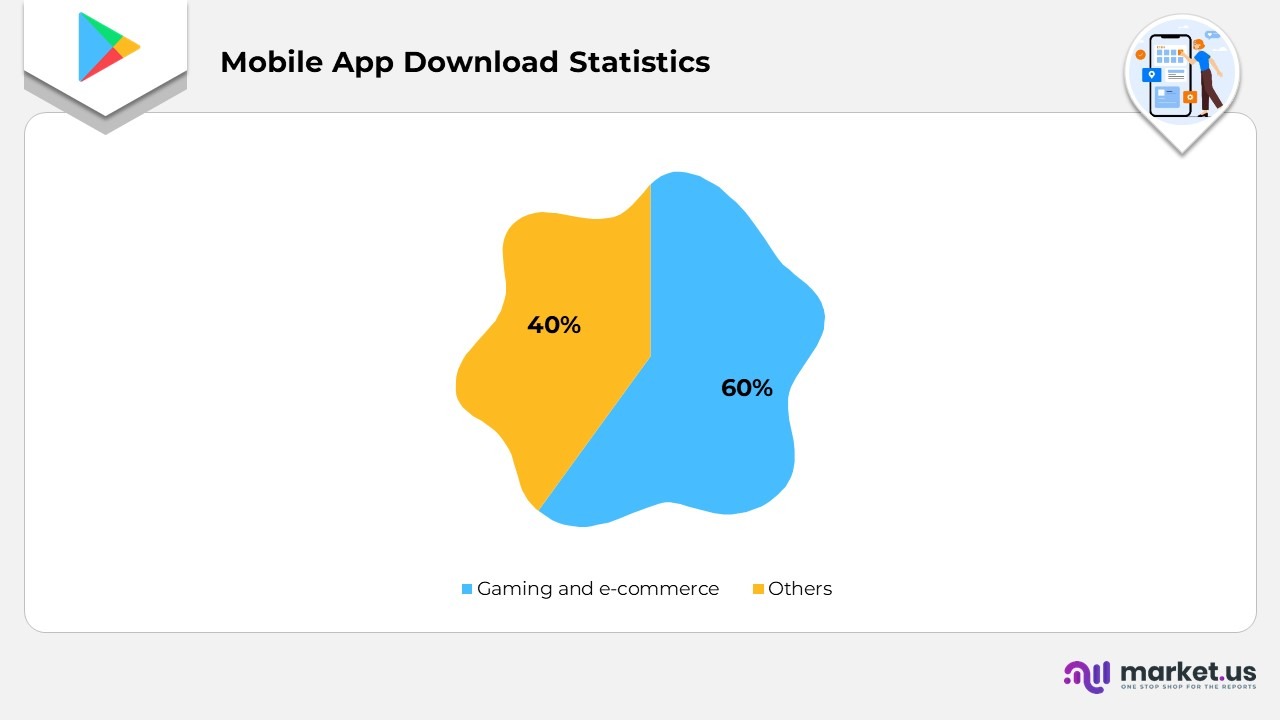
- Gaming and e-commerce applications make up over 60% of new mobile app downloads.
- There is a 12% decline in organic mobile app downloads, which emphasizes the importance of paid acquisition.
- Applications that feature effective onboarding processes enhance retention rates by 45% within the initial week.
- App store optimization (ASO) contributes to 30% of total downloads in the mobile app industry.
Mobile App Downloads Statistics by Platform
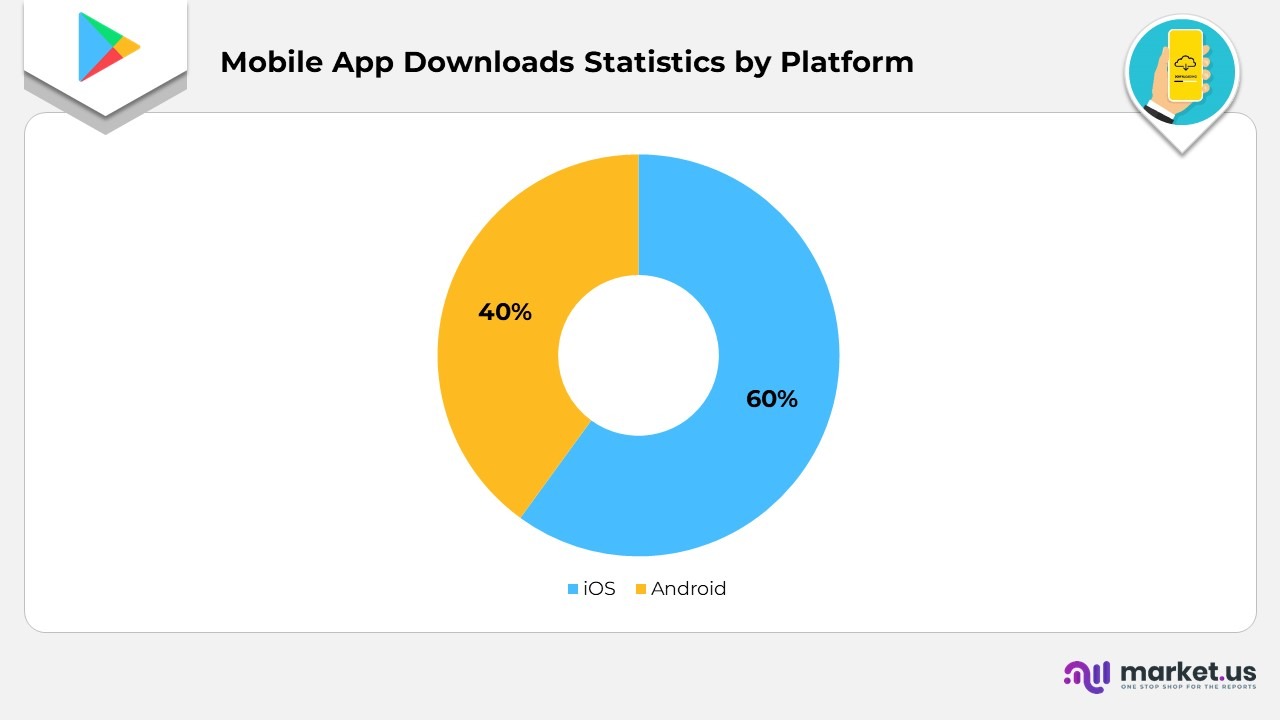
- iOS represents 60% of the total revenue in the United States.
- Statistics on mobile app downloads indicate that Android leads in volume, commanding a 70% share of global mobile app downloads.
- Cross-platform applications are surpassing native applications in cost-effectiveness by 35%.
- Revenue from subscription-based applications increased by 50%, attributed to streamlined onboarding processes and the availability of free trials.
- Users are three times more inclined to download applications that are recommended by peers or influencers.
Users and Behaviours of Mobile Apps
- Amazon is regarded as the most vital mobile application by nearly 35% of millennials. With Gmail following at 30% and Facebook at 29%.
- 25% of applications downloaded by mobile app users globally were utilised only once after installation.
- As of July 2018, only 65.7% of users in the United States had at least 1 gaming application installed on their smartphones.
- YouTube (12.7%), TikTok (17%), and WeChat (19.5%) collectively account for 50% of the time spent on apps.
- 62% of smartphone users choose not to download an application to finalise a transaction.
- A quarter of smartphone users remove applications due to a lack of storage space.
- 71% of app users discontinue usage after three months.
- In 2022, there were 255 billion new app downloads, with an impressive 485,000 apps downloaded every minute last year.
- Users allocate 5 hours each day to mobile devices, which constitutes one-third of their professional hours.
- In 2022, the gaming sector experienced the most significant decline, indicating a rising demand for essential services. Conversely, non-gaming applications have exhibited robust growth despite facing economic challenges.
- Generation Z shows a pronounced commitment to video content, user-generated material, and mindfulness applications.
- On Black Friday, Amazon drew a greater number of active users than the combined total of Walmart and Target.
- Globally, the cumulative time spent on social applications is projected to surpass 2 trillion hours in 2022.
- Over half (56.9%) of the American population is reported to be addicted to their mobile phones.
Mobile App Fun Facts
- The initial application is the game “Snake,” which is priced at $999.99 and solely serves to showcase a gem. The overall count of applications available is in the millions, with billions being downloaded each year.
- Projections for app downloads in 2018 are estimated at 269 billion. Equating to approximately 33 applications for every individual on the planet.
- Facebook holds the record for the most downloaded application in history. Underscoring the significance of social media and its numerous implications for marketers.
- In the past, the most downloaded applications were from Google, specifically YouTube and Google Maps, each surpassing 1 billion downloads.
- The Android Play Store boasts the largest selection of applications available for download, with a total of 2.8 million apps.
- More than 60% of the applications in Apple’s App Store have never been downloaded.
Recent Developments
- Recent advancements indicate that the utilisation of mobile applications continues to rise, propelled by social media, gaming, and entertainment, with 70% of digital media time in the United States attributed to apps.
- The number of downloads remains substantial, exceeding 137.8 billion in 2024, although this marks a minor decline compared to the prior year.
Mobile App Future Predictions
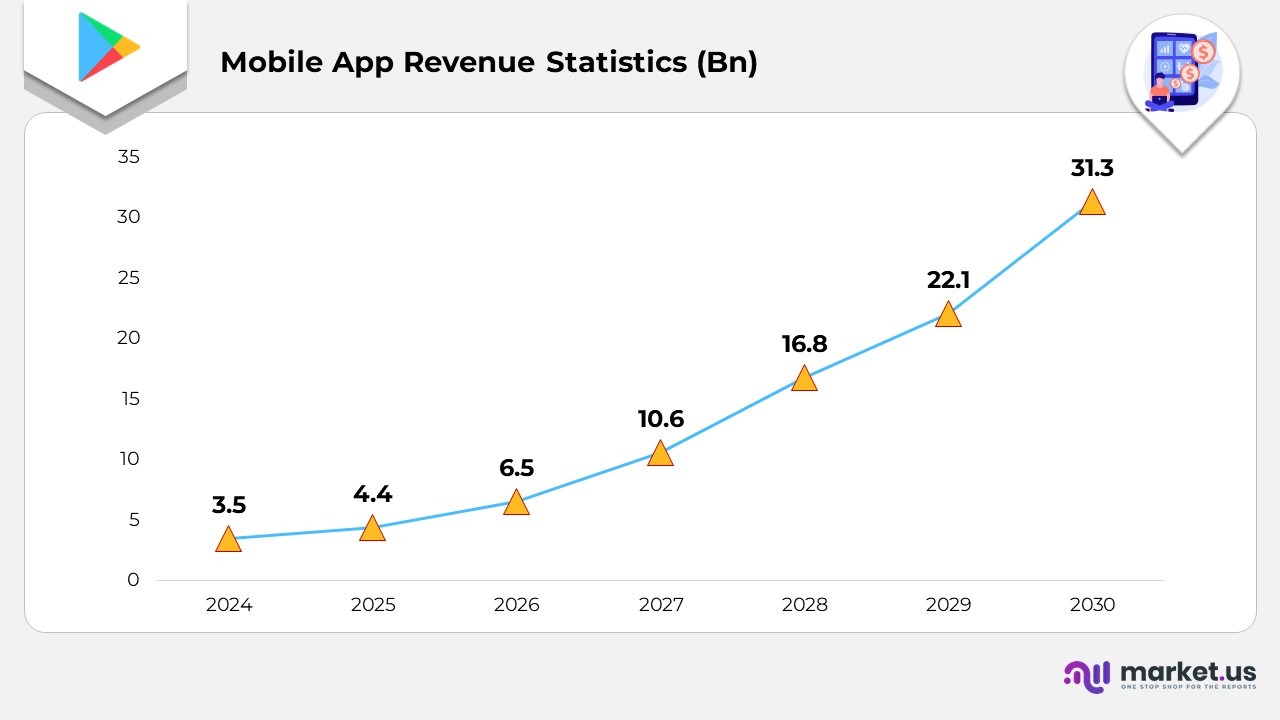
- As consumers have become increasingly inclined to invest in premium features within mobile applications, it is anticipated that their expenditure on apps will surpass that on games, with a compound annual growth rate (CAGR) of 11.1% compared to 4.2% for games by the year 2030.
- Having experienced top-tier digital interactions, consumers now demand that companies facilitate seamless experiences by incorporating technologies such as augmented or virtual reality (55%), bots or virtual assistants (55%), and artificial intelligence applications (59%).
- Voice assistant applications are experiencing significant growth, representing a market share of approximately $6 billion and projected to expand at a CAGR of 30.8% from 2025 to 2034.
- The number of monthly active users engaging with augmented reality (AR) experiences on mobile devices is forecasted to increase to 1.19 billion by 2028.
Conclusion
The utilisation of mobile applications is extensive, characterised by billions of downloads and countless hours of daily engagement, thereby fueling a multi-billion-dollar sector. It can be concluded that applications are crucial to contemporary existence. Offering both convenience and entertainment, however, app stores are saturated with choices, and a significant number of downloaded applications are not retained.
Moreover, the mobile app environment in 2024 presents remarkable statistics that illustrate the swift expansion and evolving trends within the industry. With increasing downloads, heightened user engagement, and growing revenue streams, mobile applications have emerged as vital instruments in our everyday lives.