
Global Wind Turbine Blade Market Size, Share Analysis Report By Blade Length (Upto 50 Meter, Above 50 Meter), By Capacity (Upto 10 MW, Greater than 10 MW), By Deployment (Onshore, Offshore) , By Region and Companies - Industry Segment Outlook, Market Assessment, Competition Scenario, Trends and Forecast 2025-2034
- Published date: Nov 2025
- Report ID: 164777
- Number of Pages: 242
- Format:
-
keyboard_arrow_up
Quick Navigation
Report Overview
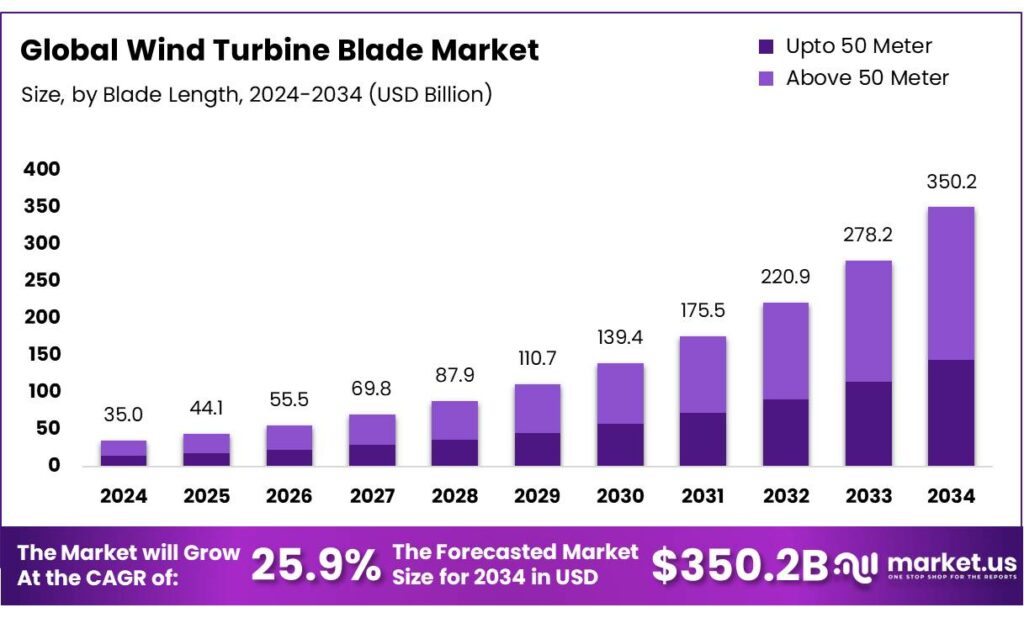
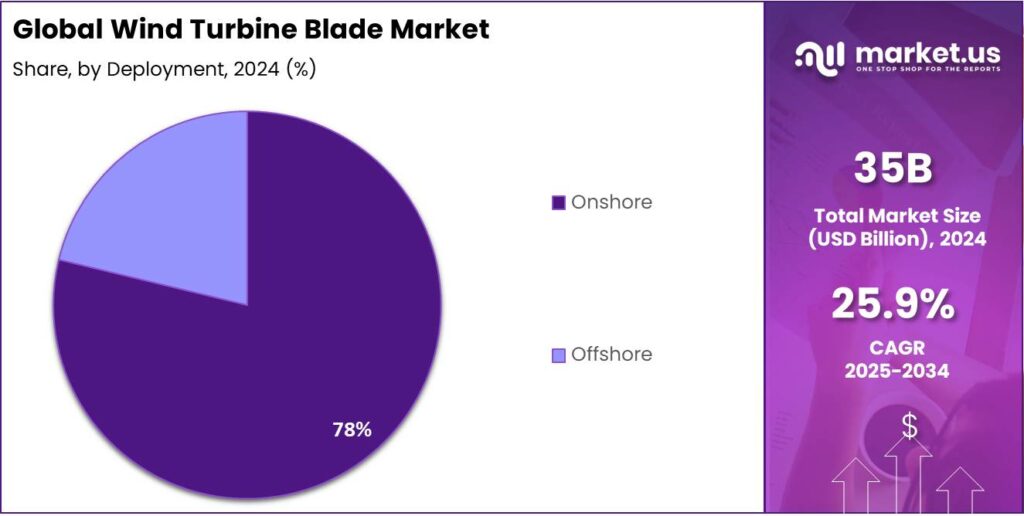
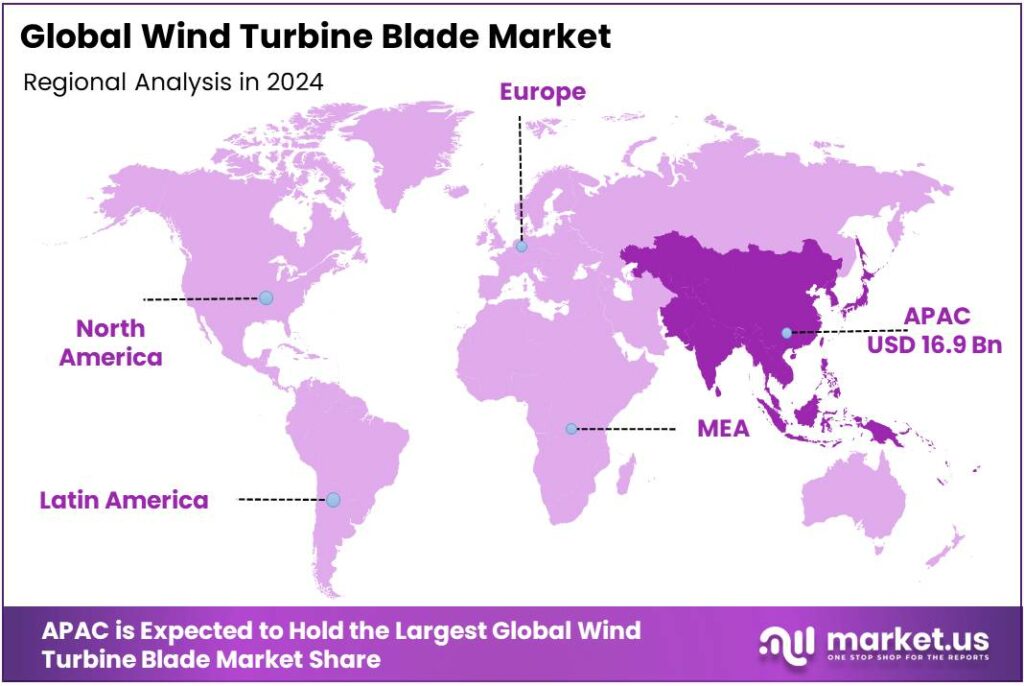
The Global Wind Turbine Blade Market size is expected to be worth around USD 350.2 Billion by 2034, from USD 35.0 Billion in 2024, growing at a CAGR of 25.9% during the forecast period from 2025 to 2034. In 2024 Asia-Pacific (APAC) held a dominant market position, capturing more than a 48.3% share, holding USD 16.9 Billion in revenue.
Wind turbine blades sit at the heart of modern wind power, where longer rotors and lighter composites translate directly into higher energy capture. The global context is strong: the industry installed a record 117 GW of new wind capacity in 2024, underscoring continued scale-up of blade production, logistics, and testing infrastructure. At end-2024, cumulative global wind capacity reached about 1,133 GW, confirming the technology’s mature, industrial scale and the centrality of blades within it.
The industrial scenario is defined by rapid upsizing and supply-chain localization. Land-based blades are now approaching ~80 m, while offshore platforms commonly exceed 100 m blade length, driving larger molds, heavier tooling, and advanced infusion processes in glass and carbon fiber. Europe reports 272 GW of installed wind, with capacity factors of ~30–45% onshore and ~50% offshore—figures that incentivize longer, stiffer, and more fatigue-resistant blades to maximize yield.
Public policy is a core driver of blade demand and local manufacturing. In the United States, the Inflation Reduction Act extends a 30% Investment Tax Credit and a Production Tax Credit of $0.0275/kWh, while also introducing technology-neutral clean electricity credits from 2025—support that continues to pull pipeline demand for blades.
Technology leaders have already demonstrated 115.5-meter blades for 15 MW-class offshore turbines, pushing factory footprints and test stands to new limits. Policymakers are pairing demand signals with manufacturing goals: the EU’s Wind Power Action Plan and related initiatives emphasize faster permitting and resilient supply chains, while the Net-Zero Industry Act targets 36 GW of EU wind manufacturing capacity by 2030—implications that cascade directly to blade plants, molds, and material suppliers.
Key driving factors include policy targets, cost competitiveness, and grid-scale decarbonization needs. The IEA projects renewable capacity additions rising from ~666 GW in 2024 to nearly 935 GW in 2030, with wind and solar providing ~95% of additions—sustaining multi-year visibility for blade orders and materials procurement. In the United States, the federal goal of 30 GW of offshore wind by 2030 pulls through nacelle and blade investments, specialized transport, and large-component handling ports.
Key Takeaways
- Wind Turbine Blade Market size is expected to be worth around USD 350.2 Billion by 2034, from USD 35.0 Billion in 2024, growing at a CAGR of 25.9%.
- Above 50 Meter blades held a dominant market position, capturing more than a 59.2% share of the global wind turbine blade market.
- Upto 10 MW capacity wind turbines held a dominant market position, capturing more than a 69.3% share of the global wind turbine blade market.
- Onshore deployment held a dominant market position, capturing more than a 77.9% share of the global wind turbine blade market.
- Asia-Pacific (APAC) held a dominant position in the global wind turbine blade market, accounting for 48.3% of total revenue, valued at approximately USD 16.9 billion.
By Blade Length Analysis
Above 50 Meter Blades dominate with 59.2% share driven by high-capacity turbine installations
In 2024, Above 50 Meter blades held a dominant market position, capturing more than a 59.2% share of the global wind turbine blade market. This segment’s growth was primarily supported by the increasing deployment of large-scale onshore and offshore wind turbines, designed to generate higher output per unit. Longer blades above 50 meters have become the preferred choice for turbines exceeding 3 MW capacity, as they enable improved aerodynamic efficiency and power generation even at lower wind speeds.
Manufacturers in major wind-producing regions such as China, the United States, and Europe increasingly adopted these longer blades to meet renewable energy expansion targets. According to global wind capacity trends in 2024, over 117 GW of new wind installations were added worldwide, with a substantial portion comprising turbines equipped with blades above 50 meters. This shift toward large rotor designs was further encouraged by government initiatives promoting high-efficiency turbine projects, especially across offshore wind farms.
By Capacity Analysis
Upto 10 MW turbines lead the market with 69.3% share driven by strong onshore and mid-scale offshore adoption
In 2024, Upto 10 MW capacity wind turbines held a dominant market position, capturing more than a 69.3% share of the global wind turbine blade market. This segment’s dominance was driven by the widespread deployment of onshore and nearshore wind farms that primarily utilize turbines in the 2 MW to 10 MW range. Such turbines offer a balanced combination of power output, cost efficiency, and easier installation logistics, making them highly preferred for both emerging and developed wind markets.
The year 2024 witnessed a surge in installations of mid-capacity turbines across Asia-Pacific and North America, supported by favorable renewable energy policies and auction-based procurement systems. A large share of newly installed wind projects, including repowering programs, opted for blades designed for turbines up to 10 MW, as these systems provide high reliability while keeping maintenance costs manageable.
By Deployment Analysis
Onshore segment dominates with 77.9% share driven by large-scale land-based installations and cost advantages
In 2024, Onshore deployment held a dominant market position, capturing more than a 77.9% share of the global wind turbine blade market. The segment’s leadership was primarily supported by the high volume of land-based wind projects across Asia-Pacific, North America, and Europe. Onshore wind farms continue to be the backbone of global wind energy generation due to lower installation and maintenance costs compared to offshore projects. The development of taller towers and longer blades above 50 meters further enhanced the performance of onshore turbines, allowing higher energy yield even in moderate wind conditions.
During 2024, the addition of new onshore capacity contributed significantly to the total global wind installations, which exceeded 117 GW. Countries such as China, the United States, and India accounted for the majority of new onshore projects, driven by government tenders, renewable targets, and grid integration programs. The increasing use of lightweight composite blades and improved logistics for transporting large components also supported the strong onshore buildout during this period.
Key Market Segments
By Blade Length
- Upto 50 Meter
- Above 50 Meter
By Capacity
- Upto 10 MW
- Greater than 10 MW
By Deployment
- Onshore
- Offshore
Emerging Trends
Rapid Shift to Circular, Recyclable Blades
A standout trend in wind-turbine blades is the move from “build-install-landfill” to genuinely circular, recyclable blade systems. The push comes from two forces: a fast-growing installed base that will soon retire in large waves, and government programs that fund recycling and recyclable-by-design materials.
On pace, wind electricity generation rose by 216 TWh in 2023 to >2,330 TWh, and staying on track for climate goals would require reaching ~7,100 TWh by 2030—a scale-up that magnifies end-of-life challenges unless blades become circular. IRENA reports the world added 113.2 GW of wind in 2024, bringing total renewable capacity to 4,448 GW and underscoring how many blades will eventually need responsible EoL routes.
Peer-reviewed assessments indicate Europe alone is heading toward ~325,000 tons of EoL blades by around 2030, most from onshore fleets—evidence that landfill bans and social license issues will pressure projects unless reuse and recycling scale. Second, governments are putting real money behind solutions. In December 2024, the U.S. Department of Energy announced up to $20 million for technologies to recycle fiber-reinforced composites and rare-earth magnets in wind turbines—explicitly targeting blade materials, design for recyclability, and cost-effective recovery.
The scaling context makes this more urgent. IRENA notes offshore wind reached ~79.4 GW in 2024, up roughly six-fold since 2015, while onshore hit ~1,053 GW. Longer blades for large offshore machines mean more composite per rotor, so recycling and reuse must move from pilots to industrial reality to keep lifecycle footprints in check. Policy acceleration in parallel markets reinforces momentum: the IEA documents that renewable electricity additions hit 507 GW in 2023, with China’s wind additions up 66% year-on-year—signals that the next decade will multiply the number of blades eventually reaching EoL.
Drivers
Renewable-Energy Target Commitments Driving Blade Uptake
One of the most compelling drivers behind the expanding demand for wind turbine blades is the global push for cleaner energy and the resulting surge in wind-power installations. In simple terms: as nations commit to cutting carbon emissions and shifting away from fossil fuels, they need more turbines, and therefore more blades.
To illustrate, according to the International Renewable Energy Agency (IRENA), global installed wind capacity — both onshore and offshore — jumped to 1,131 GW by 2024, up from just 7.5 GW in 1997. That means the market has grown nearly 150-fold in a little over two decades. Similarly, the International Energy Agency (IEA) noted that wind capacity additions in 2023 were over 50% higher than in 2022, largely driven by stronger deployment in China. These figures show how aggressively wind energy is being expanded — and why blades are in demand.
Governments around the world are actively setting renewable energy targets and designing policies to support them. For example, many countries provide tax credits, feed-in tariffs, flexible procurement frameworks and local manufacturing incentives. These policy levers make wind-farm projects more financially viable and encourage turbine developers to scale up. As wind projects take off, they require more and larger blades, accelerating blade demand.
What makes this factor especially significant for blade manufacturers is that larger turbines (which sweep greater area and capture more wind) are now the norm, rather than the exception. Because outfitting these turbines demands longer, lighter, stronger blades, the trend toward bigger turbines amplifies blade manufacturing volumes and complexity. It’s not just “more blades” — it’s “bigger and more advanced blades”.
In practical terms: every time a country announces a new offshore wind auction, or ups its onshore wind target, blade orders follow. For instance, the global target set by the Global Wind Energy Council (GWEC) calls for 120 GW of new wind-capacity per year in China alone, including about 15 GW in offshore wind. That level of capacity expansion can only be delivered with a strong blade supply chain.x
Restraints
Permitting & Grid-Connection Bottlenecks Constrain Blade Demand
A major brake on wind-turbine blade momentum is the slow march from project award to a live grid connection. The backlog is visible in the interconnection queues: at end-2024, ~2,300 GW of generation and storage capacity in the U.S. was still waiting for a grid hook-up—far more than what gets built each year.
The queue growth has been rapid. As of end-2023, ~1,570 GW of generation and ~1,030 GW of storage were seeking interconnection, with ~366 GW of wind in the line. Approval timelines have stretched, too: U.S. regional operators reported ~40 months on average for grid-connection studies, increasing the risk that projects miss auction milestones or financing windows and are canceled or re-bid.
Europe faces a parallel bottleneck on permitting and auctions. The European Commission observed that the EU added 16 GW in 2022, a 47% rise on 2021, yet still well below ~37 GW per year needed to track 2030 goals—an imbalance rooted in slow permitting, auction design frictions, and supply-chain stress.
These grid and permitting frictions collide with what the IEA calls a necessary step-up in wind deployment and generation. Wind electricity rose 216 TWh in 2023 to >2,330 TWh, yet reaching the IEA’s ~7,100 TWh by 2030 pathway requires average annual growth of ~17%, faster than recent history. The gap underscores why every month shaved from permits and interconnection matters for blade utilization, tooling amortization, and cost-down learning curves.
Governments are responding, which helps but does not erase the restraint. In the U.S., new FERC interconnection rules and operator process changes are moving toward “first-ready, first-served” clustering and milestone deposits; PJM and others target sharply shorter timelines through process automation. Reuters reports operators aiming to cut approvals from multiple years toward 1–2 years by 2026.
Opportunity
Offshore And Floating Wind Scale-Up Creates a Blade Super-Cycle
The clearest growth opportunity for wind-turbine blades is the global build-out of offshore wind—especially floating projects—paired with larger rotors. Offshore capacity stood at ~79–83 GW in 2024, reflecting rapid growth from less than 12 GW in 2015; this is the springboard for a much bigger decade.
Policy targets are converting into multi-year blade demand. In the United States, the federal government aims for 30 GW of offshore wind by 2030 and 15 GW of floating offshore wind by 2035—each gigawatt translating into hundreds of utility-scale blades, with growing sizes and specialized materials. These goals drive leasing, ports and transmission planning, which in turn anchor blade orders and local manufacturing.
Europe has raised its ambition sharply. The European Commission’s offshore package confirms Member States’ intention for ~111 GW of offshore renewables by 2030, up from the original 60 GW offshore-wind aim in 2020. Hitting that level requires faster auctions, grid build-out, and scaled manufacturing across nacelles, towers, and blades, with clear benefits for suppliers that localize molds and leading-edge protection lines.
Market momentum supports the policy signals. The Global Wind Energy Council reports offshore installations are set to rise from ~8 GW in 2024 to ~34 GW in 2030 annually—more than a fourfold jump in new offshore capacity per year, implying a steep ramp in blade sets, transport, and maintenance services. For OEMs and composite suppliers, that means higher volumes of carbon and high-modulus glass, tougher resins, and refined lightning-protection systems to enable longer blades on >14 MW machines.
The scale-up aligns with broader power-system needs. The IEA expects global renewable electricity to reach >17,000 TWh by 2030, with wind a major contributor; compared with 2017-2023, offshore additions are set to nearly quadruple by 2030. For blade makers, that implies sustained orders for larger rotors to lift capacity factors and reduce levelized costs—especially in low-to-moderate wind regimes offshore.
Regional Insights
Asia-Pacific dominates the global market with 48.3% share valued at USD 16.9 billion, driven by large-scale wind power expansion
In 2024, Asia-Pacific (APAC) held a dominant position in the global wind turbine blade market, accounting for 48.3% of total revenue, valued at approximately USD 16.9 billion. The region’s leadership was driven by rapid industrialization, increasing electricity demand, and strong government commitments toward renewable energy development.
China, India, Japan, and South Korea emerged as key contributors, with China remaining the largest producer and installer of wind turbines globally. According to the Global Wind Energy Council (GWEC), China alone added over 75 GW of new wind capacity in 2024, representing more than 60% of the world’s total installations.
Key Regions and Countries Insights
- North America
- US
- Canada
- Europe
- Germany
- France
- The UK
- Spain
- Italy
- Rest of Europe
- Asia Pacific
- China
- Japan
- South Korea
- India
- Australia
- Rest of APAC
- Latin America
- Brazil
- Mexico
- Rest of Latin America
- Middle East & Africa
- GCC
- South Africa
- Rest of MEA
Key Players Analysis
LM Wind Power, a subsidiary of GE Vernova, is a long-established blade manufacturer with over 40 years in design and manufacturing. The company reports that nearly 1 in 5 wind turbines worldwide carry LM blades. Its global footprint spans multiple production sites and R&D hubs, enabling efficient scale-up for larger turbines and offshore applications. LM focuses on digital industrialization and sustainability in its blade portfolio, while leveraging GE’s turbine platform for integrated solutions.
Siemens Gamesa is a global wind-turbine OEM and blade producer operating in 81 countries. Its “RecyclableBlade” technology offers blades with more fully recyclable resin systems. The company is investing ~EUR 200 million to expand its blade factory in Le Havre, France to serve new 14 MW+ turbines. Siemens Gamesa thus combines large-scale blade production, sustainability innovations, and strong OEM integration.
TPI Composites is an independent blade manufacturer headquartered in Scottsdale, Arizona, with factories in the U.S., Mexico and India. In 2024 the company reported producing approximately 6,525 wind blades and claimed a ~27% share of on-shore blades globally on a MW basis. TPI emphasizes advanced composite manufacturing, tooling, and supply chain optimisation to meet OEM demands for larger, longer blades.
Top Key Players Outlook
- LM Wind Power
- Siemens Gamesa Renewable Energy
- TPI Composites Inc.
- Mingyang Smart Energy Group Co., Ltd
- Nordex SE
- Suzlon Energy Limited
- Sinoma Wind Power Blade Co., Ltd.
- Enercon GmbH
- Zhongfu Lianzhong Composites Group Co., Ltd
- Aeris Energy
- Wuxi Turbine Blade Co., Ltd. (WTB)
Recent Industry Developments
In 2024 Mingyang Smart Energy Group, rolled-out the “MySE292” blade system with an approximate blade length of 143 meters and a rotor diameter of 292 m, marking a world-record size for its class.
Nordex SE is sharpening its blade-technology edge while scaling its onshore turbine business in 2024. The company reported EUR 7,298.8 million in sales for the full year, up from EUR 6,489.1 million in 2023.
Report Scope
Report Features Description Market Value (2024) USD 35.0 Bn Forecast Revenue (2034) USD 350.2 Bn CAGR (2025-2034) 25.9% Base Year for Estimation 2024 Historic Period 2020-2023 Forecast Period 2025-2034 Report Coverage Revenue Forecast, Market Dynamics, Competitive Landscape, Recent Developments Segments Covered By Blade Length (Upto 50 Meter, Above 50 Meter), By Capacity (Upto 10 MW, Greater than 10 MW), By Deployment (Onshore, Offshore) Regional Analysis North America – US, Canada; Europe – Germany, France, The UK, Spain, Italy, Rest of Europe; Asia Pacific – China, Japan, South Korea, India, Australia, Singapore, Rest of APAC; Latin America – Brazil, Mexico, Rest of Latin America; Middle East & Africa – GCC, South Africa, Rest of MEA Competitive Landscape LM Wind Power, Siemens Gamesa Renewable Energy, TPI Composites Inc., Mingyang Smart Energy Group Co., Ltd, Nordex SE, Suzlon Energy Limited, Sinoma Wind Power Blade Co., Ltd., Enercon GmbH, Zhongfu Lianzhong Composites Group Co., Ltd, Aeris Energy, Wuxi Turbine Blade Co., Ltd. (WTB) Customization Scope Customization for segments, region/country-level will be provided. Moreover, additional customization can be done based on the requirements. Purchase Options We have three licenses to opt for: Single User License, Multi-User License (Up to 5 Users), Corporate Use License (Unlimited User and Printable PDF) 
-
-
- LM Wind Power
- Siemens Gamesa Renewable Energy
- TPI Composites Inc.
- Mingyang Smart Energy Group Co., Ltd
- Nordex SE
- Suzlon Energy Limited
- Sinoma Wind Power Blade Co., Ltd.
- Enercon GmbH
- Zhongfu Lianzhong Composites Group Co., Ltd
- Aeris Energy
- Wuxi Turbine Blade Co., Ltd. (WTB)
Our Clients
- 164777
- Nov 2025


