
Global Water Enhancer Market Size, Share Analysis Report By Product Type (Flavored Drops, Energy Infusions, Vitamin-Enriched Drops, Electrolyte Boosters), By Form (Liquid, Powder), By Distribution Channel (Supermarkets/Hypermarkets, Convenience Stores, Online Retail Stores, Others) , By Region and Companies - Industry Segment Outlook, Market Assessment, Competition Scenario, Trends and Forecast 2025-2034
- Published date: Jan 2026
- Report ID: 173281
- Number of Pages: 315
- Format:
-
keyboard_arrow_up
Quick Navigation
Report Overview
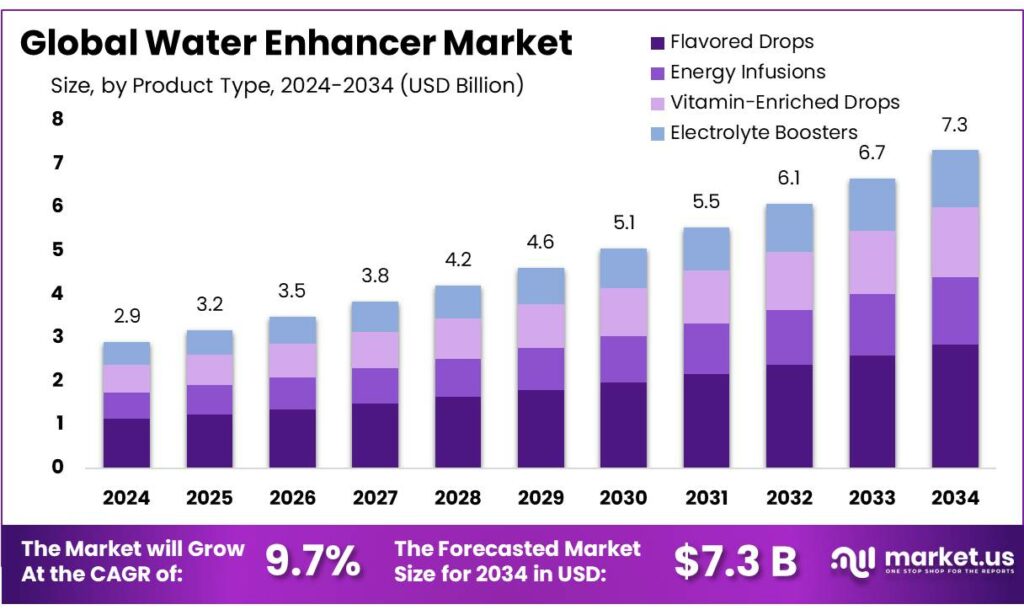
The Global Water Enhancer Market size is expected to be worth around USD 7.3 Billion by 2034, from USD 2.9 Billion in 2024, growing at a CAGR of 9.7% during the forecast period from 2025 to 2034. In 2024 Europe held a dominant market position, capturing more than a 47.3% share, holding USD 1.3 Billion in revenue.
Water enhancers are concentrated liquid drops, powders, or tablets designed to be added to plain water to create a flavored or functional drink with minimal effort. In the broader non-alcoholic beverage ecosystem, they sit between traditional powdered drink mixes, ready-to-drink flavored waters, and sports hydration products. Their value proposition is portability and personalization: consumers can control flavor strength, sweetness level, and—when fortified—functional benefits such as electrolytes or vitamins, while still starting from water.
The industrial scenario is supported by the scale of water consumption itself, especially in packaged formats that encourage on-the-go usage and repeat purchase. In the United States, per-capita bottled water consumption is reported at 47.1 gallons, compared with 33.8 gallons for carbonated soft drinks, underlining how water has become the default packaged beverage for many households.
A primary demand driver is the continued push—by health authorities and regulators—for lower sugar intake, which shifts consumer preference toward low- or zero-sugar flavor systems. In the U.S., dietary guidance recommends limiting calories from added sugars to less than 10% of total daily calories, which equates to about 50 grams for a 2,000-calorie diet, and FDA labeling makes “Added Sugars” visible on-pack to aid comparison. WHO’s global guidance similarly recommends free sugars below 10% of energy intake, and suggests aiming below 5% (around 25 grams/day) for additional health benefits.
Government initiatives that reshape the soft-drink landscape also create indirect tailwinds for water-adjacent products. The UK’s Soft Drinks Industry Levy framework targets sugar thresholds (e.g., 5g per 100ml as a key cutoff), and official summaries report a 47% average reduction in sugar in soft drinks in scope of the levy between 2015 and 2024. As reformulation normalizes lower-sugar taste profiles, water enhancers can compete not only on sweetness but also on “functional hydration” cues and cleaner labeling.
Consumption patterns also support the category’s role as a bridge away from sugary drinks. In the U.S., 63% of adults reported drinking sugar-sweetened beverages one or more times daily, showing how large the addressable “replacement” pool remains. Government fiscal measures further amplify reformulation and reduced-sugar positioning: the UK Soft Drinks Industry Levy applies 18p per litre to drinks with 5–8 g sugar/100 mL and 24p per litre at 8 g sugar/100 mL and above.
In the U.S., federal dietary guidance similarly recommends limiting calories from added sugars to less than 10% of total daily calories, reinforcing product development that leans on high-intensity sweeteners, fruit flavors, and “zero/low sugar” claims. Fiscal policy is also reshaping beverage portfolios: the UK Soft Drinks Industry Levy applies a lower rate to drinks with 5.0–7.9 g sugar/100 mL and a higher rate at ≥8.0 g/100 mL, incentivizing reformulation strategies that water enhancers can complement.
Key Takeaways
- Water Enhancer Market size is expected to be worth around USD 7.3 Billion by 2034, from USD 2.9 Billion in 2024, growing at a CAGR of 9.7%.
- Flavored Drops held a dominant market position, capturing more than a 39.5% share in the global water enhancer market.
- Liquid held a dominant market position, capturing more than a 78.4% share in the global water enhancer market.
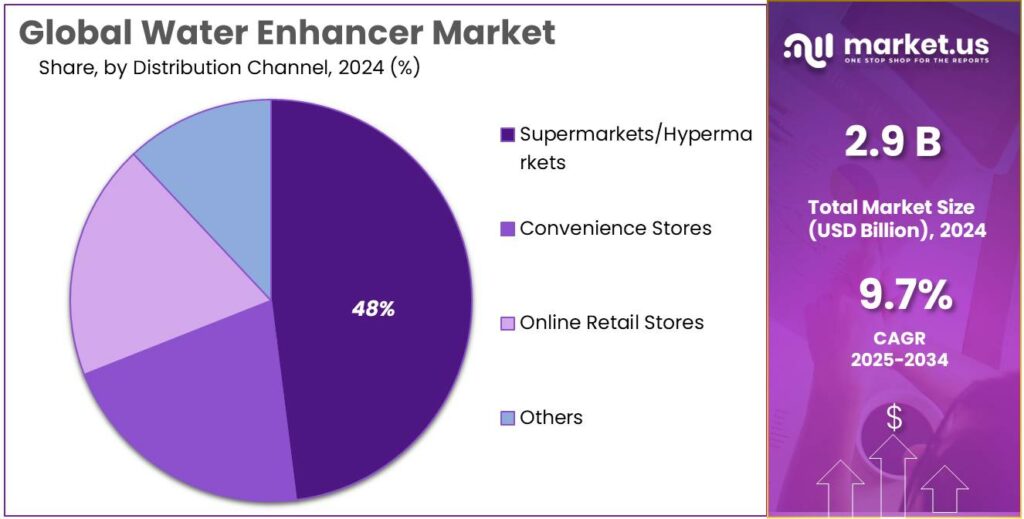
- Supermarkets/Hypermarkets held a dominant market position, capturing more than a 48.2% share in the water enhancer market.
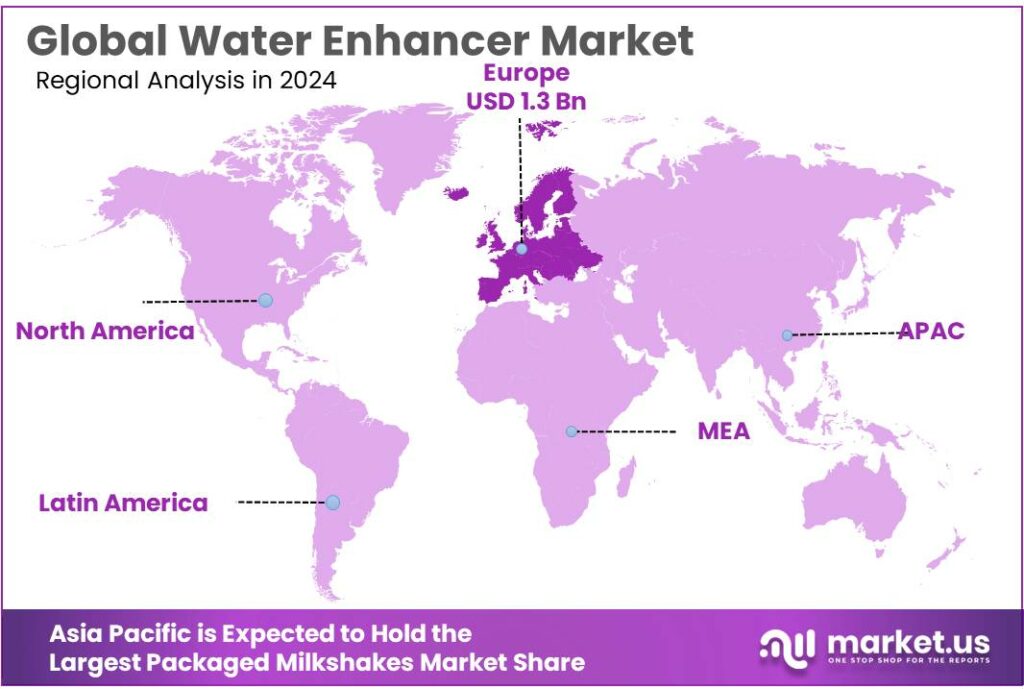
- Europe held a dominant position in the Water Enhancer Market, capturing 47.3% share with an estimated market value of USD 1.3 billion.
By Product Type Analysis
Flavored Drops lead with 39.5% share as consumers seek convenient and customizable hydration options.
In 2024, Flavored Drops held a dominant market position, capturing more than a 39.5% share in the global water enhancer market, driven mainly by rising demand for easy-to-use and portable hydration solutions. This product type gained strong acceptance among urban consumers, working professionals, and fitness-oriented users who prefer adding flavor to plain water without carrying bulky bottles. Flavored drops are valued for their concentrated form, allowing multiple servings from a single pack, which supports cost efficiency and reduced packaging waste. The segment also benefited from growing awareness around sugar reduction, as many flavored drops are formulated with low or zero sugar while still delivering taste variety.
Throughout 2024, demand was supported by higher consumption of functional beverages and flavored water alternatives, particularly in North America and parts of Europe. Moving into 2025, the segment continued to show steady momentum as manufacturers focused on clean-label ingredients, natural flavors, and improved taste profiles to retain consumer trust. The ability of flavored drops to align with busy lifestyles, on-the-go consumption, and personalized flavor strength has positioned this product type as a preferred choice within the water enhancer category. Overall, the segment’s strong share reflects consistent consumer preference for convenience, flexibility, and better-for-you hydration solutions.
By Form Analysis
Liquid form dominates with 78.4% share due to its ease of use and wide consumer acceptance.
In 2024, Liquid held a dominant market position, capturing more than a 78.4% share in the global water enhancer market, supported by its strong convenience and familiarity among consumers. Liquid water enhancers are widely preferred as they dissolve quickly in water, offer consistent flavor release, and allow easy control over taste intensity. This form fits well with everyday routines, including home use, office consumption, and on-the-go hydration.
The dominance of liquid formats was further strengthened in 2024 by the expansion of flavored and functional variants that support hydration, energy, and wellness needs. Consumers also showed higher trust in liquid products due to their longer shelf stability and ease of packaging compared to alternatives. Entering 2025, the segment continued to benefit from innovations in compact bottles, leak-proof packaging, and cleaner ingredient formulations. The liquid form remains the first choice for most buyers, as it balances convenience, performance, and familiarity, making it the most established and widely adopted form within the water enhancer market.
By Distribution Channel Analysis
Supermarkets/Hypermarkets dominate with 48.2% share due to strong visibility and consumer trust.
In 2024, Supermarkets/Hypermarkets held a dominant market position, capturing more than a 48.2% share in the water enhancer market, mainly driven by their wide product assortment and high daily footfall. These stores allow consumers to compare flavors, formats, and price points in one place, which supports informed purchasing decisions. Promotional pricing, in-store displays, and bundled offers further supported higher sales through this channel during 2024.
The physical presence of supermarkets also builds trust, especially for first-time buyers who prefer to see and evaluate the product before purchase. Moving into 2025, supermarkets and hypermarkets continued to benefit from organized retail expansion and improved shelf placement for functional and flavored hydration products. Regular restocking and easy availability ensured consistent demand across urban and semi-urban areas. As a result, this channel remained the leading distribution route, supported by convenience, visibility, and established shopping habits among a broad consumer base.
Key Market Segments
By Product Type
- Flavored Drops
- Energy Infusions
- Vitamin-Enriched Drops
- Electrolyte Boosters
By Form
- Liquid
- Powder
By Distribution Channel
- Supermarkets/Hypermarkets
- Convenience Stores
- Online Retail Stores
- Others
Emerging Trends
Personalised and Functional Enhancers for Everyday Wellness
One of the biggest and most meaningful trends shaping the water enhancer category today is the move toward personalised and functional hydration—products that do more than add flavour and aim to support everyday wellness in ways that matter to real people. This trend reflects how consumers now think beyond “just taste.” They are asking, “Can this help me feel better, think clearer, or recover faster?” and water enhancers are evolving to meet those needs.
People’s lifestyles are busier and more varied than ever. Many adults juggle work, family responsibilities, and health goals all at the same time. At the same time, public health guidance emphasises building healthy routines that fit naturally into daily life. For example, the World Health Organization recommends adults do at least 150 minutes of moderate-intensity physical activity every week or 75 minutes of vigorous-intensity activity to reduce risk of chronic disease.
Most people do not think of hydration as a one-size-fits-all need anymore. Workplaces, gyms, schools and sports teams now emphasise the importance of staying hydrated throughout the day, and brands are responding with “functional” enhancers that include electrolytes, antioxidants, or even mild caffeine. This matches public-health goals to reduce sugar in diets: the U.S. Dietary Guidelines recommend that added sugars should make up less than 10% of daily calories.
Consumer behaviour around hydration is also influenced by growing awareness of sugar’s link to long-term health outcomes. For instance, the World Health Organization has called for adults and children to reduce “free sugars” to less than 10% of total energy intake, with additional benefits below 5%.
Drivers
Reducing Sugar From Drinks Pushes Water Enhancer Demand
A single, powerful driver for water enhancers is the steady push—by health agencies, regulators, and consumers—to cut sugar coming from everyday beverages. Water enhancers fit this shift neatly because they let people keep the “taste” experience while starting with plain water and using little or no added sugar. In practical terms, they act like a small, portable flavor system that helps households move away from sugary soft drinks without feeling like they are giving something up.
Public health guidance has made sugar reduction a clear, repeatable message. The U.S. Dietary Guidelines recommend keeping added sugars to less than 10% of daily calories. The U.S. FDA reinforces this consumer-facing benchmark through the Nutrition Facts label, where the Daily Value for added sugars is 50 grams per day on a 2,000-calorie diet—so shoppers can quickly compare products and see how fast sugary drinks can “use up” the day’s allowance. WHO takes a similar stance globally, recommending free sugars at below 10% of total energy intake, with added benefits if reduced to below 5%.
Government policy adds another layer of momentum because it changes the economics of sugary drinks and encourages reformulation. The UK’s Soft Drinks Industry Levy set clear sugar thresholds, applying a lower levy rate to drinks with 5g to 7.9g sugar per 100ml and a higher rate to drinks with 8g or more per 100ml. Even outside the UK, the broader idea is influential: once a market starts pricing sugar content more directly, brands look for “flavor delivery” formats that can avoid these thresholds.
Restraints
Sweetener Trust Issues Limit Wider Water Enhancer Adoption
One of the biggest restraints for water enhancers is simple: a large share of shoppers want less sugar, but they do not automatically trust the sweeteners that often replace sugar in these products. Water enhancers usually rely on high-intensity sweeteners (or blends) to deliver “strong taste” from a small dose. That works technically, but it also puts the category in the middle of an ongoing public debate about artificial and non-sugar sweeteners. When trust is shaky, trial slows down, repeat purchase drops, and brands are forced into constant reformulation.
Consumer survey data shows this tension clearly. In the 2024 IFIC Food & Health Survey, 66% of consumers said they are trying to limit their sugar consumption. That is a very large audience that could, in theory, choose a water enhancer instead of a sugary drink. But the same IFIC report also shows that sweetener preferences are fragmented: only 16% said they prefer low/no-calorie sweeteners, while 35% prefer sugar as their sweetener. More importantly for the water enhancer space, 13% said they try to avoid all sweeteners.
The restraint becomes stronger when specific sweeteners get negative attention. In July 2023, IARC classified aspartame as “possibly carcinogenic to humans” (Group 2B) while JECFA reaffirmed an acceptable daily intake of 40 mg/kg body weight. Separately, EFSA also notes an acceptable daily intake for aspartame of 40 mg/kg body weight/day.
Opportunity
Functional Hydration for Active, Hot, and Working Days
A major growth opportunity for water enhancers sits in functional hydration—products that do more than add taste, such as electrolyte support, light energy, or “workday hydration” formats. The logic is straightforward: more people are being nudged to move more, work safely in heat, and drink water more often, but plain water can feel boring for daily repetition. Water enhancers can step in as a low-effort “habit helper,” turning a bottle of water into something people actually want to finish—without forcing them into sugary drinks.
Health organizations continue to push regular movement, which naturally increases day-to-day hydration needs. The World Health Organization states that adults should get at least 150 minutes of moderate-intensity physical activity per week (or 75 minutes vigorous). At the same time, WHO reports that nearly 31% of the world’s adult population—about 1.8 billion adults—are physically inactive, and this rose by 5 percentage points between 2010 and 2022.
Workplace heat safety is another opening that can expand usage beyond gym-goers into industrial and outdoor work settings. OSHA published a Notice of Proposed Rulemaking on August 30, 2024 for Heat Injury and Illness Prevention in Outdoor and Indoor Work Settings—part of a broader move toward clearer employer responsibilities around heat risk.
The bottled water base itself is large, which gives water enhancers a strong “attach rate” opportunity. In the U.S., bottled water per-capita consumption has been cited at 47.1 gallons, versus 33.8 gallons for carbonated soft drinks. When water is already the default packaged drink, enhancers can grow by riding on top of that habit—especially in offices, schools, travel, and on-the-go moments where people carry water anyway. The commercial play is not to replace water, but to upgrade it: flavor variety packs, single-serve sticks, and functional “hydration +” options that travel well and remove the friction of mixing full-size powders.
Regional Insights
Europe Water Enhancer Market – Leading Region with 47.3 % Share and $1.3 Bn in 2024
In 2024, Europe held a dominant position in the Water Enhancer Market, capturing 47.3 % share with an estimated market value of USD 1.3 billion. The region’s leadership was supported by strong consumer awareness of health and wellness trends, which encouraged the uptake of flavored and functional hydration products that enhance plain water without adding excessive calories or sugar.
European consumers, particularly in countries such as Germany, the United Kingdom, France and Italy, showed a pronounced shift toward healthier beverage alternatives, including sugar-free and nutrient-enhanced water enhancers. This trend was further reinforced by well-developed retail infrastructure, including supermarkets, hypermarkets and online channels that made a wide array of water enhancer products accessible to both urban and suburban shoppers.
Entering 2025, the market continued to grow as product innovation and promotional activity increased visibility for water enhancers across both modern trade outlets and e-commerce platforms. Year-on-year patterns showed that rising health consciousness, combined with strong distribution networks and flavor diversity, supported stable regional consumption. Europe’s leading share thus reflects not only current demand dynamics but also a forward-looking preference for convenient, health-oriented hydration solutions that cater to diverse consumer segments.
Key Regions and Countries Insights
- North America
- US
- Canada
- Europe
- Germany
- France
- The UK
- Spain
- Italy
- Rest of Europe
- Asia Pacific
- China
- Japan
- South Korea
- India
- Australia
- Rest of APAC
- Latin America
- Brazil
- Mexico
- Rest of Latin America
- Middle East & Africa
- GCC
- South Africa
- Rest of MEA
Key Players Analysis
Nestlé S.A.: Nestlé is a major multinational in beverages and nutrition, integrating water enhancers into its broader hydration and wellness offerings. Its strategy includes expanding natural and reduced-sugar variants to align with health trends. In 2024, Nestlé achieved annual sales of CHF 94.40 billion, highlighting its scale and capacity to influence the enhancer market through branded and functional portfolio extensions.
The Kraft Heinz Company: Kraft Heinz drives the market with its MiO and Crystal Light Liquid water enhancers, known for variety and personalization. Its legacy brands benefit from wide retail availability and diverse flavor portfolios. In 2024, the company recorded net sales of USD 26.18 billion, reflecting its broad food and beverage presence that supports enhancer segment visibility.
The Coca-Cola Company: Coca-Cola is a key player with products such as Dasani Drops and Vitaminwater Zero Drops, combining flavor innovation with global reach and marketing strength. In 2024, Coca-Cola reported net operating revenues of USD 43.43 billion, illustrating its large footprint in beverage enhancers and related hydration solutions, supported by extensive retail distribution.
Top Key Players Outlook
- PepsiCo Inc.
- Nestle S.A.
- The Coca-Cola Company
- The Kraft Heinz Company
- Jel Sert
- SweetLeaf Stevia Sweetener
- Nuun
- Dyla LLC (Stur)
- 4C foods
- Arizona Beverages USA
Recent Industry Developments
In 2024, PepsiCo reported net revenue of approximately USD 92 billion, reflecting the strength of its global beverages and foods business that underpins market presence for water enhancers alongside sports and hydration brands.
In 2024, Nestlé reported total group sales of CHF 91,354 million (about USD 100 billion), with its powdered and liquid beverages segment, which supports flavor innovation and functional drink offerings, contributing CHF 24,598 million to overall sales.
Report Scope
Report Features Description Market Value (2024) USD 2.9 Bn Forecast Revenue (2034) USD 7.3 Bn CAGR (2025-2034) 9.7% Base Year for Estimation 2024 Historic Period 2020-2023 Forecast Period 2025-2034 Report Coverage Revenue Forecast, Market Dynamics, Competitive Landscape, Recent Developments Segments Covered By Product Type (Flavored Drops, Energy Infusions, Vitamin-Enriched Drops, Electrolyte Boosters), By Form (Liquid, Powder), By Distribution Channel (Supermarkets/Hypermarkets, Convenience Stores, Online Retail Stores, Others) Regional Analysis North America – US, Canada; Europe – Germany, France, The UK, Spain, Italy, Rest of Europe; Asia Pacific – China, Japan, South Korea, India, Australia, Singapore, Rest of APAC; Latin America – Brazil, Mexico, Rest of Latin America; Middle East & Africa – GCC, South Africa, Rest of MEA Competitive Landscape PepsiCo Inc., Nestle S.A., The Coca-Cola Company, The Kraft Heinz Company, Jel Sert, SweetLeaf Stevia Sweetener, Nuun, Dyla LLC (Stur), 4C foods, Arizona Beverages USA Customization Scope Customization for segments, region/country-level will be provided. Moreover, additional customization can be done based on the requirements. Purchase Options We have three licenses to opt for: Single User License, Multi-User License (Up to 5 Users), Corporate Use License (Unlimited User and Printable PDF) 
-
-
- PepsiCo Inc.
- Nestle S.A.
- The Coca-Cola Company
- The Kraft Heinz Company
- Jel Sert
- SweetLeaf Stevia Sweetener
- Nuun
- Dyla LLC (Stur)
- 4C foods
- Arizona Beverages USA
Our Clients
- 173281
- Jan 2026


