Report Overview
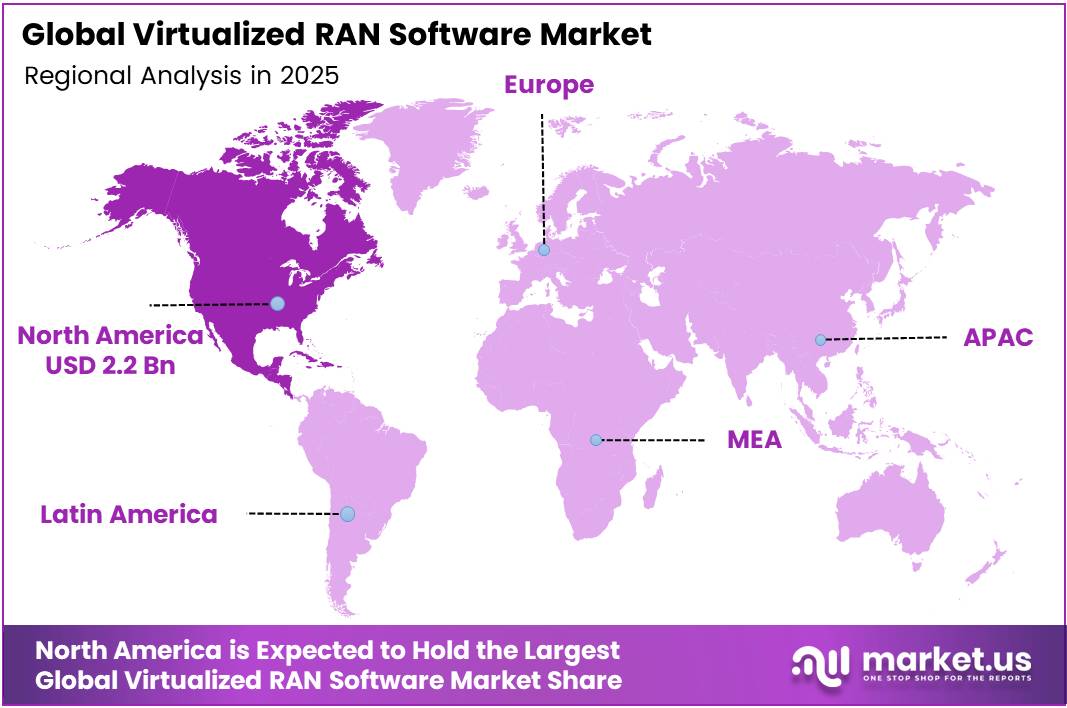
In 2025, the Global Virtualized RAN Software Market was valued at USD 5.8 billion. The market is projected to grow at a CAGR of 37.2% during 2026–2035, reaching approximately USD 137.1 billion by 2035. North America dominated the global market in 2025, accounting for more than 38.0% of the total market share and generating approximately USD 2.2 billion in revenue.
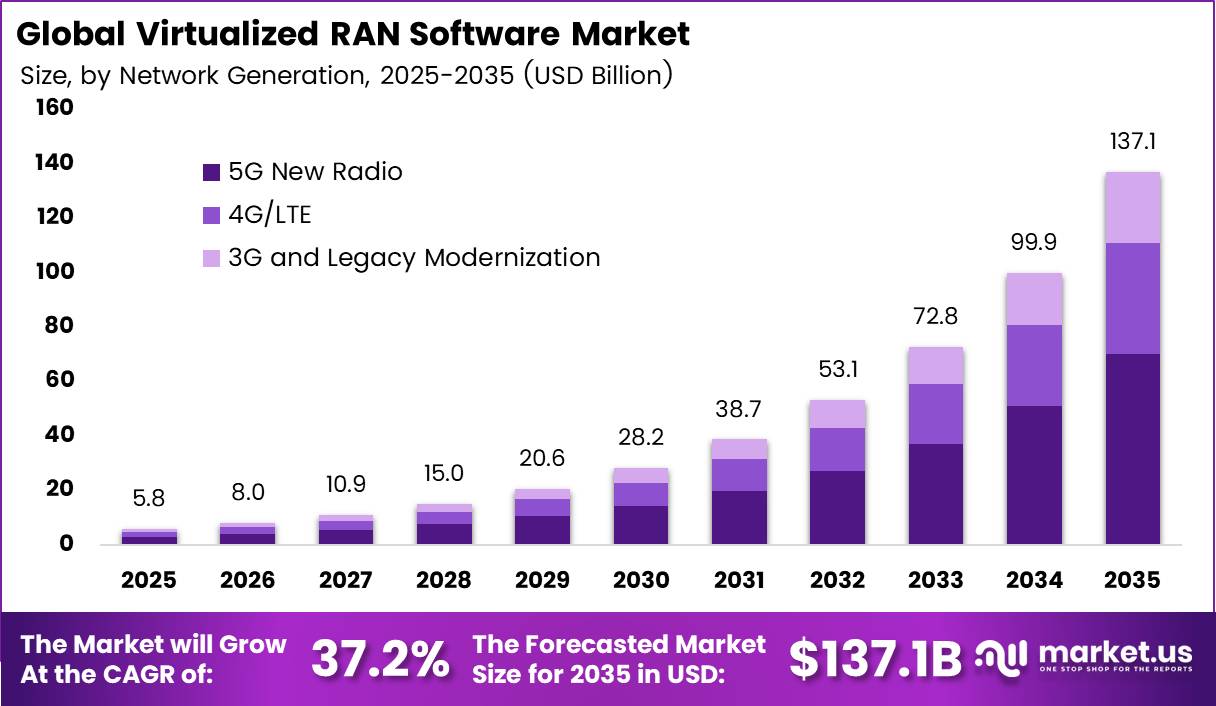
The main driver is the move to 5G, which needs flexible, software-based radio networks. The GSMA reports 8,817.0 million mobile connections worldwide in 2025, and 5G made up 20% of them. The GSMA expects more than 50% of connections to run on 5G by 2029.
Operators also want to stop buying fixed, single-vendor baseband hardware. So they now run RAN software on general-purpose servers. Verizon shows how big this shift has become. It went from 22,900 vRAN sites in early 2025 to about 60,000 sites in 2026, and these now cover almost half of its network.
The North America region adopted 5G early and has large operators that commit to big software contracts. The GSMA reports that 5G made up 48% of North American connections in 2025. Over the same period, 4G fell from 82% to 45%. The region had 429.4 million connections in 2025. Large vendor deals add to this demand. AT&T signed a USD 14 billion deal.
Key Takeaways
- The Virtualized RAN Software Market was worth USD 5.8 billion in 2025 and will reach USD 137.1 billion by 2035. grow at a CAGR of 37.2% from 2026 to 2035.
- By Software Layer, Distributed Unit Software leads with a 46.1% share.
- By Architecture, Open vRAN leads with a 36.6% share.
- By Deployment, On-Premise leads with a 63.5% share.
- By Network Generation, 5G New Radio leads with a 57.3% share.
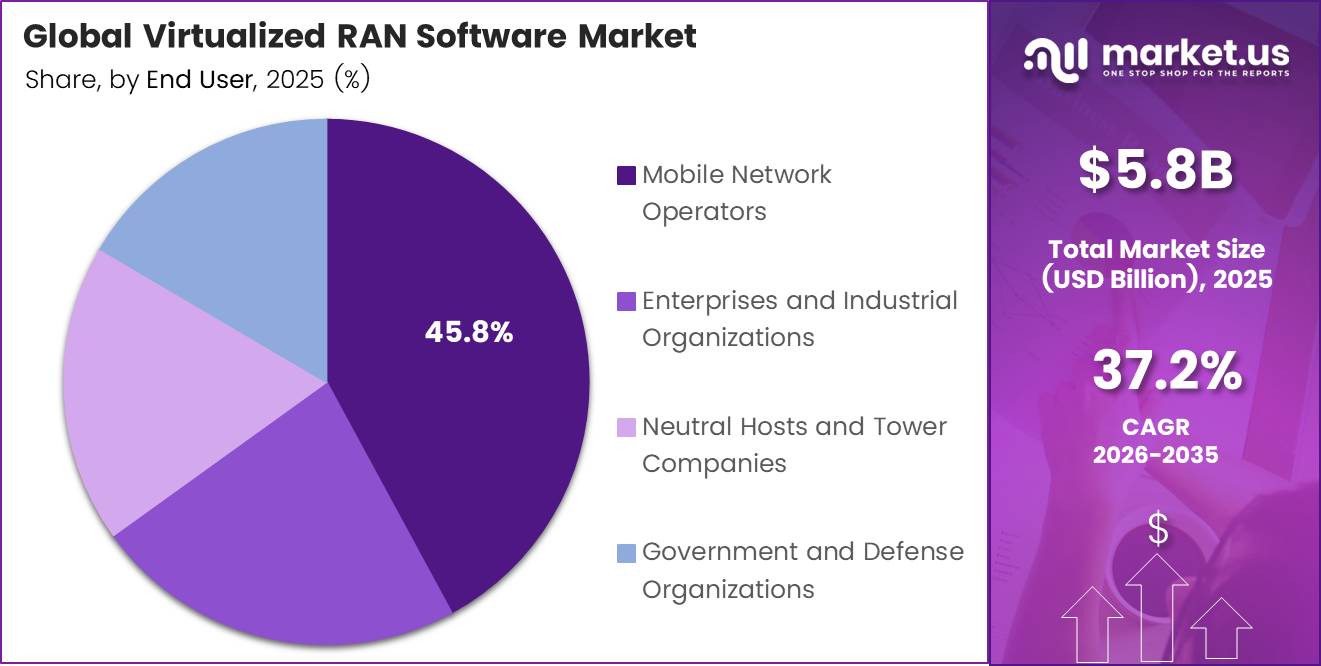
- By End User, Mobile Network Operators lead with a 45.8% share.
- North America leads with a 38.0% share and USD 2.2 billion in revenue.
By Software Layer
Distributed Unit Software dominates with 46.1% due to real-time baseband processing at every site.
Distributed Unit Software leads because the DU does the heavy, real-time baseband work at every cell site. Every new 5G site needs this layer before any other, so operators spend money here first. Ericsson reports that about 390 service providers now run commercial 5G services, and each of these networks depends on DU software to work.
Rising traffic also keeps DU demand strong. Ericsson shows that mobile network data traffic grew 23% between Q2 2025 and Q2 2026. 5G now carries about 50% of all mobile data. More traffic means operators must add more DU capacity on standard servers.
RAN Intelligent Controller and Automation Software is growing fastest because operators want AI to cut energy use and manual work across sites that mix vendors. The O-RAN Alliance names the RIC as the main path to native AI inside the RAN. In July 2026, NTIA opened its “Solutions for AI-Native RAN” grant round. It offers up to USD 53 million in total and up to USD 25 million per project.
By Architecture
Open vRAN dominates with 36.6% due to a government-backed push for vendor diversity.
Open vRAN leads because operators and governments want to loosen the hold of a few large equipment suppliers. With open interfaces, a buyer can mix radios and software from different vendors on common hardware. In the United States, NTIA backs this shift through its USD 1.5 billion Public Wireless Supply Chain Innovation Fund, which runs for ten years.
This funding has already turned into real projects. NTIA’s first two rounds committed USD 550 million across 35 grant awards. Round one alone gave USD 140.4 million to 17 projects covering testing labs and open radio work.
Cloud-Native vRAN is growing fastest because it fits best with 5G standalone cores built on containers. Operators can update software without visiting sites and can scale capacity within minutes. GSMA notes that just over 70 operators, about 20% of those with 5G, ran live standalone networks, and its surveys point to a clear uptick in 2026. In the UK, EE’s standalone network reached more than 34 million people by August 2025.
By Deployment
On-premises dominates with 63.5% due to strict latency and data control needs.
On-premises leads because many buyers want full control over speed, data, and security at their own sites. Factories, ports, mines and campuses run local networks, and these need the DU to sit close to the radios. GSA counted 2,031 organisations in 88 countries running private mobile networks worth more than EUR 100,000 by 2Q26.
This base keeps getting bigger. GSA says customer references have grown at a 37% compound annual rate since 2019. Another 180 smaller projects are valued between EUR 50,000 and EUR 100,000. Cloud-Native vRAN is gaining speed in deployment because operators would rather pool computing power than place a dedicated server at every site.
Shared cloud platforms lower hardware costs, and teams can push new features to thousands of cells in one step. In the Middle East and North Africa, GSMA expects operators to invest USD 53 billion between 2026 and 2030 to expand coverage and deploy 5G standalone networks.
By Network Generation
5G New Radio dominates with 57.3% due to a functional split built for virtualization.
5G New Radio leads because nearly all new RAN spending now goes to 5G. Its split design also fits virtualized software very well. Ericsson reports close to 3.3 billion 5G subscriptions worldwide, which makes 5G the core focus of every major operator’s network budget.
Adoption is still rising quickly. Service providers added around 660 million 5G subscriptions during 2025 alone. North America reached the highest 5G penetration at 79%, followed by Northeast Asia at 60%. 3G and Legacy Modernization is growing fastest, starting from a small base, as operators shut down old networks and move the remaining users onto software platforms.
Ericsson shows that 4G subscriptions fell by 62 million in Q2 2026 to about 4.5 billion. In the same quarter, 3G dropped by 18 million and 2G by 23 million. Each shutdown frees spectrum and leaves aging hardware that needs replacing.
By End User
Mobile Network Operators dominate with 45.8% due to spectrum ownership and nationwide site portfolios.
Mobile Network Operators lead because they hold the spectrum, the tower sites, and the largest RAN budgets. They buy vRAN software at a scale no other group can match. GSMA Intelligence tracks 416 operators that have launched 5G services across 160 markets, and each one is a direct buyer of RAN software.
New regional builds add to this lead. GSMA expects 5G connections in the Middle East and North Africa to rise from 67 million in 2025 to almost 350 million by 2030. Operators there plan to invest USD 88.9 billion over the same period.
Key Market Segments
By Software Layer
- Distributed Unit Software
- Radio Unit and Low-PHY Software
- RAN Intelligent Controller and Automation Software
- Operations, Administration, and Orchestration Software
- Rest of Virtualized RAN Software
By Architecture
- Open vRAN
- Cloud-Native vRAN
- Proprietary vRAN
- Hybrid vRAN
By Deployment
- Cloud-Native vRAN
- On Premise
By Network Generation
- 5G New Radio
- 4G/LTE
- 3G and Legacy Modernization
By End User
- Mobile Network Operators
- Enterprises and Industrial Organizations
- Neutral Hosts and Tower Companies
- Government and Defense Organizations
Geopolitical Impact Analysis
vRAN is software, but it runs on servers, accelerators, and radios. That hardware still moves through global supply chains under heavy pressure. In 2025, the US raised tariffs on many Chinese goods to as high as 145% before cutting them back. These swings raise the cost of servers, network cards, and radio parts used in vRAN sites. Operators then delay or stretch out their rollout plans.
Shipping problems add more cost. The WTO and UNCTAD reported that Red Sea attacks pushed many ships around the Cape of Good Hope. This added about 10 to 14 days to Asia-to-Europe trips. UNCTAD found that Suez Canal transits fell by more than 50% at the peak of the crisis. Radio units and servers built in Asia now take longer to reach European tower sites.
Chip supply is the biggest risk. Export controls on advanced chips limit which processors vendors can sell in some markets. Memory prices also rose sharply during the AI server boom, which pushed up the price of each vRAN server. To protect margins, vendors now support more than one chip platform. Ericsson, for example, runs on Intel and has prototype support for AMD, Arm, and Nvidia.
Security policy also changes who wins contracts. The US, UK, and several EU states have limited high-risk vendors in their networks. This opens room for Samsung, Mavenir, and other open RAN suppliers. The IMF projected global trade growth below 3% for 2025 and 2026. With trade growing that slowly, operators favor local and trusted supply chains.
Regional Analysis
North America dominates the Virtualized RAN Software Market, holding a 38.0% share and generating USD 2.2 billion in revenue. The US drives most of this lead. Its large operators treat vRAN as the base for future 6G networks. Verizon runs one of the largest virtualized radio networks in the world. It uses Samsung software on HPE servers with a Wind River cloud layer.
AT&T also made the first open RAN call over its commercial network using third-party radios in October 2025. Canada adds more demand. TELUS is building Canada’s first 5G vRAN and open RAN network with Samsung. In October 2025, it also deployed Samsung’s AI-powered RAN Intelligent Controller. The GSMA counts about 320 million mobile internet users in North America, and 60% of them connect through 5G.
Asia Pacific is the fastest-growing region in the Virtualized RAN Software Market. Japan leads early adoption, and Rakuten Mobile runs a fully cloud-native network built on Rakuten Symphony software. India brings huge scale. One Indian plan starts with 2,500 open RAN sites and aims to scale to 10,000. South Korea, China, and Australia add steady 5G spending.
Europe holds a strong position as large operators renew their networks. The GSMA reports 679.1 million connections in Europe in 2025, with 123.5% connection penetration. Vodafone picked Samsung for open RAN in Germany and other markets for 5 years. Orange is expanding its vRAN sites with Samsung in 2026.
Key Regions and Countries
North America
- US
- Canada
Europe
- Germany
- France
- The UK
- Spain
- Italy
- Rest of Europe
Asia Pacific
- China
- Japan
- South Korea
- India
- Australia
- Rest of APAC
Latin America
- Brazil
- Mexico
- Rest of Latin America
Middle East and Africa
- GCC
- South Africa
- Rest of MEA
Market Dynamics
Drivers
| Driver | (~) % Impact on CAGR Forecast | Geographic Relevance | Impact Timeline |
|---|---|---|---|
| Tier-1 Operator Open/Cloud RAN Commitments | +4.2% | North America, Europe, Japan | Short term (2 years or less) |
| 5G Standalone Core Rollouts | +3.1% | Global | Short term (2 years or less) |
| Government Vendor-Diversification Funding | +2.4% | U.S., U.K., EU | Medium term (2 to 4 years) |
| COTS Server & Accelerator Maturity | +2.0% | Global | Short term (2 years or less) |
| AI-Native RAN Automation (SMO/RIC) | +1.6% | North America, Asia Pacific | Medium term (2 to 4 years) |
| Network Energy Cost Reduction Mandates | +1.2% | Europe, Asia Pacific | Medium term (2 to 4 years) |
Tier-1 Operator Open/Cloud RAN Commitments
Big carrier commitments are the biggest current driver because they turn RAN from a hardware sale into a software license with ongoing revenue. AT&T’s December 2023 contract with Ericsson is the main example. Per AT&T investor disclosures, it is worth roughly $14 billion over 5 years, and it aims to put about 70% of the operator’s wireless traffic on open-capable platforms by late 2026.
Vendor earnings calls show the pricing mechanism. Baseband value moves from proprietary ASIC boards to per-cell, or per-carrier, software subscriptions running on commodity servers, which pushes software’s share of each site’s RAN spend from about 15–20% to an estimated 35–45%.
Earlier commitments added scale through 2024 and 2025. According to Vodafone’s annual reports, the group targets 30% of its European sites on Open RAN by 2030. Per GSMA Intelligence operator tracking, Rakuten Mobile and DISH/EchoStar together ran over 20,000 virtualized cell sites by 2025.
The commercial effect is a shift to recurring revenue for vendors and to multi-year OPEX for operators. Telecom Infra Project integration benchmarks indicate operator total cost of ownership falls by about 20–30% over a 7-year lifecycle.
Restraints
| Restraint | (~) % Impact on CAGR Forecast | Geographic Relevance | Impact Timeline |
|---|---|---|---|
| Operator CapEx Contraction Cycle | -3.4% | Global | Short term (2 years or less) |
| Elevated Cost of Capital | -2.1% | Europe, Emerging Markets | Short term (2 years or less) |
| Brownfield Swap-Out Lock-In | -1.8% | Europe, Asia Pacific | Medium term (2 to 4 years) |
| Performance Parity Gaps in Massive MIMO | -1.3% | Global | Medium term (2 to 4 years) |
| Restrictive Procurement in China | -1.0% | China | Long term (4 years or more) |
Operator CapEx Contraction Cycle
The main restraint is the drop in operator spending after the 5G build-out peak. Operators are earning weak returns on 5G and have little pricing power, so they are holding back new network spend. Per GSMA Mobile Economy data, global operator capex fell from about $190 billion at the 2022 peak toward roughly $170 billion by 2025.
The cuts show up directly in vendor results. According to Ericsson and Nokia annual reports, Ericsson’s RAN sales fell by around 20% year-on-year in parts of 2023–2024, and Nokia’s Mobile Networks segment fell by more than 25% in 2024. Per OECD telecom investment statistics, capex intensity has slid from about 18% to near 15% of revenue.
Because spending is now planned against a shrinking budget, new virtualization projects get pushed back by 6–12 months. Vendors face gross margin pressure of about 200–400 basis points as they trade price discounts for access to new deployments.
Challenges
| Challenge | (~) % CAGR Friction Drag | Geographic Relevance | Mitigation Horizon |
|---|---|---|---|
| Multi-Vendor Integration Complexity | -2.6% | Global | Medium term (2 to 4 years) |
| Cloud-Native Telecom Talent Shortage | -1.7% | North America, Europe, India | Long term (4 years or more) |
| Open Fronthaul Security Exposure | -1.2% | U.S., EU | Medium term (2 to 4 years) |
| Accelerator Silicon Supply Concentration | -0.9% | Global | Medium term (2 to 4 years) |
| Fragmented Interface Standards | -0.7% | Global | Long term (4 years or more) |
Multi-Vendor Integration Complexity
The biggest ongoing challenge is that responsibility for making the network work moves from one vendor to the operator. When radios, distributed units, cloud platform, and orchestration come from different suppliers, the operator has to integrate and test them all. Per O-RAN ALLIANCE plugfest reports, interoperability testing for a single multi-vendor configuration can take 9–18 months, compared with 3–6 months for a single-vendor stack.
This adds direct cost. According to DISH/EchoStar SEC filings, early systems-integration costs ran to a significant share of total network opex. Telecom Infra Project findings suggest integration can absorb about 10–15% of first-wave deployment budgets. Per NTIA Wireless Innovation Fund grant scopes, more than $140 million has been awarded for testing and integration labs alone.
Opportunities
| Opportunity | (~) % Potential CAGR Upside | Geographic Relevance | Execution Window |
|---|---|---|---|
| Enterprise Private 5G vRAN | +2.8% | North America, Europe, Japan | Medium term (2 to 4 years) |
| RAN-as-a-Service Monetization | +2.1% | Emerging Markets, Africa | Medium term (2 to 4 years) |
| AI-RAN Compute Co-Monetization | +1.9% | North America, Asia Pacific | Long term (4 years or more) |
| Rural & Neutral-Host Coverage | +1.4% | India, Southeast Asia, Latin America | Medium term (2 to 4 years) |
| 6G Software-Upgrade Pathway | +1.0% | Global | Long term (4 years or more) |
| Non-Terrestrial Network Integration | +0.8% | Global | Long term (4 years or more) |
Enterprise Private 5G vRAN
Private 5G for enterprises is still mostly untapped. The licensing groundwork is already in place: per FCC CBRS auction records, more than 22,000 Priority Access Licenses have been issued, and according to Germany’s BNetzA and Japan’s MIC local-5G registries, over 350 industrial spectrum assignments have been made.
Virtualized RAN suits this market because it can run on servers already sitting at the enterprise edge. Hewlett Packard Enterprise and Dell investor briefings indicate this co-location could cut cost per site by about 30–40% compared with appliance-based small-cell systems.
The upside comes from subscription pricing. Selling per-site software subscriptions bundled with managed orchestration could lift vendor gross margins from about 45% on hardware-led deals to 65–70%. It could also open a sizable segment of unmet industrial connectivity demand that operator-focused sales channels have not reached.
Key Players Analysis
Tier 1 leaders include Ericsson, Nokia, and Samsung Electronics. Ericsson reported net sales of SEK 247.9 billion in 2024. It spends heavily on R&D to make its cloud RAN run on many chip platforms. Its USD 14 billion AT&T deal makes it the largest cloud RAN supplier in the US.
Nokia posted FY2025 net sales of EUR 19.9 billion. It raised R&D spending by 8% to EUR 4.9 billion. Its Mobile Networks unit earned EUR 1.729 billion in Q1 2025 and grew 6% in Q4. Nvidia invested USD 1 billion in Nokia in 2025 to support AI-RAN work.
Samsung leads in pure vRAN. It powers about 60,000 Verizon vRAN sites. It also won open RAN contracts with Vodafone, Orange, and TELUS. NEC and Fujitsu are strong in Japan and in open RAN radios.
Tier 2 challengers compete in niches. Mavenir removed more than USD 1.3 billion of debt and gained USD 300 million in new financing. Rakuten Symphony sells its cloud-native platform to operators worldwide. Parallel Wireless, Airspan, JMA Wireless, Radisys, and Celona serve rural, in-building, and private enterprise networks.
Top Key Players in the Market
- Mavenir Systems, Inc.
- Parallel Wireless, Inc.
- Rakuten Symphony, Inc.
- Samsung Electronics Co., Ltd.
- Nokia Corporation
- Telefonaktiebolaget LM Ericsson
- NEC Corporation
- Fujitsu Limited
- Airspan Networks Inc.
- JMA Wireless, Inc.
- Radisys Corporation
- Celona Inc.
Recent Developments
- In August 2025, Mavenir Systems finished a recapitalization that removed more than USD 1.3 billion of debt and added USD 300 million in new financing.
- In October 2025, Vodafone chose Samsung Electronics as its main open RAN partner in Germany and other European markets for 5 years. The deal covers thousands of vRAN sites.
- In October 2025, Nvidia agreed to invest USD 1 billion in Nokia Corporation to build AI-RAN products for 5G and 6G.
- In February 2026, Samsung Electronics and Orange Group grew their vRAN and open RAN partnership. They will add more sites in 2026, building on pilots that began in 2023.
- In June 2026, Verizon confirmed it runs about 60,000 Samsung Electronics vRAN sites, up from 22,900 sites in early 2025.
Report Scope
| Report Features | Description |
|---|---|
| Market Value (2025) | USD 5.8 Billion |
| Forecast Revenue (2035) | USD 137.1 Billion |
| CAGR (2026-2035) | 37.2% |
| Base Year for Estimation | 2025 |
| Historic Period | 2020-2024 |
| Forecast Period | 2026-2035 |
| Report Coverage | Revenue Forecast, Market Dynamics, Competitive Landscape, Recent Developments |
| Segments Covered | By Software Layer (Distributed Unit Software, Radio Unit and Low-PHY Software, RAN Intelligent Controller and Automation Software, Operations, Administration, and Orchestration Software, Rest of Virtualized RAN Software); By Architecture (Open vRAN, Cloud-Native vRAN, Proprietary vRAN, Hybrid vRAN); By Deployment (Cloud-Native vRAN, On Premise); By Network Generation (5G New Radio, 4G/LTE, 3G and Legacy Modernization); By End User (Mobile Network Operators, Enterprises and Industrial Organizations, Neutral Hosts and Tower Companies, Government and Defense Organizations) |
| Regional Analysis | North America – US, Canada; Europe – Germany, France, The UK, Spain, Italy, Rest of Europe; Asia Pacific – China, Japan, South Korea, India, Australia, Singapore, Rest of APAC; Latin America – Brazil, Mexico, Rest of Latin America; Middle East & Africa – GCC, South Africa, Rest of MEA |
| Competitive Landscape | Mavenir Systems, Inc., Parallel Wireless, Inc., Rakuten Symphony, Inc., Samsung Electronics Co., Ltd., Nokia Corporation, Telefonaktiebolaget LM Ericsson, NEC Corporation, Fujitsu Limited, Airspan Networks Inc., JMA Wireless, Inc., Radisys Corporation, Celona Inc. |
| Customization Scope | Customization for segments and region/country-level will be provided. Moreover, additional customization can be done based on the requirements. |
| Purchase Options | We have three licenses to opt for: Single User License, Multi-User License (Up to 5 Users), Corporate Use License (Unlimited Users and Printable PDF) |