
U.S. Billiards & Accessories Market Size, Share, Growth Analysis By Billiards Table (Pool, Snooker, Carom, Others), By Accessories (Racks/Triangles/Diamonds, Chalk and Chalk Holders, Cue Cases and Cue Stands, Cue Tip Tools, Others), By Material (Slate, Wooden, Acrylic), By Distribution Channel (Offline, Online), By Region and Companies - Industry Segment Outlook, Market Assessment, Competition Scenario, Statistics, Trends and Forecast 2025-2034
- Published date: Dec 2025
- Report ID: 168523
- Number of Pages: 258
- Format:
-
keyboard_arrow_up
Quick Navigation
Report Overview
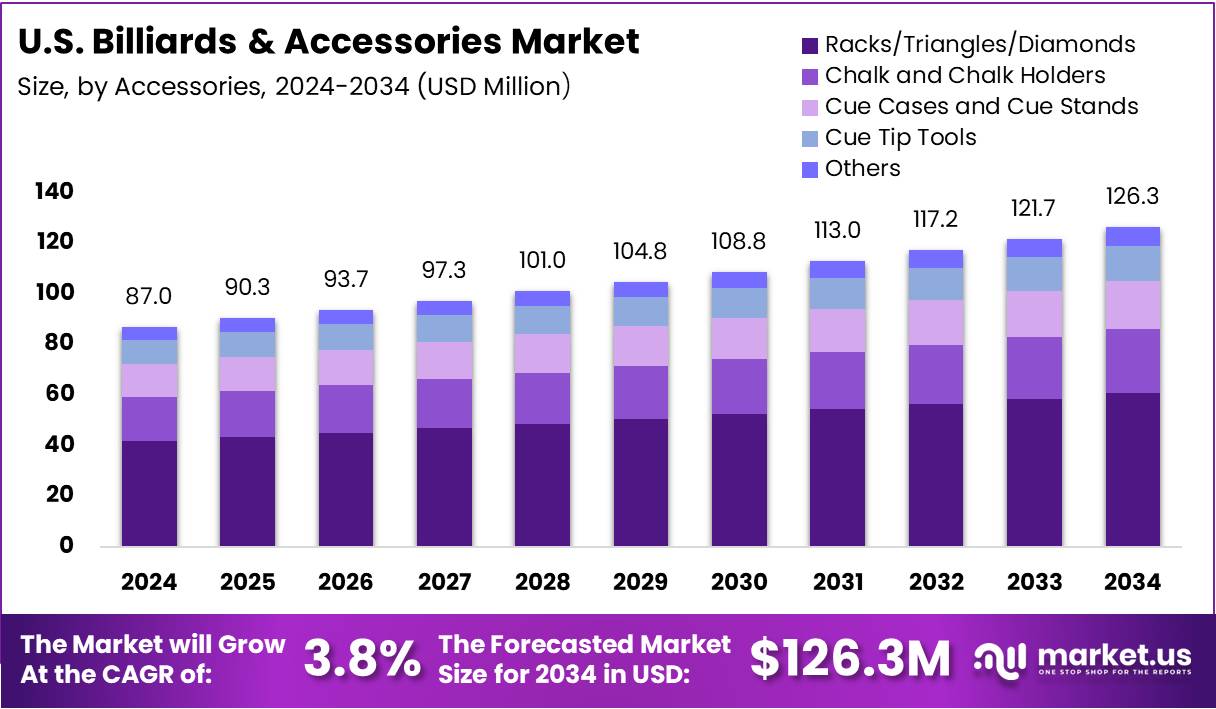
The U.S. Billiards & Accessories Market size is expected to be worth around USD 126.3 Million by 2034, from USD 87.0 Million in 2024, growing at a CAGR of 3.8% during the forecast period from 2025 to 2034.
The U.S. Billiards & Accessories Market reflects steady growth supported by rising indoor-recreation spending and expanding home-entertainment setups. Consumers increasingly invest in tables, cues, chalk, and other accessories as they seek premium leisure activities. Strong interest in cue sports continues to drive consistent demand across households, clubs, and commercial entertainment venues.
Moving ahead, the market benefits from lifestyle upgrades and broader adoption of recreation rooms in urban homes. The shift toward indoor leisure activities strengthens product preference for high-quality materials and well-designed accessories. Replacement cycles remain healthy, with consumers frequently upgrading cues, cue tips, and maintenance tools to enhance playing performance.
Furthermore, expanding experiential entertainment venues across U.S. cities creates recurring opportunities. These venues prioritize modern billiards setups to increase customer engagement, generating demand for tables and accessory bundles. Compact and space-saving table formats also gain popularity among young buyers seeking functional home-entertainment solutions, strengthening market penetration.
In addition, government investment in community recreation centers indirectly boosts market activity. Many facilities incorporate indoor sports equipment, including billiards setups, to support participation programs. While regulatory oversight is limited, basic facility standards influence product quality, safety, and design requirements, guiding equipment selection across both public and private institutions.
As trends evolve, the market benefits from rising interest in sustainable materials and smart accessories. Enhanced table designs, digital scoring features, and durable cue components encourage consumers to upgrade. The shift toward online research and e-commerce purchasing further improves accessibility, enabling retailers to capture broader demand for U.S. Billiards & Accessories products.
Finally, industry growth is reinforced by widely recognized table specifications used across the country. English billiards traditionally uses a 6-ft 1.5-inch by 12-ft table with three balls, supporting a niche but steady segment. Professional American pool maintains the 9-ft table as the standard for competitive 8-ball and 9-ball play.
Key Takeaways
- U.S. Billiards & Accessories Market valued at USD 87.0 Million (2024) is projected to reach USD 126.3 Million (2034) with a 3.8% CAGR, showing steady long-term growth.
- Pool segment leads the Billiards Table category with a dominant 67.4% share in 2024, driven by strong home-recreation adoption.
- Racks/Triangles/Diamonds dominate the Accessories segment with 48.1% in 2024, reflecting essential use across all gameplay formats.
- Slate material accounts for a leading 69.3% share in 2024, supported by high durability and precision performance.
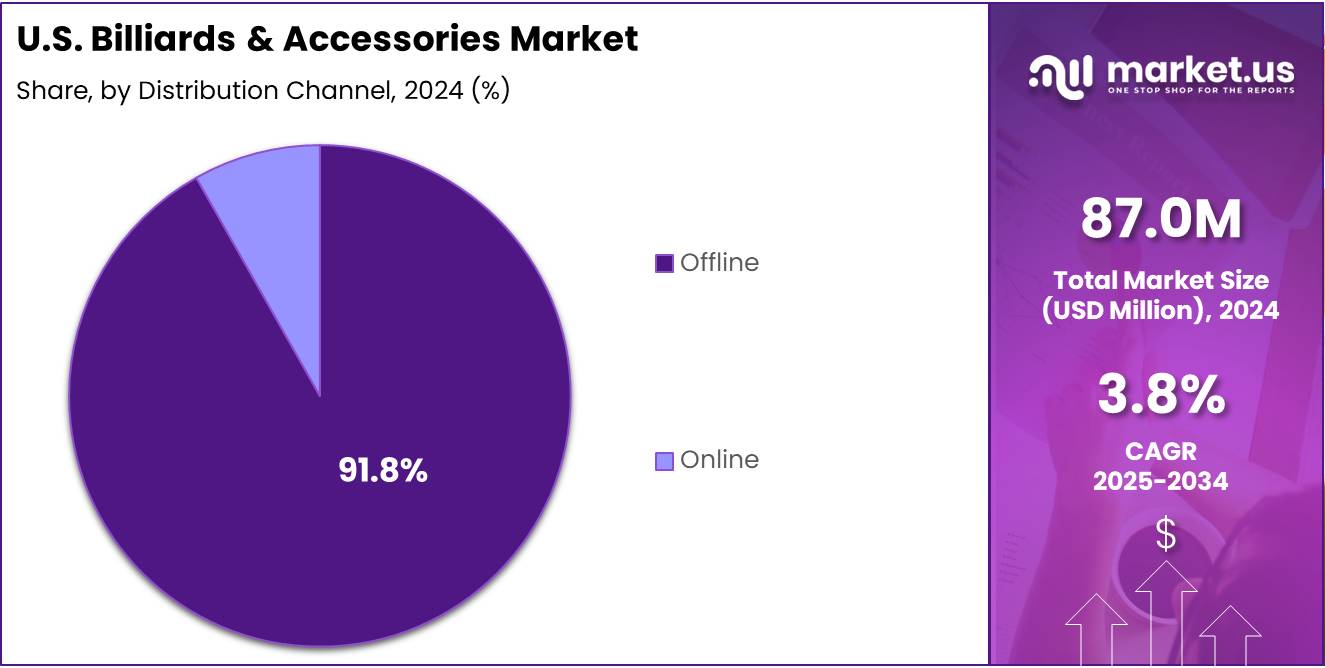
- Offline distribution channels hold a strong 91.8% market share in 2024, as buyers prefer in-store inspection and installation support.
Pool Analysis
Pool dominates with 67.4% due to its strong adoption in home recreation and commercial gaming spaces.
In 2024, Pool held a dominant market position in the By Billiards Table segment of the U.S. Billiards & Accessories Market, with a 67.4% share. The category continues to lead as consumers increasingly prefer standard pool formats for both leisure and competitive play, supporting steady market traction.
Snooker showed steady demand within the table segment. Although it did not match the reach of pool, its presence grew as niche players and training academies increased adoption. Its appeal among skilled cue-sport enthusiasts sustained gradual expansion across select U.S. recreational venues.
Carom tables maintained a small but consistent user base. The segment benefited from rising interest among hobby players seeking alternative cue-sport formats. While still emerging, its growth was supported by specialty clubs and communities that promoted diverse playing styles beyond mainstream table formats.
Others captured additional niche formats within the U.S. table market. These variations appealed to buyers seeking unique recreational setups. Though limited in scale, the segment leveraged customization trends, allowing households and boutique entertainment centers to adopt tables suited to personalized gaming experiences.
Racks/Triangles/Diamonds Analysis
Racks/Triangles/Diamonds dominate with 48.1% due to their essential role in game setup across formats.
In 2024, Racks/Triangles/Diamonds held a dominant position in the By Accessories segment of the U.S. market, securing a 48.1% share. Their necessity in organizing gameplay across all cue-sport formats ensured widespread usage, making them the most relied-upon accessories in both casual and professional environments.
Chalk and Chalk Holders continued to show consistent adoption. Players across all skill levels used chalk products to enhance cue-tip friction and accuracy. The segment advanced as retailers expanded availability of high-quality chalk options, reinforcing its role as an indispensable part of billiards performance.
Cue Cases and Cue Stands gained traction as players increasingly invested in equipment protection and storage solutions. Growth was driven by rising cue purchases and recreational venue upgrades. These accessories helped users maintain cue longevity, supporting their steady involvement in the accessories market.
Cue Tip Tools remained relevant among players who prioritised cue maintenance. These tools assisted in shaping, scuffing, and preserving cue tips, improving play consistency. Their demand improved gradually as more users began personal upkeep of cue equipment without relying solely on service professionals.
Others in accessories covered diverse supplemental products used by hobbyists and commercial venues. While varied in type, these items contributed additional value to gameplay experiences, appealing mainly to buyers seeking convenience-based enhancements for frequent recreational use and table maintenance.
Slate Analysis
Slate dominates with 69.3% due to its precision, durability, and high-quality playing surface.
In 2024, Slate held a dominant market position in the By Material segment of the U.S. Billiards & Accessories Market, with a strong 69.3% share. The segment continued leading due to slate’s accuracy and longevity, making it the preferred choice for premium and professional-grade tables nationwide.
Wooden tables remained relevant for cost-conscious consumers and recreational households. Although they lacked the precision of slate, their affordability helped maintain steady sales. Growing preference for lightweight and easily movable tables further supported the segment’s continued presence in the market.
Acrylic tables saw rising interest among modern entertainment spaces. Their appeal came from sleek aesthetics and lower maintenance needs. While still a smaller segment, acrylic options advanced gradually as younger consumers and themed gaming lounges adopted contemporary-styled table designs.
Offline Analysis
Offline dominates with 91.8% because buyers prefer hands-on inspection and in-store product assurance.
In 2024, Offline channels held a dominant market position in the By Distribution Channel segment of the U.S. Billiards & Accessories Market, securing a strong 91.8% share. Customers favored physical stores for table inspection, installation support, and quality verification, ensuring the channel’s substantial lead across the market.
Online channels continued expanding as digital convenience improved purchase experiences. Buyers increasingly explored web-based catalogs and customization options for accessories. Although smaller, this segment steadily progressed as e-commerce platforms enhanced product delivery, customer support, and comparison features for a smoother buying process.
Key Market Segments
By Billiards Table
- Pool
- Snooker
- Carom
- Others
By Accessories
- Racks/Triangles/Diamonds
- Chalk and Chalk Holders
- Cue Cases and Cue Stands
- Cue Tip Tools
- Others
By Material
- Slate
- Wooden
- Acrylic
By Distribution Channel
- Offline
- Online
Drivers
Growing Home Entertainment Spending Among U.S. Households Drives Market Growth
Rising home entertainment spending across U.S. households is a key driver boosting the Billiards & Accessories Market. Many consumers are investing in indoor recreation options to enhance family time and create engaging home environments. This shift is strongly influenced by lifestyle changes, with buyers increasingly preferring premium-quality tables, cues, and accessories as part of their home entertainment upgrades.
The growing popularity of recreational indoor games is another major factor supporting market expansion. Family-oriented spaces such as basements, game rooms, and community centers are adopting billiards tables to encourage social interaction and leisure activities. This trend is also strengthened by the appeal of billiards as an inclusive and easy-to-learn activity that caters to different age groups.
Demand for high-quality American-made billiard tables and accessories continues to rise as consumers prioritize durability, craftsmanship, and long-term value. U.S. manufacturers benefit from strong brand trust, making domestically produced products a preferred choice in both residential and commercial spaces. As more customers seek reliable, aesthetically designed, and premium-built products, American-made offerings remain a significant growth driver for the overall market.
Restraints
Declining Foot Traffic in Traditional Billiards Halls Across Urban Regions
The U.S. Billiards & Accessories Market is facing pressure as many traditional billiards halls across major urban regions are witnessing a steady decline in foot traffic. Changing consumer entertainment habits, such as the shift toward digital gaming and rising interest in home-based activities, are reducing the number of visits to dedicated pool halls. This trend limits repeat purchases of cues, chalk, and replacement accessories from commercial venues, ultimately slowing market expansion. As fewer players engage in out-of-home billiards, demand from commercial buyers weakens, affecting overall sales momentum.
Another key restraint is the limited home space available for full-size billiard tables, especially in urban apartments and compact housing units. Many U.S. consumers prefer multifunctional furniture and minimalistic interior layouts, making it difficult to allocate space for a standard 7- or 8-foot table. This restricts household adoption and forces buyers to consider smaller or folding options, which may not deliver the same performance as traditional tables. As a result, the premium table segment sees slower growth, and manufacturers face challenges in expanding their high-value product range.
Growth Factors
Rising Demand for Customizable Cues and Personalized Billiard Accessories
The U.S. billiards and accessories market is seeing new growth opportunities as compact and foldable billiard table formats gain popularity. Many households prefer space-saving designs, especially in apartments and smaller homes. These formats allow more consumers to enjoy billiards without needing a dedicated room, expanding the market’s reach across urban areas.
Another major opportunity comes from the rising demand for customizable cues and personalized accessories. Players today want products that reflect their style, performance needs, and comfort. This shift is encouraging brands to offer tailored cue weights, grip materials, engravings, and premium finishes. The growing interest in personalization helps manufacturers create strong customer loyalty while also supporting higher-value sales.
Youth-focused billiards programs and amateur leagues are also becoming important expansion areas. These initiatives are increasing skill development and early engagement among younger players. As more schools, community centers, and clubs invest in training programs, demand for beginner-friendly tables, cues, and accessories is expected to rise. Amateur league memberships are further strengthening participation, supporting long-term market growth as players continue purchasing billiards equipment throughout their journey.
Emerging Trends
Growing Interest in Technology-Enabled and Eco-Friendly Billiards Products
The U.S. billiards and accessories market is increasingly shaped by digital upgrades. The adoption of digital scoring systems and smart cue technologies is gaining traction as players look for easier game tracking and more precise performance insights. These features are becoming common in both home settings and training centers, supporting a shift toward modern, tech-enabled gameplay. This trend is also appealing to younger users who prefer connected and interactive products.
Another major trend is the rising demand for eco-friendly billiards accessories. Consumers are showing greater interest in sustainable table covers, wooden cues made from responsibly sourced materials, and balls produced using recycled composites. This shift reflects broader environmental awareness in the U.S. market, where players value products that reduce waste without compromising quality. Brands that highlight sustainability are gaining stronger visibility among modern buyers.
Social media is also reshaping the industry. The growing popularity of trick-shot culture, driven by social media platforms, is encouraging more people to engage with billiards content and try new accessories. This digital influence boosts demand for high-performance cues, props, and training tools as players aim to replicate or create viral trick shots. As a result, social-driven engagement is becoming a powerful factor in market momentum.
Key U.S. Billiards & Accessories Company Insights
Xingpai Billiards continues to leverage scale and vertical integration to maintain cost leadership in the U.S. market, translating into competitive pricing and reliable channel supply. Its diversified product portfolio and strong OEM relationships support steady volume growth, while strategic investments in manufacturing efficiency and selective automation help protect margins amid raw-material volatility and shifting freight dynamics.
Escalade Sports has focused on brand-building and retail partnerships, reinforcing its presence across both specialty and mass channels and expanding omnichannel capabilities. By pushing value-tier products and bundled offerings, the company captures casual buyers and benefits from seasonal demand spikes tied to home-entertainment trends, while incremental digital marketing and licensing initiatives broaden awareness and drive conversion.
Chevillotte Billiards positions itself as a premium artisan manufacturer, emphasizing craftsmanship and bespoke table solutions that appeal to affluent consumers and commercial venues. This focus on high-end differentiation allows Chevillotte to command price premiums and sustain healthy dealer margins, although its niche orientation limits rapid scale expansion; continued focus on after-sales service and customization will be critical for repeat business.
Olhausen Billiard MFG, Inc remains a stalwart in the traditional American-made segment, leveraging reputation, long warranties and robust dealer networks to drive loyalty among serious players. Its consistent quality, targeted dealer support programs and selective product upgrades make Olhausen resilient to low-cost imports, while initiatives aimed at modular designs and youth-focused promotions seek to broaden long-term market relevance, including selective partnerships with youth training programs and regional tournaments to stimulate participation. Overall, each firm shows distinct strategic clarity.
Top Key Players in the Market
- Xingpai Billiards
- Escalade Sports
- Chevillotte Billiards
- Olhausen Billiard MFG, Inc
- Betson Enterprises
- Diamond Billiard Products Inc.
- Sharma Billiard Accessories
- Wiraka Pte Ltd
- Valley Dynamo
- EastPoint Sports Ltd. LLC
Recent Developments
- In September 2025, Blue Moon Leisure and other manufacturers announced the launch of their new cue ranges for the 2025-2026 pool and snooker season. This release aims to cater to players at every level, from beginners to top-tier professionals, providing options across various budgets.
- In February 2025, Moa Capital acquired Seybert’s Billiard Supply (“Seybert’s”), a leading retailer of pool cues, tables, and accessories. This acquisition strengthens Moa Capital’s position in the billiards market, expanding its reach to enthusiasts across the country.
- In October 2025, Cuetec partnered with the World Nineball Tour for their first-ever cue collaboration. The partnership focuses on launching innovative cue designs intended to enhance player performance while engaging fans and promoting the sport.
Report Scope
Report Features Description Market Value (2024) USD 87.0 Million Forecast Revenue (2034) USD 126.3 Million CAGR (2025-2034) 3.8% Base Year for Estimation 2024 Historic Period 2020-2023 Forecast Period 2025-2034 Report Coverage Revenue Forecast, Market Dynamics, Competitive Landscape, Recent Developments Segments Covered By Billiards Table (Pool, Snooker, Carom, Others), By Accessories (Racks/Triangles/Diamonds, Chalk and Chalk Holders, Cue Cases and Cue Stands, Cue Tip Tools, Others), By Material (Slate, Wooden, Acrylic), By Distribution Channel (Offline, Online) Competitive Landscape Xingpai Billiards, Escalade Sports, Chevillotte Billiards, Olhausen Billiard MFG, Inc, Betson Enterprises, Diamond Billiard Products Inc., Sharma Billiard Accessories, Wiraka Pte Ltd, Valley Dynamo, EastPoint Sports Ltd. LLC Customization Scope Customization for segments will be provided. Moreover, additional customization can be done based on the requirements. Purchase Options We have three licenses to opt for: Single User License, Multi-User License (Up to 5 Users), Corporate Use License (Unlimited User and Printable PDF)  U.S. Billiards & Accessories MarketPublished date: Dec 2025add_shopping_cartBuy Now get_appDownload Sample
 -
-
- Xingpai Billiards
- Escalade Sports
- Chevillotte Billiards
- Olhausen Billiard MFG, Inc
- Betson Enterprises
- Diamond Billiard Products Inc.
- Sharma Billiard Accessories
- Wiraka Pte Ltd
- Valley Dynamo
- EastPoint Sports Ltd. LLC
Our Clients
- 168523
- Dec 2025


