Report Overview
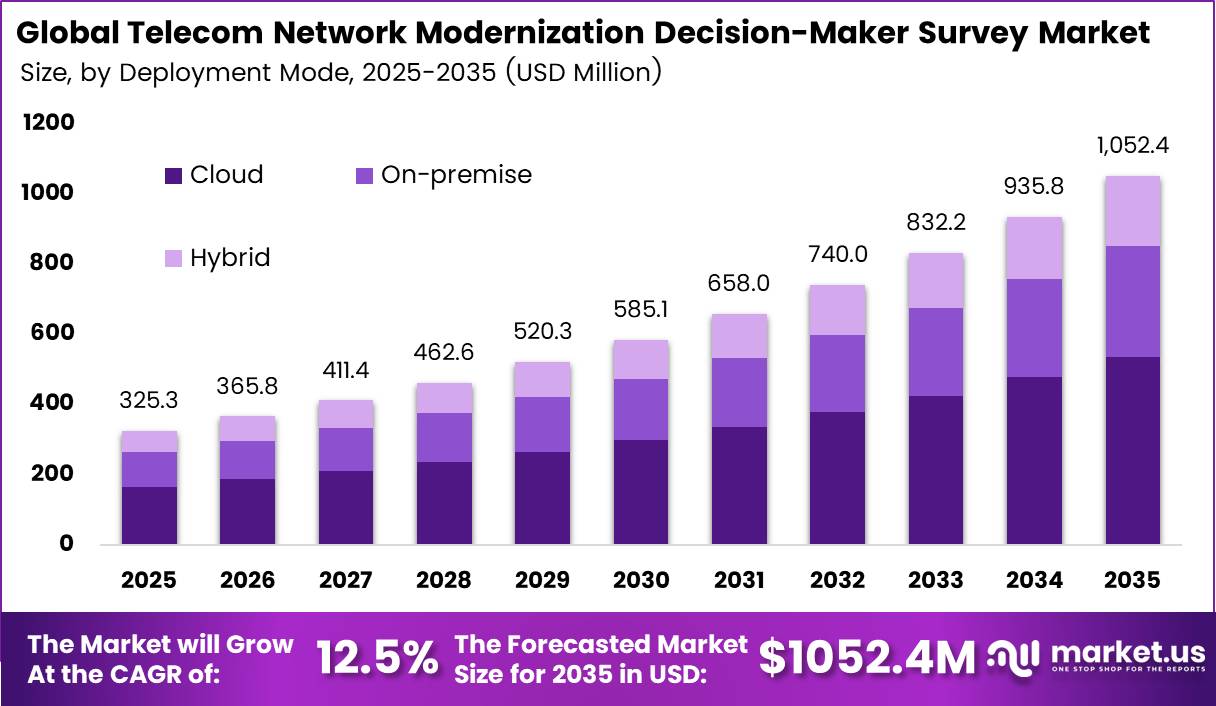
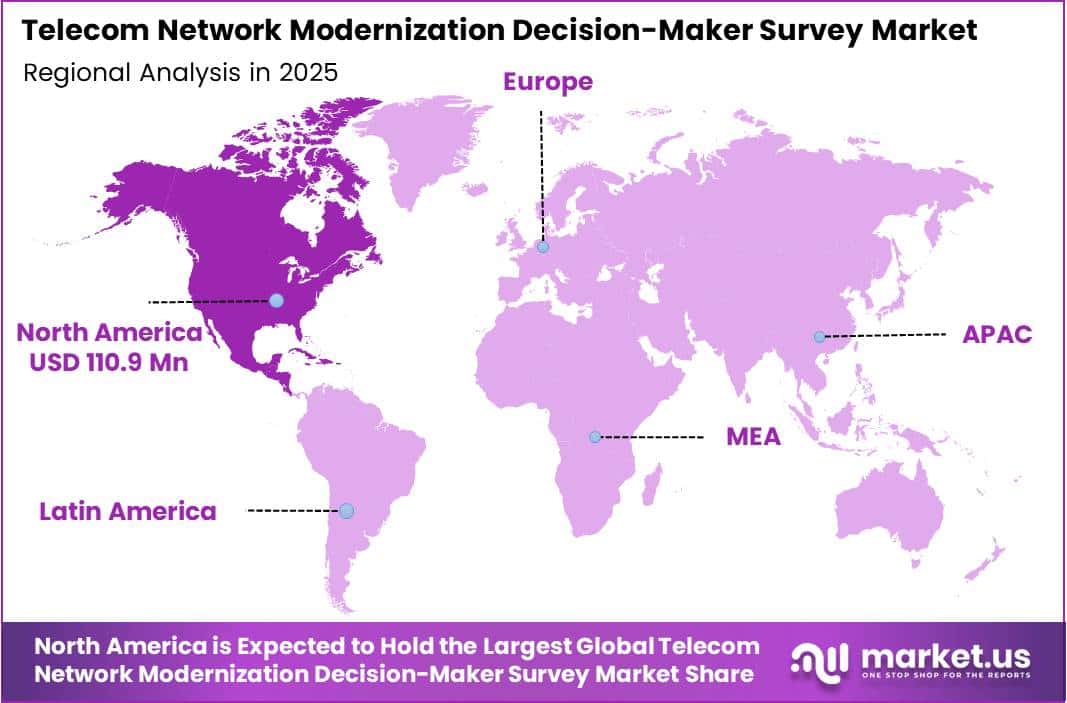
In 2025, the Global Telecom Network Modernization Decision-Maker Survey Market was valued at USD 325.3 million. The market is projected to grow at a CAGR of 12.5% during 2026–2035, reaching approximately USD 1,052.4 million by 2035. North America dominated the global market in 2025, accounting for more than 34.1% of the total market share and generating approximately USD 110.9 million in revenue.
Operators now face big upgrade choices, so they need structured feedback from network leaders. According to the GSMA, the mobile industry supports 8.8 billion wireless connections and 5.8 billion unique subscribers, which is about 70% of the world’s population. The GSMA also expects operators to spend about USD 1.2 trillion on mobile capex from 2025 to 2030.
The GSMA found that 45% of operators now treat AI monetization as a strategic priority. This creates steady demand for benchmarking studies that track how decision-makers rank these investments. North America has early 5G standalone rollouts, large spectrum holdings, and strong enterprise demand for private wireless.
Huawei’s 2025 annual report shows that about 95% of its added revenue came from outside China. That shift means global vendors compete hard for Western operator budgets. As a result, they buy more decision-maker research to shape their pitch. The GSMA expects mobile to add USD 11.3 trillion to the global economy by 2030, and North American firms lead much of this spending.
Key Takeaways
- The Telecom Network Modernization Decision-Maker Survey Market was worth USD 325.3 million in 2025 and is expected to reach USD 1,052.4 Million by 2035. at a CAGR of 12.5% from 2026 to 2035.
- By component, Data Collection and Panel Management lead with a 31.2% share.
- By deployment mode, Cloud leads with a 74.0% share.
- By network domain, Radio Access Network leads with a 38.1% share.
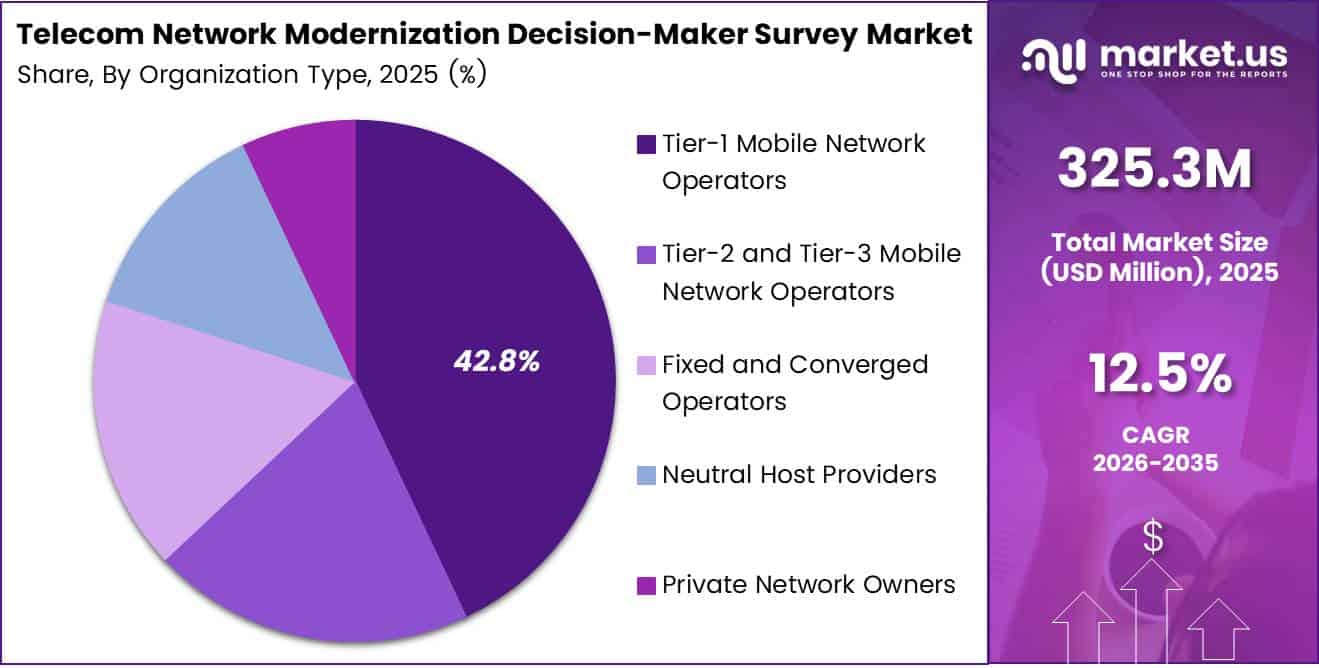
- By organization type, Tier-1 Mobile Network Operators lead with a 42.8% share.
- North America leads with a 34.1% share and USD 110.9 million in revenue.
By Component
Data Collection and Panel Management dominates with 31.2% due to hard-to-reach telecom executive respondent access.
Data Collection and Panel Management leads because every survey project starts with finding the right people. Telecom buyers are a small, busy group, so clients spend the most on vetted panels of CTOs, network planners, and procurement heads. Firms that own these panels control access, and that control sets the price for the whole project budget.
Scale also shapes demand. ITU estimates that 6 billion people use the Internet in 2025, while 2.2 billion are still offline. This gap pushes operators to plan big network upgrades, and they want fresh views from decision-makers in both connected and unconnected markets. Online panels let research teams reach these leaders across many countries at low cost.
Dashboard, Benchmarking, and Advisory Outputs grow fastest because buyers now want answers, not raw tables. GSA counts 644 operators in 191 countries and territories investing in 5G, and 361 of them have launched service. With so many peers, each operator wants to compare its plans against rivals. Live dashboards and advisory sessions turn survey data into clear next steps for budget owners.
By Deployment Mode
Cloud dominates with 74.0% due to fast multi-country survey fielding needs.
Cloud platforms lead this segment because survey teams must launch, track, and close studies across many time zones within days. A cloud tool lets analysts, clients, and translators work on one live file, so projects move faster and cost less. Clients can also see live response counts on the same screen. Vendors push regular updates without any client IT work.
Business habits support this shift. Eurostat reports that 52.7% of EU enterprises paid for cloud computing services in 2025, up 7.4 percentage points from 2023. Among those users, 85.2% used cloud e-mail, which shows how normal web-based tools have become for daily work. Telecom research buyers follow the same habit.
By Network Domain
Radio Access Network dominates with 38.1% due to heavy 5G radio site spending.
Radio Access Network studies lead because radio sites take the largest share of operator capital budgets. Each tower, antenna, and radio unit requires a buying decision, so operators survey their own teams and peers before choosing vendors or moving to Open RAN. Radio work also touches spectrum, energy use, and site rent, which adds even more questions to each study.
User growth keeps this demand high. Ericsson reports close to 3.3 billion 5G subscriptions worldwide, and operators added around 660 million of them during 2025. Mobile network data traffic also rose 23% between Q2 2025 and Q2 2026, so carriers must keep adding radio capacity and ask decision-makers where to spend first.
OSS/BSS and Service Orchestration grow fastest because 5G standalone networks need smart software to run. GSA identifies 181 operators in 73 countries investing in public 5G standalone, and at least 89 have launched services. These networks support slicing and automation, which forces operators to rethink their billing, assurance, and orchestration tools.
By Organization Type
Tier-1 Mobile Network Operators dominate with 42.8% due to large multi-market network modernization budgets.
Tier-1 Mobile Network Operators lead because they run the biggest networks and sign the biggest vendor contracts. These groups work in many countries, so they order repeat studies to test strategy, vendor choice, and spending plans across all their markets. Their large research budgets also let them pay for multi-wave tracking studies that smaller carriers cannot afford.
Their customers already expect advanced service. Ericsson data shows 5G subscription penetration at 79% in North America and 60% in Northeast Asia, where most large carriers are based. At these levels, top operators shift from rollout to fine-tuning, and they need regular feedback from decision-makers to guide each phase.
Private Network Owners grow fastest as factories, mines, ports, and campuses build their own wireless systems. GSA counts 1,846 private mobile network customers in 80 countries, up 7.7% from 1,714 in 2024. GSA also logged 74 new customer references in one quarter.
Key Market Segments
By Component
- Data Collection and Panel Management
- Survey Design and Questionnaire Programming
- Data Processing, Weighting, and Tabulation
- Dashboard, Benchmarking, and Advisory Outputs
By Deployment Mode
- Cloud
- On-premise
- Hybrid
By Network Domain
- Radio Access Network
- Core Network
- Transport and Optical Network
- OSS/BSS and Service Orchestration
- Edge, Private Wireless, and Non-Terrestrial Networks
By Organization Type
- Tier-1 Mobile Network Operators
- Tier-2 and Tier-3 Mobile Network Operators
- Fixed and Converged Operators
- Neutral Host Providers
- Private Network Owners
Geopolitical Impact Analysis
Trade tensions between the US and China change how operators choose vendors, and survey demand follows those choices. US tariffs on many Chinese electronics rose by 25% or more under Section 301, and the WTO has flagged trade restrictions that now cover hundreds of billions of dollars in goods. Higher radio and optical hardware costs push operators to rethink their vendor mix.
Shipping problems also add pressure. UNCTAD reported that Red Sea attacks cut Suez Canal transits by more than 50%. Ships going around the Cape of Good Hope added about 10 to 14 days to Asia-to-Europe trips. Late base stations and fiber gear delay rollouts, so operators ask research teams to track timing risk.
Commodity prices make the problem worse. The World Bank tracked copper prices above USD 9,000 per ton through much of 2025. Copper and rare metals feed cables, power units, and antennas. When input costs rise, network buyers survey peers on ways to stretch their capex.
The IMF warned that rising trade barriers could cut global output by up to 7% over the long term if the world splits into blocs. For telecom, this means separate vendor ecosystems by region. Survey firms now build country-level panels to show how decision-makers in each bloc respond to security rules and high-risk vendor bans.
Regional Analysis
North America dominates the Telecom Network Modernization Decision-Maker Survey Market, holding a 34.1% share and generating USD 110.9 million in revenue. The US has the largest group of Tier-1 operators that buy research at scale. These carriers spend billions each year on 5G standalone, fiber, and cloud core upgrades.
The FCC’s rip-and-replace program set aside about USD 4.98 billion to remove high-risk gear from US networks. That program forces small carriers to choose new vendors, and many of them use peer surveys to guide the choice. The FCC’s C-band auction raised about USD 81 billion, so carriers need to show a return on that spectrum.
Asia Pacific is the fastest-growing region in the market. China, India, Japan, and South Korea run some of the world’s largest 5G networks. India’s operators built a nationwide 5G network in about 2 years, and they now move into 5G standalone and fixed wireless. Japan and South Korea push open RAN and 6G research. Australia upgrades its regional networks. All of this creates fast demand for local decision-maker panels.
Europe holds a solid position, driven by EU security rules and Digital Decade targets. The EU wants gigabit coverage for all homes and 5G in all populated areas by 2030. Germany, France, the UK, Spain, and Italy are swapping out high-risk vendors and modernizing their core networks. Operators here run research on open RAN, energy savings, and network sharing to control costs.
Key Regions and Countries
North America
- US
- Canada
Europe
- Germany
- France
- The UK
- Spain
- Italy
- Rest of Europe
Asia Pacific
- China
- Japan
- South Korea
- India
- Australia
- Rest of APAC
Latin America
- Brazil
- Mexico
- Rest of Latin America
Middle East and Africa
- GCC
- South Africa
- Rest of MEA
Market Dynamics
Drivers
| Driver | (~) % Impact on CAGR Forecast | Geographic Relevance | Impact Timeline |
|---|---|---|---|
| 5G Standalone Core Migration Planning | +2.4% | Global, EMEA & Asia-Pacific Led | Short term (2 years or less) |
| vRAN & Open RAN Vendor Selection Cycles | +1.6% | North America, Europe, Japan | Medium term (2 to 4 years) |
| AI-Driven Network Automation Investment Benchmarking | +1.3% | Global | Short term (2 years or less) |
| Software-Centric Opex Spending Shift | +0.9% | North America, Western Europe | Medium term (2 to 4 years) |
| Fiber & FWA Backhaul Densification Programs | +0.7% | India, Southeast Asia, Latin America | Short term (2 years or less) |
5G Standalone Core Migration Planning
The move from non-standalone 5G to standalone (SA) cores is the biggest reason operators are commissioning decision-maker surveys right now. Global Mobile Suppliers Association tracking showed 163 operators in 65 countries investing in public 5G SA by April 2025, rising to 181 operators in 73 countries by December 2025, with at least 89 live public launches. EMEA now leads with 40 live SA networks.
Operator disclosures point the same way: EE in the UK reached 50% population SA coverage, and Reliance Jio runs 10 commercial network-slice types. Each SA migration means choosing a core vendor, deciding how to monetize slicing, and setting cloud-native operating models.
That has changed how survey research is bought. Operators and vendors are moving from one-off annual studies to subscription-style, rolling buyer-intent panels. Vendors use this to cut sales-cycle costs and to set pricing against peer benchmarks. This driver adds an estimated +2.4% to the 12.5% baseline.
Restraints
| Restraint | (~) % Impact on CAGR Forecast | Geographic Relevance | Impact Timeline |
|---|---|---|---|
| Operator CapEx Contraction & Research Budget Cuts | -1.5% | Global, China & Latin America Acute | Short term (2 years or less) |
| High-Risk Vendor Bans Restricting Respondent Access | -0.8% | US, EU, UK, India | Medium term (2 to 4 years) |
| Data Privacy & Cross-Border Transfer Rules | -0.6% | EU, China, India | Short term (2 years or less) |
| Elevated Cost of Capital | -0.5% | Emerging Markets, Europe | Short term (2 years or less) |
| Operator Consolidation Shrinking Buyer Pool | -0.4% | Europe, North America | Medium term (2 to 4 years) |
Operator CapEx Contraction & Research Budget Cuts
Lower operator capital spending is directly shrinking the budgets that pay for network-planning research. Aggregated operator filings show global telco capex fell 2.1% year on year in 2Q25 to $67.5B. Annualized capex fell 2.6% to $292.9B, the lowest 12-month total since 2011 and the lowest capital intensity since 2013.
The cuts are concentrated in a few large operators. Company reports show América Móvil down 24.5%, China Telecom down 22.9%, and China Unicom down 17.7%. Industry commentary in late 2026 describes a sharp drop in RAN equipment sales.
When capex falls, procurement teams cancel or delay discretionary survey commissions, and vendor marketing budgets tied to RAN revenue shrink with them. The result is fewer contracts, deferred multi-wave studies, and price pressure on survey providers, an estimated -1.5% drag on the baseline.
Challenges
| Challenge | (~) % CAGR Friction Drag | Geographic Relevance | Mitigation Horizon |
|---|---|---|---|
| Senior Respondent Panel Fatigue | -0.9% | Global | Medium term (2 to 4 years) |
| Small Tier-1 Respondent Universe | -0.6% | North America, Europe | Long term (4 years or more) |
| AI-Generated Response Contamination | -0.5% | Global | Short term (2 years or less) |
| Rapid Technology Taxonomy Obsolescence | -0.3% | Global | Medium term (2 to 4 years) |
| Telecom Domain Analyst Shortage | -0.3% | Asia-Pacific, Africa | Long term (4 years or more) |
Senior Respondent Panel Fatigue
The weakest point in this market is a small pool of qualified senior respondents who are being surveyed too often. Detailed RAN-architecture studies typically rely on samples of only 64 to 65 Tier 1 and Tier 2 operators worldwide. GSA’s count of 647 operators investing in 5G sets the maximum possible universe, and only a fraction of those have CTO-level staff who can answer architecture questions.
Survey providers have to adjust over the long term with verified closed panels, shorter adaptive questionnaires and ways to pay respondents back, such as peer-benchmark access. This challenge creates about -0.9% friction drag.
Opportunities
| Opportunity | (~) % Potential CAGR Upside | Geographic Relevance | Execution Window |
|---|---|---|---|
| 6G & 5G-Advanced Pre-Standard Intent Tracking | +1.8% | Japan, Korea, US, Europe | Medium term (2 to 4 years) |
| Private 5G Enterprise Buyer Surveys | +1.2% | Germany, US, China, Japan | Short term (2 years or less) |
| Emerging-Market Operator Panels | +0.8% | Africa, Latin America, South Asia | Medium term (2 to 4 years) |
| Subscription Benchmark Data Platforms | +0.7% | Global | Short term (2 years or less) |
| Network Energy & Sustainability Audits | +0.5% | EU, UK, Australia | Long term (4 years or more) |
6G & 5G-Advanced Pre-Standard Intent Tracking
Survey demand for 5G-Advanced and 6G is still largely untapped, unlike SA migration, which is already counted in the baseline. Global Mobile Suppliers Association tracking found only 26 operators in 15 countries investing in 5G-Advanced in 2025.
Operator surveys from 4Q 2025 show strong intent to adopt vRAN, Open RAN and 5G-A by 2030. They also show those plans could slip if vendors cannot prove the business case. 3GPP’s 6G study timeline leaves a gap before standards are set, so operators have not yet built long-running buyer-intent tracking for 6G use cases, spectrum priorities, or monetization.
Survey firms that build multi-year tracking panels now could charge a premium for the data and resell it over several waves. Repeating the same panel could cut cost per completed interview by an estimated 25% to 35% and lift gross margin by 6 to 9 percentage points. Fully executed, this would add an estimated +1.8% above the 12.5% baseline.
Key Players Analysis
Tier 1 leaders include Huawei, Ericsson, Nokia, and ZTE. These vendors shape operator choices, and their buyers form the core survey audience. Huawei reported 2025 revenue of CNY 880.9 billion, up 2.2%, with net profit of CNY 68 billion. It spent CNY 192.3 billion on R&D, which equals 21.8% of revenue.
Ericsson posted 2025 net sales of SEK 236.7 billion. Its adjusted EBITA margin rose to 18.1% from 11.0%, and it spent about SEK 48.9 billion on R&D. Nokia reported 2025 net sales of EUR 19.9 billion, up 3%. Its Mobile Networks unit earned EUR 7.8 billion, and its R&D spending grew 8% to EUR 4.86 billion.
Nokia closed its USD 2.3 billion purchase of Infinera in 2025, which made it stronger in optical transport. Hewlett Packard Enterprise finished its USD 14 billion deal for Juniper Networks in 2025. That deal changed the routing and AI-native networking field.
Tier 2 challengers include Samsung, Cisco, Ciena, NEC, Fujitsu, ADTRAN, and Ribbon. Samsung and NEC compete in open RAN. Ciena leads in optical gear and bought Nubis Communications for about USD 270 million. ADTRAN and Ribbon serve fiber access and voice core markets for regional operators.
Top Key Players in the Market
- Huawei Technologies Co., Ltd.
- Telefonaktiebolaget LM Ericsson
- Nokia Corporation
- ZTE Corporation
- Samsung Electronics Co., Ltd.
- Cisco Systems, Inc.
- Ciena Corporation
- NEC Corporation
- Fujitsu Limited
- Juniper Networks, Inc.
- ADTRAN Holdings, Inc.
- Ribbon Communications Inc.
Recent Developments
- In March 2026, Huawei Technologies Co., Ltd. reported a record R&D investment of CNY 192.3 billion for 2025, which brought its ten-year R&D total to CNY 1.382 trillion.
- In October 2025, Ciena Corporation agreed to acquire Nubis Communications for about USD 270 million to grow its high-speed interconnect business.
- In July 2025, Hewlett Packard Enterprise completed its USD 14 billion acquisition of Juniper Networks, Inc.
- In February 2025, Nokia Corporation completed its USD 2.3 billion acquisition of Infinera to grow its optical network business.
Report Scope
| Report Features | Description |
|---|---|
| Market Value (2025) | USD 325.3 Million |
| Forecast Revenue (2035) | USD 1,052.4 Million |
| CAGR (2026-2035) | 12.5% |
| Base Year for Estimation | 2025 |
| Historic Period | 2020-2024 |
| Forecast Period | 2026-2035 |
| Report Coverage | Revenue Forecast, Market Dynamics, Competitive Landscape, Recent Developments |
| Segments Covered | By Component (Data Collection and Panel Management, Survey Design and Questionnaire Programming, Data Processing, Weighting, and Tabulation, Dashboard, Benchmarking, and Advisory Outputs); By Deployment Mode (Cloud, On-premises, Hybrid); By Network Domain (Radio Access Network, Core Network, Transport and Optical Network, OSS/BSS and Service Orchestration, Edge, Private Wireless, and Non-Terrestrial Networks); By Organization Type (Tier-1 Mobile Network Operators, Tier-2 and Tier-3 Mobile Network Operators, Fixed and Converged Operators, Neutral Host Providers, Private Network Owners) |
| Regional Analysis | North America – US, Canada; Europe – Germany, France, The UK, Spain, Italy, Rest of Europe; Asia Pacific – China, Japan, South Korea, India, Australia, Singapore, Rest of APAC; Latin America – Brazil, Mexico, Rest of Latin America; Middle East & Africa – GCC, South Africa, Rest of MEA |
| Competitive Landscape | Huawei Technologies Co., Ltd., Telefonaktiebolaget LM Ericsson, Nokia Corporation, ZTE Corporation, Samsung Electronics Co., Ltd., Cisco Systems, Inc., Ciena Corporation, NEC Corporation, Fujitsu Limited, Juniper Networks, Inc., ADTRAN Holdings, Inc., Ribbon Communications Inc. |
| Customization Scope | Customization for segments and region/country-level will be provided. Moreover, additional customization can be done based on the requirements. |
| Purchase Options | We have three licenses to opt for: Single User License, Multi-User License (Up to 5 Users), Corporate Use License (Unlimited Users and Printable PDF) |