
Global Streaming Data Observability Market By Deployment Mode (Cloud-based, On-premises), By Application (Real-time Data Pipeline Health Monitoring, Stream Processing Job Performance, End-to-End Latency and Lag Tracking, Data Quality in Motion, Others), By End-User Industry (Financial Services and Trading, Technology and Internet Services, Telecommunications, Media and Entertainment, Others), By Regional Analysis, Global Trends and Opportunity, Future Outlook By 2025-2035
- Published date: Feb. 2026
- Report ID: 177829
- Number of Pages: 227
- Format:
-
keyboard_arrow_up
Quick Navigation
- Report Overview
- Top Market Takeaways
- Driver Impact Analysis
- Restraints Impact Analysis
- By Deployment Mode
- By Application
- By End User Industry
- Investor Type Impact Matrix
- Technology Enablement Analysis
- Key Challenges
- Emerging Trends
- Growth Factors
- Key Market Segments
- Regional Analysis
- Competitive Analysis
- Future Outlook
- Recent Developments
- Report Scope
Report Overview
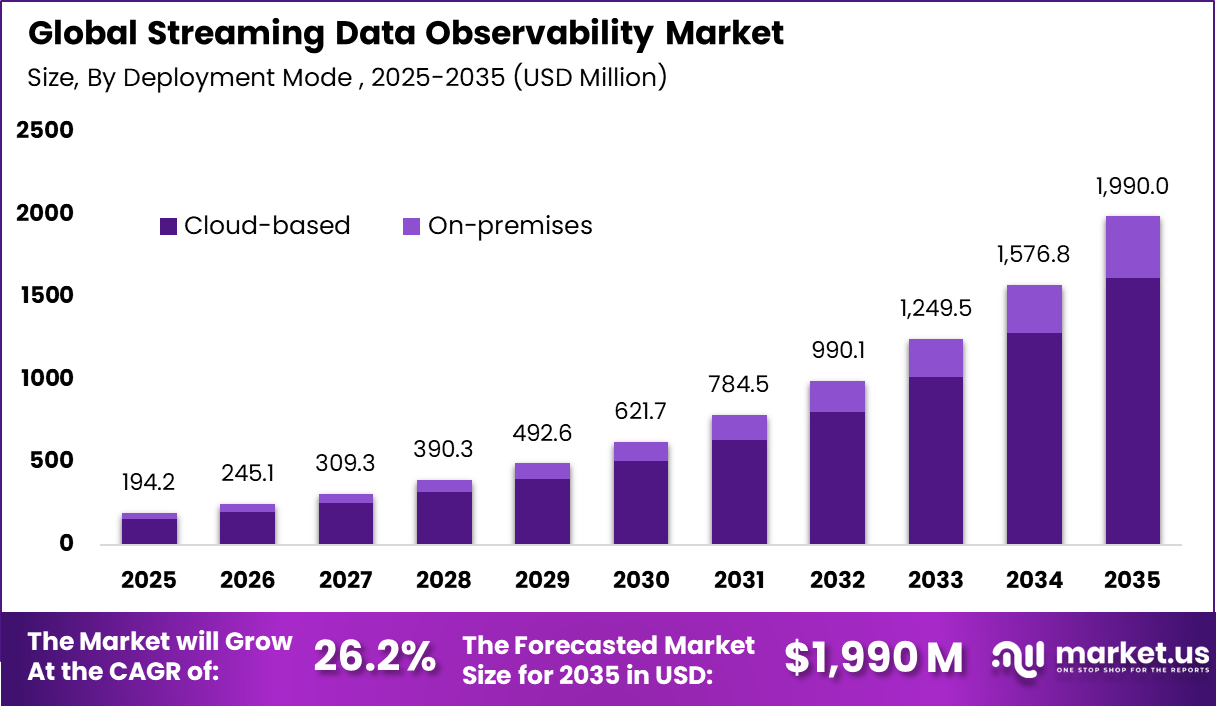
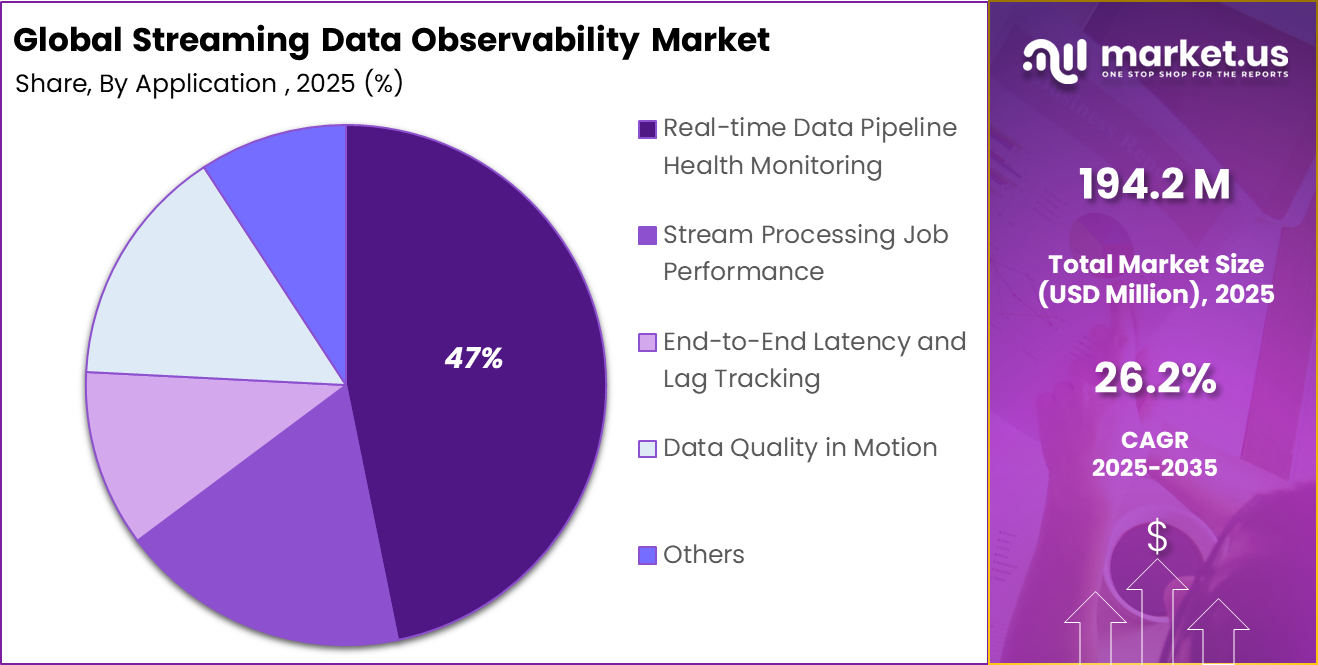
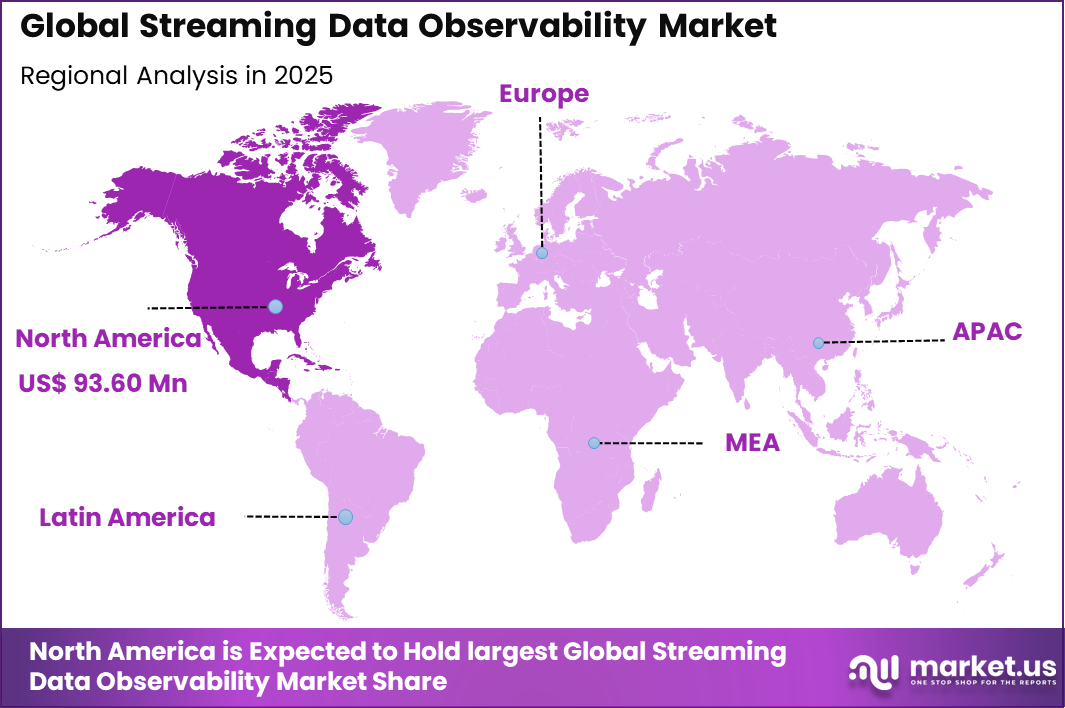
The Global Streaming Data Observability Market generated USD 194.2 million in 2025 and is predicted to register growth from USD 245.1 million in 2026 to about USD 1,990 million by 2035, recording a CAGR of 26.2% throughout the forecast span. In 2025, North America held a dominan market position, capturing more than a 48.2% share, holding USD 93.60 Million revenue.
The Streaming Data Observability Market focuses on monitoring, validating, and troubleshooting continuous data flows that move through event streams and real time pipelines. Unlike traditional batch data systems, streaming environments require constant reliability because even short disruptions can cause data loss, incorrect analytics, or delayed operational decisions. Observability in this context covers pipeline latency, message delivery integrity, schema stability, and processing failures across distributed systems.
One major driver of the Streaming Data Observability Market is the growing adoption of real time decision making across industries. Organizations seek immediate insight into customer behavior, fraud signals, supply chain events, and service performance. Traditional monitoring cannot keep pace with continuous flows, so dedicated observability solutions fill this gap. The emphasis on minimizing downtime and catching errors early drives investment in real time visibility.
Demand for streaming data observability is strongest within organizations that handle high volume event streams, such as financial services, e commerce, and telecommunications. These sectors depend on uninterrupted ingestion and processing to maintain customer experience and operational continuity. Data engineers in these environments prioritize tools that alert them to abnormalities before downstream systems encounter impacted data.
Machine learning based anomaly detection plays a central role in streaming observability solutions. Instead of relying solely on static rules, these technologies learn normal data behavior and alert teams when unexpected patterns emerge. This capability helps detect subtle issues such as drift or delayed messages that might otherwise remain unseen until business impact occurs. Automated learning improves detection accuracy over time.
Top Market Takeaways
- By deployment mode, cloud-based platforms account for 81.3% of the market, providing low-latency observability across distributed streaming architectures like Kafka and Flink.
- By application, real-time data pipeline health monitoring captures 46.8%, tracking latency, throughput, schema evolution, and data drift in continuous flows.
- By end-user industry, financial services and trading hold 52.4% share, demanding sub-second visibility for market data feeds, order execution, and risk calculations.
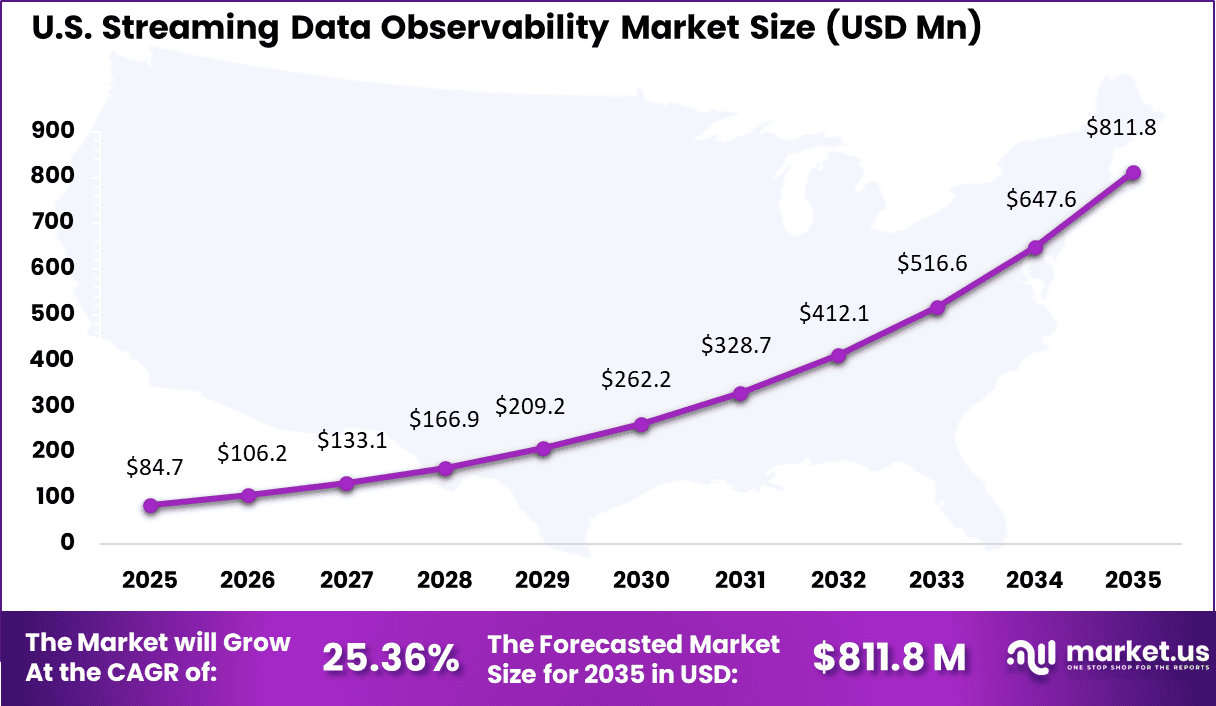
- By region, North America dominates with 48.2% of the global market, where the U.S. is valued at USD 84.7 million with a projected CAGR of 25.36%, fueled by HFT demands and cloud-native transformations.
- By 2026, around 50% of enterprises using distributed data architectures are expected to adopt data observability tools, up sharply from less than 20% in 2024.
Driver Impact Analysis
Key Driver Impact on CAGR Forecast (~%) Geographic Relevance Impact Timeline Rapid adoption of real-time streaming platforms in enterprises +6.4% North America, Europe Short to medium term Increasing dependence on event-driven and microservices architectures +5.6% Global Medium term Rising operational risk from undetected data pipeline failures +4.8% Global Short term Expansion of AI, fraud detection, and IoT streaming workloads +4.2% North America, Asia Pacific Medium term Growth in cloud-native data engineering practices +3.7% Global Medium to long term Restraints Impact Analysis
Key Restraint Impact on CAGR Forecast (~%) Geographic Relevance Impact Timeline Complexity of monitoring distributed streaming environments -4.3% Global Short to medium term Integration challenges across multi-cloud data stacks -3.6% North America, Europe Medium term Limited observability maturity among mid-sized enterprises -3.0% Asia Pacific, Latin America Medium term Alert fatigue and false-positive noise -2.6% Global Medium term Shortage of skilled data engineering and DevOps talent -2.2% Global Medium to long term By Deployment Mode
Cloud based deployment accounted for 81.3% of implementations. Streaming observability requires elastic processing because event volumes can spike unexpectedly during peak usage or market volatility. Cloud environments support real time ingestion, scalable monitoring, and rapid alerting without infrastructure bottlenecks. This improves operational stability for mission critical streaming systems.
Distributed streaming architectures often run across multiple services and regions. Cloud deployments allow telemetry, logs, and pipeline metrics to be consolidated into centralized monitoring layers. This reduces blind spots across event producers, brokers, and consumer applications. As a result, operational teams gain full pipeline visibility from ingestion to downstream analytics.
Security and governance requirements also support hosted deployment models. Centralized access control, audit logging, and encryption improve operational assurance. Organizations benefit from standardized monitoring across teams and environments. These factors continue to strengthen cloud adoption for streaming observability.
By Application
Real time data pipeline health monitoring represented 46.8% of usage. Organizations prioritize early detection of pipeline delays, dropped events, and consumer lag because these issues directly affect operational decisions. Observability tools continuously measure latency, throughput, and error rates across the streaming lifecycle. This prevents failures from remaining hidden until business reporting is affected.
Streaming pipelines often power customer facing services such as personalization, real time alerts, and transaction scoring. If the pipeline slows down, user experience and service reliability decline immediately. Health monitoring ensures problems are identified before they become large scale incidents. This improves uptime and protects service quality.
Operational efficiency is improved through automated alerting and root cause indicators. Instead of manually inspecting distributed logs, teams receive prioritized diagnostics. Incident response becomes faster and more consistent. The result is lower operational downtime and improved confidence in streaming analytics outputs.
By End User Industry
Financial services and trading accounted for 52.4% of adoption. These organizations rely on live market data, transaction flows, and pricing updates where milliseconds can affect outcomes. Streaming observability ensures event integrity and low latency delivery across trading and risk systems. Reliability becomes essential because delays may translate into financial exposure.
Fraud detection and real time compliance monitoring also depend on streaming pipelines. Transaction streams must be processed without gaps to prevent missed risk signals. Observability tools detect abnormal patterns such as sudden drops in event volume or unexpected schema changes. This supports continuous operational control and reduces financial risk.
High regulatory expectations further increase demand. Financial institutions must maintain traceable operational records and demonstrate control over data processing. Observability strengthens audit readiness by documenting pipeline performance and incident history. This supports both operational stability and governance requirements.
Investor Type Impact Matrix
Investor Type Growth Sensitivity Risk Exposure Geographic Focus Investment Outlook Data observability platform providers Very High Medium North America, Europe Strong SaaS scalability Cloud infrastructure and streaming vendors High Medium Global Embedded monitoring opportunity Enterprise analytics and AI vendors High Medium Global Integration-led expansion Private equity firms Medium Medium North America, Europe Consolidation of niche observability vendors Venture capital investors Very High High North America Innovation in streaming-native monitoring tools Technology Enablement Analysis
Technology Enabler Impact on CAGR Forecast (~%) Primary Function Geographic Relevance Adoption Timeline Real-time stream health and latency monitoring tools +6.8% Immediate pipeline visibility Global Short to medium term AI-driven anomaly and drift detection in streaming data +5.9% Predictive risk alerts North America, Europe Medium term Integration with event streaming platforms and message brokers +4.9% Continuous flow monitoring Global Medium term Automated root cause and dependency mapping engines +4.2% Faster remediation Global Medium to long term Unified observability dashboards across streaming ecosystems +3.5% Centralized monitoring Global Long term Key Challenges
- Difficulty in monitoring high volume, real time data streams without performance impact
- Integration challenges with multiple event streaming and messaging platforms
- High infrastructure cost to support continuous monitoring at scale
- Shortage of skilled professionals to manage stream level diagnostics
- Alert overload due to constant data flow and frequent anomalies
Emerging Trends
In the Streaming Data Observability market, a notable trend is the shift toward real-time visibility across continuous data flows rather than periodic sampling or batch checks. Organisations are implementing solutions that capture metrics, logs, and events as data moves through pipelines, enabling teams to detect delays, bottlenecks, or data loss the moment they occur.
This trend reflects a deeper recognition that streaming environments cannot be effectively managed with retrospective analysis alone, since issues can propagate quickly and undermine downstream analytics or operational systems. Another emerging pattern is the layering of contextual insights that tie observed anomalies to service dependencies, making it easier for both engineering and operational teams to diagnose issues in plain terms rather than through isolated alerts.
Growth Factors
A central growth driver in this market is the rapid adoption of real-time applications across industries, where timely data delivery influences customer experiences and decision quality. As businesses collect and process data from sensors, user interactions, and transaction feeds, confidence in continuous data health becomes critical to maintaining service reliability. Streaming data observability provides an early warning system that supports stable operations and improves cross-team collaboration when issues arise.
Another important driver is the desire to strengthen operational efficiency by reducing firefighting and manual investigation efforts. Without automated observability, engineering teams spend significant time tracing failures or reconstructing timelines; predictive and real-time insights help them focus on strategic improvements rather than repetitive troubleshooting, fostering both agility and resilience.
Key Market Segments
By Deployment Mode
- Cloud-based
- On-premises
By Application
- Real-time Data Pipeline Health Monitoring
- Stream Processing Job Performance
- End-to-End Latency and Lag Tracking
- Data Quality in Motion
- Others
By End-User Industry
- Financial Services and Trading
- Technology and Internet Services
- Telecommunications
- Media and Entertainment
- Others
Regional Analysis
North America represented 48.2% of adoption. The region has a high concentration of digital financial markets, cloud infrastructure maturity, and large scale data engineering adoption. Enterprises widely deploy real time analytics for customer experience, cybersecurity, and financial operations. These conditions increase the need for continuous streaming pipeline assurance.
The United States market is valued at USD 84.7 Mn and is expanding at a CAGR of 25.36%, reflecting rapid growth in streaming data infrastructure and cloud-native applications. Adoption is influenced by the need for continuous monitoring of high-velocity data streams used in fraud detection, trading systems, and personalized digital services. Growth is further supported by increasing integration of automated anomaly detection, real-time alerts, and centralized dashboards to enhance data reliability and operational decision-making.
Key Regions and Countries
- North America
- US
- Canada
- Europe
- Germany
- France
- The UK
- Spain
- Italy
- Russia
- Netherlands
- Rest of Europe
- Asia Pacific
- China
- Japan
- South Korea
- India
- Australia
- Singapore
- Thailand
- Vietnam
- Rest of APAC
- Latin America
- Brazil
- Mexico
- Rest of Latin America
- Middle East & Africa
- South Africa
- Saudi Arabia
- UAE
- Rest of MEA
Competitive Analysis
Observability and monitoring leaders such as Datadog, Splunk, and New Relic play a significant role in the streaming data observability market. Their platforms extend real-time monitoring to event-driven architectures and message queues. These solutions provide latency tracking, throughput analysis, and anomaly detection across streaming pipelines. Demand is driven by rising adoption of real-time analytics and microservices-based systems across enterprises.
Streaming platform and infrastructure providers such as Confluent, StreamNative, and Aiven integrate observability directly into data streaming environments. Lightbend, Decodable, Imply, Memphis.dev, and Timeplus focus on operational visibility and performance optimization. Adoption is strong among digital-native and fintech companies.
Cloud and enterprise technology providers such as IBM, Microsoft, Google, and Amazon Web Services embed streaming observability within managed cloud services. These platforms support scalable monitoring, automated alerting, and integration with DevOps workflows. Other vendors enhance innovation and regional presence, supporting continued growth in streaming data observability solutions globally.
Top Key Players in the Market
- Datadog
- Splunk
- New Relic
- Confluent
- IBM
- Microsoft
- Amazon Web Services
- Imply
- Decodable
- Lightbend
- StreamNative
- Aiven
- Memphis.dev
- Timeplus
- Others
Future Outlook
The future outlook for the Streaming Data Observability Market is positive as organizations increasingly rely on real-time data to drive business decisions and operations. Demand for streaming data observability solutions is expected to grow because these tools help monitor data flows, detect issues early, and ensure reliability.
Adoption of advanced analytics, automation, and integration with cloud platforms will support faster identification and resolution of data problems. Growth can be attributed to rising data volumes, focus on real-time insights, and the need to manage complex streaming environments. Overall, the market is expected to expand as businesses prioritize resilient and observable data streams.
Recent Developments
- September 2025 – Datadog’s Observability Pipelines added AI-assisted log parsing, GeoIP/ThreatIntel enrichment and OCSF conversion for Cloud SIEM, routing streaming logs from NGINX/Kafka to analytics with 80+ integrations.
- October 2025 – Splunk’s State of Observability 2025 report showed 86% of IT leaders prioritizing streaming investments, with observability driving revenue (53%) and innovation (48%) via real-time insights.
Report Scope
Report Features Description Market Value (2025) USD 194.2 Million Forecast Revenue (2035) USD 1,990 Million CAGR(2025-2035) 26.2% Base Year for Estimation 2024 Historic Period 2020-2024 Forecast Period 2025-2035 Report Coverage Revenue forecast, AI impact on Market trends, Share Insights, Company ranking, competitive landscape, Recent Developments, Market Dynamics and Emerging Trends Segments Covered By Deployment Mode (Cloud-based, On-premises), By Application (Real-time Data Pipeline Health Monitoring, Stream Processing Job Performance, End-to-End Latency and Lag Tracking, Data Quality in Motion, Others), By End-User Industry (Financial Services and Trading, Technology and Internet Services, Telecommunications, Media and Entertainment, Others) Regional Analysis North America – US, Canada; Europe – Germany, France, The UK, Spain, Italy, Russia, Netherlands, Rest of Europe; Asia Pacific – China, Japan, South Korea, India, New Zealand, Singapore, Thailand, Vietnam, Rest of Latin America; Latin America – Brazil, Mexico, Rest of Latin America; Middle East & Africa – South Africa, Saudi Arabia, UAE, Rest of MEA Competitive Landscape Datadog, Splunk, New Relic, Confluent, IBM, Microsoft, Google, Amazon Web Services, Imply, Decodable, Lightbend, StreamNative, Aiven, Memphis.dev, Timeplus, Others Customization Scope Customization for segments, region/country-level will be provided. Moreover, additional customization can be done based on the requirements. Purchase Options We have three license to opt for: Single User License, Multi-User License (Up to 5 Users), Corporate Use License (Unlimited User and Printable PDF)  Streaming Data Observability MarketPublished date: Feb. 2026add_shopping_cartBuy Now get_appDownload Sample
 -
-
- Datadog
- Splunk
- New Relic
- Confluent
- IBM
- Microsoft
- Amazon Web Services
- Imply
- Decodable
- Lightbend
- StreamNative
- Aiven
- Memphis.dev
- Timeplus
- Others
Our Clients
- 177829
- Feb. 2026


