


Report Overview
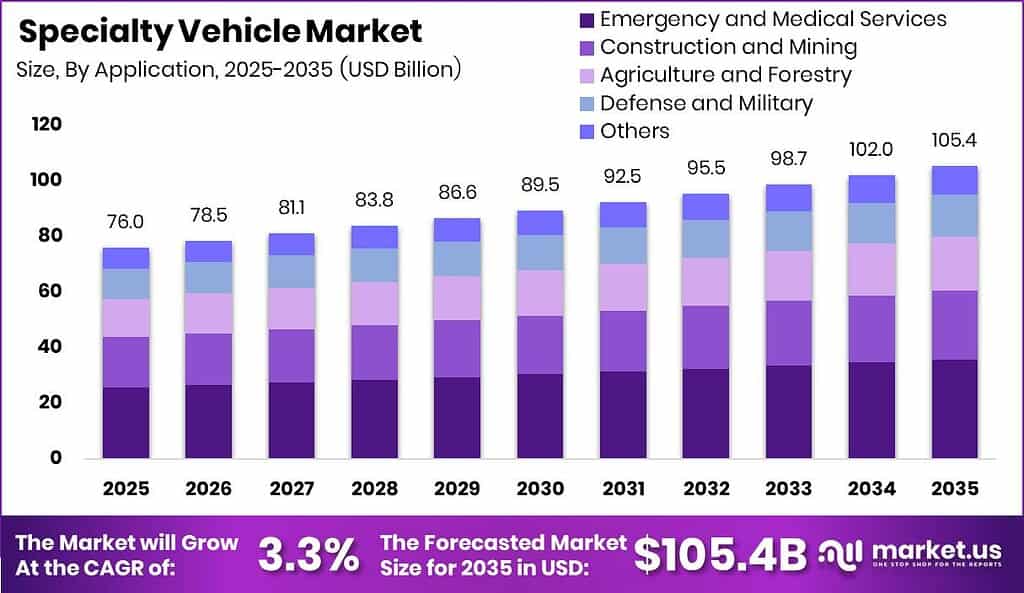
Global Specialty Vehicle Market size is expected to be worth around USD 105.4 Billion by 2035 from USD 76.0 Billion in 2025, growing at a CAGR of 3.3% during the forecast period 2026 to 2035. This trajectory reflects steady institutional procurement across emergency services, defense, agriculture, and construction worldwide.
The specialty vehicle market covers purpose-built vehicles engineered for functions beyond standard passenger or freight transport. This includes ambulances, fire trucks, armored carriers, recreational vehicles, electric specialty platforms, and off-highway work machines. Buyers span government agencies, military institutions, commercial operators, and industrial enterprises. Each vehicle category carries distinct performance requirements, procurement cycles, and regulatory frameworks, making this a structurally segmented and specification-driven market.
Key Takeaways
- Global Specialty Vehicle Market size reached USD 76.0 Billion in 2025.
- The market is forecast to reach USD 105.4 Billion by 2035, at a CAGR of 3.3%.
- By Vehicle Type, Ambulances dominate with a 32.30% share.
- By Application, Emergency and Medical Services leads with a 34.00% share.
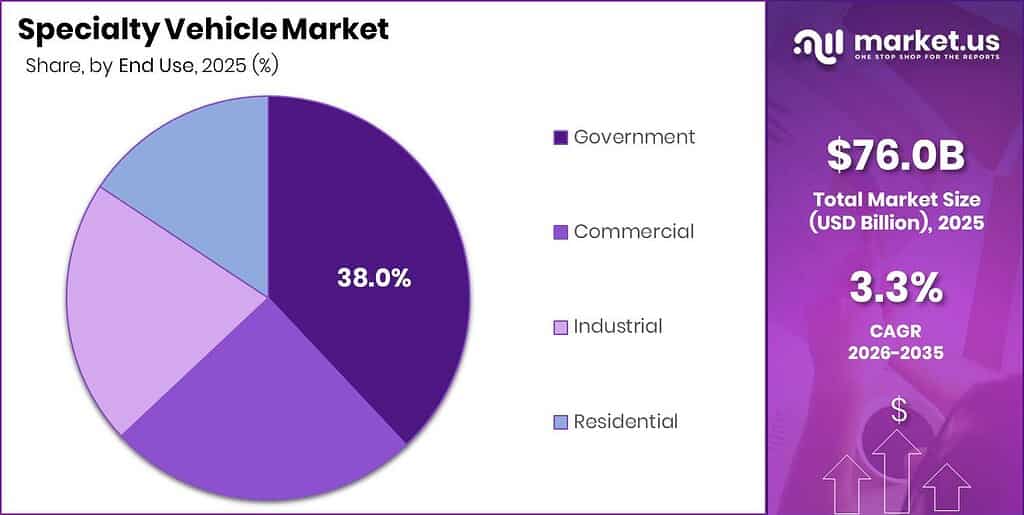
- By End Use, Government accounts for the largest share at 38.00%.
- By Propulsion Type, Internal Combustion Engine (ICE) holds a dominant 88.00% share.
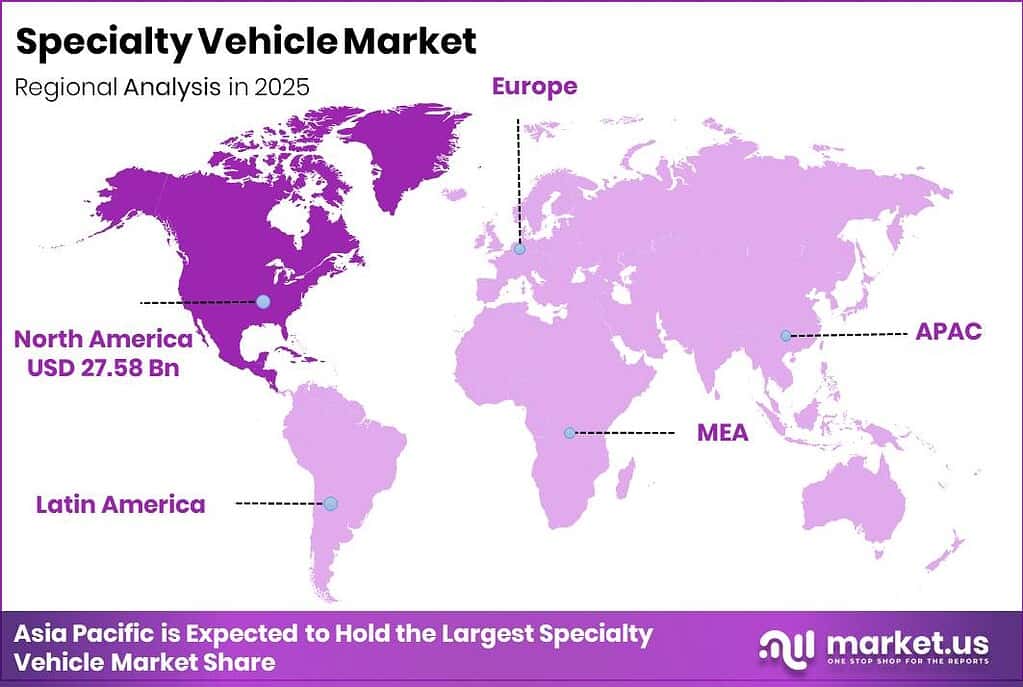
- North America leads all regions with a 36.30% share, valued at USD 27.58 Billion.
Government buyers drive the largest share of procurement in this market. Municipal fire departments, public health agencies, and defense ministries issue multi-year fleet replacement programs that create predictable, contract-backed revenue for manufacturers. As per our research, annual vehicle acquisition budgets at a single mid-sized fire department can reach nearly USD 1.7 Million, and those figures scale significantly across state and national procurement programs. This purchasing pattern favors established OEMs with cooperative purchasing agreements and indexed pricing contracts.
Infrastructure investment programs in the United States, European Union cohesion states, and India continue to release capital equipment budgets tied to construction and emergency-response mandates. These disbursements directly expand addressable demand for specialty vehicles in construction, mining, and public safety applications. However, elevated municipal borrowing costs since 2022 have compressed appropriation envelopes, pushing some buyers toward lower-specification orders and extended replacement cycles rather than full fleet upgrades.
Vehicle Type Analysis
Ambulances dominate with 32.30% due to mandatory EMS fleet replacement cycles.
In 2025, Ambulances held a dominant market position in the By Vehicle Type segment of the Specialty Vehicle Market, with a 32.30% share. Hawaii Fire Department planning documents estimate a new ambulance unit at USD 350,000, with factory lead times running one to two years from order to delivery. This extended procurement cycle forces departments to plan acquisitions years ahead, locking in manufacturer order books. Operators who secure long-lead chassis allocations early hold a structural advantage in fulfilling these non-discretionary replacement mandates.
Fire Trucks represent the second-largest vehicle type, driven by non-negotiable frontline deployment standards. A 2025 fire apparatus configuration featured a 500-hp Cummins X12 engine, a 1,500-gpm Hale Qmax pump, and a 1,030-gallon water tank, demonstrating the high-power specification demands typical of this category. A separate 2025 Smeal Type 1 pumper included a 1,750-gpm pump and 143 cubic feet of compartment volume. These specifications signal that fire apparatus procurement is driven by performance mandates, not cost optimization, which supports premium pricing and strong unit economics for specialized builders.
Armored Vehicles serve defense and law enforcement buyers operating under classified procurement frameworks and strategic fleet modernization programs. NATO member states and Gulf region defense ministries continue to allocate capital to armored fleet upgrades, creating demand streams that are largely insulated from civilian budget cycles. This insulation makes armored vehicle contracts attractive for manufacturers seeking revenue stability against the volatility of commercial and municipal procurement.
Recreational Vehicles, Electric Specialty Vehicles, and other specialty platforms collectively account for the remaining share. Electric Specialty Vehicles are gaining traction as fleet operators face urban low-emission zone enforcement. Volvo Trucks’ 2025 electric refuse-truck lineup offers battery packs from 280 to 565 kWh across three to six batteries, with the FL Electric rated at up to 450 km of range. In November 2025, Workhorse expanded its W56 electric step-van platform by integrating the Utilimaster Aeromaster aluminum walk-in body, adding a standardized configuration for conventional fleet operators. In March 2026, Workhorse launched a 140 kWh version of its W56 at a starting price of USD 169,000, targeting in-city and last-mile delivery applications. The Mack LR Electric offers a 264-kWh battery with a 70-mile operating range per charge, suited to urban refuse collection routes.
Application Analysis
Emergency and Medical Services dominates with 34.00% due to non-discretionary government EMS mandates.
In 2025, Emergency and Medical Services held a dominant market position in the By Application segment of the Specialty Vehicle Market, with a 34.00% share. Birmingham Fire and Rescue Service responded to 52,732 EMS calls in 2025, illustrating the intensive annual utilization that drives continuous vehicle replacement demand. Maryland’s Office of the State Fire Marshal reports that operational fleet vehicles accumulate an average of 20,000 miles per year. This utilization rate accelerates vehicle retirement timelines, converting fleet maintenance obligations into recurring procurement events for specialty manufacturers.
Construction and Mining applications represent the second-largest demand pool, anchored by infrastructure project timelines and heavy-site operational requirements. The Off-Highway Vehicle segment within this application category depends directly on active project pipelines across road, rail, dam, and extraction sites. National statistical office data from major construction economies including India, China, and the United States show sustained capital project disbursements that extend multi-year demand for site-specific specialty platforms. Buyers in this segment prioritize payload capacity, terrain adaptability, and total cost of ownership over unit acquisition price.
Agriculture and Forestry applications drive demand for purpose-built vehicles suited to seasonal field operations and remote terrain. FAO agricultural output data confirms that mechanization intensity correlates directly with farm-scale economics, and mid-to-large operations in North America, Europe, and East Asia represent the core buyers for agricultural specialty vehicles. Defense and Military applications add a strategically insulated procurement layer, driven by classified fleet replacement schedules and tactical modernization programs. Others, including airport rescue and firefighting platforms and utility maintenance vehicles, collectively round out the application mix.
End Use Analysis
Government dominates with 38.00% due to mandated public safety fleet procurement budgets.
In 2025, Government held a dominant market position in the By End Use segment of the Specialty Vehicle Market, with a 38.00% share. Government buyers operate under statutory fleet replacement obligations tied to NFPA standards, EMS response mandates, and national defense directives. The American Welding Society workforce data shows that specialty vehicle assembly absorbs 300 to 600 direct labor hours per custom unit, indicating the production complexity that justifies government buyers accepting lead times of one to two years. Procurement frameworks using cooperative purchasing vehicles compress bid cycles by 4 to 6 months, giving compliant OEMs a structural order intake advantage.
Commercial end users represent the second-largest buyer group, covering logistics operators, waste management companies, construction contractors, and private emergency service providers. ITU global digitalization indicators confirm that commercial fleet operators in developed markets are accelerating telematics adoption to reduce fuel, maintenance, and accident costs, creating a hardware and software upgrade cycle inside the specialty vehicle aftermarket. This dual demand for both new platforms and connected fleet management systems expands the commercial revenue opportunity beyond the initial vehicle sale.
Industrial buyers acquire specialty vehicles for manufacturing plant operations, energy site maintenance, and hazardous material handling. Residential buyers, though the smallest segment, participate through the recreational vehicle sub-category, where consumer credit conditions directly influence purchase timing. Consumer credit contraction in North America and Northern Europe has compressed leisure-segment order volumes, making the residential share more cyclically sensitive than the institutional end-use categories above it.
Propulsion Type Analysis
Internal Combustion Engine (ICE) dominates with 88.00% due to proven heavy-duty range and payload performance.
In 2025, Internal Combustion Engine (ICE) held a dominant market position in the By Propulsion Type segment of the Specialty Vehicle Market, with an 88.00% share. Diesel and alternative-fuel ICE platforms remain the procurement default for emergency, defense, and off-highway applications where uninterrupted operational range and peak torque under load are non-negotiable. Bureau of Labor Statistics producer price indices for truck and bus bodies confirm that ICE chassis remain the reference specification across most municipal and commercial buying frameworks, with alternatives evaluated against this benchmark rather than independently.
Electric and Hybrid propulsion holds the remaining 12% share, concentrated in urban refuse collection, airport ground support, and last-mile delivery platforms where predictable routes and depot charging are operationally feasible. The Volvo FL Electric’s 450-km rated range and the Mack LR Electric’s 70-mile per-charge capacity reflect the current practical ceiling for heavy-duty electric specialty applications. EU and UK urban low-emission zone enforcement policies are accelerating fleet transition mandates for municipal operators, meaning the electric share is structurally positioned to grow as charging infrastructure investment catches up with fleet conversion timelines.
Key Market Segments
By Vehicle Type
- Ambulances
- Fire Trucks
- Armored Vehicles
- Recreational Vehicles
- Electric Specialty Vehicles
- Others
By Application
- Emergency and Medical Services
- Construction and Mining
- Agriculture and Forestry
- Defense and Military
- Others
By End Use
- Government
- Commercial
- Industrial
- Residential
By Propulsion Type
- Internal Combustion Engine (ICE)
- Electric and Hybrid
Regional Analysis
North America Dominates the Specialty Vehicle Market with a Market Share of 36.30%, Valued at USD 27.58 Billion
North America leads all regions in the specialty vehicle market, driven by deep institutional procurement pipelines across municipal fire and EMS fleets, federal defense contracts, and infrastructure program disbursements. The United States Fire Administration registry data shows a substantial share of career departments operating apparatus older than 20 years, converting deferred replacement into active, non-discretionary procurement. In March 2026, Workhorse received a purchase order for 100 fully electric step vans from Purolator, with deliveries scheduled throughout 2026, signaling that commercial electric specialty platform adoption is accelerating in the region alongside traditional government fleet renewal.
Asia Pacific represents the fastest-growing regional market, propelled by public safety infrastructure investment in China, India, and Southeast Asia, alongside rapid construction and mining sector expansion. Government appropriations for emergency response modernization in tier-1 and tier-2 cities are generating multi-year procurement programs for ambulances, fire apparatus, and off-highway construction vehicles. Military Vehicle fleet modernization across East Asian defense establishments adds a strategically insulated procurement layer that is largely decoupled from civilian budget cycles.
Europe maintains steady demand through urban low-emission zone enforcement mandates that require fleet operators to replace non-compliant diesel platforms on defined timelines. Latin America and the Middle East and Africa regions collectively represent a smaller but structurally important share, with Gulf state airport expansion programs and mega-project fleets creating concentrated procurement events for airport rescue, firefighting, and heavy construction specialty vehicles. Fragmented aftermarket parts networks remain a persistent operational challenge across Latin America and Sub-Saharan Africa, increasing total cost of ownership and slowing fleet expansion among budget-constrained buyers.
Key Regions and Countries
North America
- US
- Canada
Europe
- Germany
- France
- The UK
- Spain
- Italy
- Rest of Europe
Asia Pacific
- China
- Japan
- South Korea
- India
- Australia
- Rest of APAC
Latin America
- Brazil
- Mexico
- Rest of Latin America
Middle East and Africa
- GCC
- South Africa
- Rest of MEA
Market Dynamics
Market Opportunity Analysis - Underserved electric applications and subscription procurement models create first-mover revenue advantages.
The Electric Specialty Vehicles sub-segment holds only a 12% propulsion share despite active EU and UK urban low-emission zone mandates. Depot charging grid constraints and battery duty-cycle validation gaps slow full conversion, but operators in urban refuse collection and last-mile delivery face regulatory timelines that make the transition non-optional. New entrants who pre-position charging infrastructure partnerships and validated duty-cycle data before incumbents do will capture fleet conversion contracts that lock in multi-year maintenance and parts revenue alongside the initial vehicle sale.
The Residential end-use segment, anchored by recreational vehicles, remains the most credit-sensitive buyer group in this market. Consumer credit contraction in North America and Northern Europe has suppressed order volumes, creating a window for manufacturers to offer lease and installment structures that convert deferred purchases into near-term sales. By contrast, operators who enter this segment with financing products rather than direct purchase options will access buyers who are willing to commit but unable to pay full acquisition price, expanding addressable demand without requiring price concessions.
Latin America, Sub-Saharan Africa, and Southeast Asia represent the certified refurbishment export opportunity identified in the Opportunities analysis. Specialty vehicle buyers in these regions face both high new-unit acquisition costs and fragmented aftermarket parts networks that raise total cost of ownership. Consequently, a certified refurbishment channel targeting these markets, backed by standardized inspection protocols and parts guarantees, can capture demand that new-unit pricing currently prices out, while generating aftermarket parts and service revenue streams that outlast the initial sale.
The Construction and Mining application segment in Asia Pacific benefits from sustained government infrastructure disbursements across India, China, and Southeast Asian economies. This segment remains underexploited by Western specialty vehicle OEMs relative to its size, as local procurement preferences and import duties favor domestically assembled platforms. OEMs that establish local assembly or joint-venture partnerships in India or Southeast Asia position themselves to access government-tendered construction fleet contracts that are currently captured almost entirely by regional manufacturers.
Technology and Innovation Landscape - Connected fleet management and electric powertrain advances are redefining operational economics across specialty vehicle categories.
According to a 2026 Fleetio industry guide, 72% of fleets now use maintenance software, indicating that digital maintenance management has crossed from early adoption into standard operational practice for specialty vehicle fleets. This penetration rate signals that fleet operators expect real-time maintenance visibility as a baseline procurement requirement, not a premium feature. Manufacturers and upfitters that embed telematics-ready architecture into their base vehicle configurations gain a structural advantage in competitive tenders where total cost of ownership analysis is now standard.
Verizon Connect’s 2026 GPS fleet-tracking results show average reductions of 19% in accident costs, 15% in maintenance costs, and 12% in fuel costs among connected specialty-vehicle fleet users. These savings translate directly into lower total cost of ownership for fleet operators and create a quantifiable return on investment case for telematics hardware specification at the point of purchase. As per our research, operators who present duty-cycle-validated cost reduction data during procurement negotiations consistently outperform those competing on unit acquisition price alone.
AI video-telematics is advancing from data collection to active safety intervention in specialty vehicle operations. Data from Verizon Connect’s 2026 survey shows 74% of AI video-telematics users reported improved driver safety outcomes, and 41% rated the technology as extremely or very beneficial for driver coaching. For emergency and defense vehicle operators where driver error carries both mission and liability consequences, this performance data creates a compliance and risk-management case that accelerates hardware adoption beyond cost-savings motivation alone.
Electric powertrain innovation is pushing practical range boundaries for heavy-duty specialty platforms. Volvo Trucks’ 2025 electric refuse lineup offers battery configurations from 280 to 565 kWh across three to six battery units, a range width that allows fleet operators to match energy capacity to specific route profiles rather than defaulting to the highest-cost configuration. This modular battery architecture reduces the capital premium of electrification for operators with predictable sub-450 km daily routes, accelerating the business case for fleet conversion ahead of regulatory deadlines.
Drivers
Frontline pumper and aerial fleets in mature markets have drifted well past the 15-year frontline service guidance in NFPA apparatus standards. U.S. Fire Administration registry data shows a substantial share of career departments operating primary units older than 20 years. This converts deferred replacement into non-discretionary procurement regardless of interest rate conditions. Manufacturer SEC disclosures show fire and emergency backlogs quadrupled between 2019 and 2024, with delivery windows widening from 12 to 18 months to 24 to 48 months, and individual component wait times reported above 400 days.
OEMs have shifted from fixed-price build-to-order transactions to indexed agreements carrying material escalator clauses tied to Bureau of Labor Statistics producer price indices. Chassis-stage progress deposits now run roughly 10% to 30%, and cooperative purchasing vehicles compress bid cycles by 4 to 6 months. This contract architecture functions like a shift from one-time sales to contracted recurring revenue. Gross margin recovery of roughly 200 to 300 basis points at listed apparatus builders confirms that indexed multi-year backlogs improve financial stability, though they simultaneously concentrate cancellation exposure and invite procurement-fairness scrutiny from municipal buyers.
| Driver | (~) % Impact on CAGR Forecast | Geographic Relevance | Impact Timeline |
|---|---|---|---|
| Aging Municipal Apparatus Replacement Cycles | +0.9% | North America, Western Europe, Japan | Short term (2 years or less) |
| Public Safety & EMS Appropriation Growth | +0.7% | Global, concentrated in North America and Asia-Pacific | Medium term (2 to 4 years) |
| Infrastructure Program Disbursement Flows | +0.6% | United States, EU cohesion states, India | Short term (2 years or less) |
| Defense & Tactical Fleet Modernization | +0.5% | NATO members, Gulf states, East Asia | Medium term (2 to 4 years) |
| Urban Low-Emission Zone Enforcement | +0.4% | EU and UK metropolitan areas, Chinese tier-1 cities | Medium term (2 to 4 years) |
| Disaster Response Fleet Provisioning | +0.3% | North America, Mediterranean Europe, Australia | Short term (2 years or less) |
Restraints
Specialty vehicle demand is overwhelmingly debt-financed at the subnational level. Federal Reserve H.15 series and comparable ECB reference rates left tax-exempt general obligation yields several hundred basis points above the pre-tightening decade average. IMF Fiscal Monitor analysis shows interest absorbing a rising share of own-source revenue at subnational levels, mechanically shrinking the appropriation envelope for capital equipment. Because purpose-built aerial or refuse units are typically amortized over 10 to 20 years, each 100 basis point increase in the borrowing curve raises lifecycle financing cost by a mid-single-digit percentage of acquisition value.
World Bank lending rate indices indicate emerging-market municipalities face materially wider spreads, pushing referendum-dependent buyers to defer awards by 6 to 9 months or reduce specification content. Order intake mix consequently drifts toward stripped, lower-content configurations carrying below-average contribution margin, compressing blended gross margin by an estimated 150 to 250 basis points. OEMs facing the same cost of capital delay body-plant and paint-line capital expenditure, per investor disclosures from listed manufacturers, which preserves the capacity shortfall that keeps lead times extended and reinforces the procurement delays buyers are trying to avoid.
| Restraint | (~) % Impact on CAGR Forecast | Geographic Relevance | Impact Timeline |
|---|---|---|---|
| Elevated Municipal Borrowing Costs | -0.8% | Global, acute in emerging-market municipalities | Short term (2 years or less) |
| Section 232 Metals Tariff Escalation | -0.7% | United States imports, Canada and Mexico supply chains | Short term (2 years or less) |
| Lapse of Federal Zero-Emission Purchase Grants | -0.5% | United States | Short term (2 years or less) |
| Consumer Credit Contraction in Leisure Segments | -0.4% | North America, Northern Europe | Short term (2 years or less) |
| Export Licensing Limits on Power Electronics | -0.4% | Global, bilateral United States and China exposure | Medium term (2 to 4 years) |
| Withdrawal of Non-Compliant Diesel Platforms | -0.3% | United States, EU, UK | Medium term (2 to 4 years) |
Challenges
Specialty vehicle assembly remains a low-volume, high-touch craft process. A single custom pumper body or vacuum tanker can absorb 300 to 600 direct labor hours. Bureau of Labor Statistics occupational projections show roughly 40,000 annual openings for welders, cutters, and brazers against a shrinking entrant pipeline. The American Welding Society has flagged a cumulative workforce shortfall approaching 360,000 positions by the late 2020s, and Cedefop skills-shortage indicators register comparable scarcity across German, Italian, and Nordic metal fabrication sectors.
This talent deficit surfaces as throughput loss rather than lost orders. Overtime and shift premiums run 15% to 25%, and takt-time slippage adds 4 to 10 weeks to a build slot even when chassis and drivetrain are on hand. Robotic and cobot welding cells can shift 20% to 35% of seam length to automation, and registered apprenticeship pipelines coordinated with state workforce agencies under Department of Labor frameworks offer a longer-term structural fix. Both solutions carry payback periods of 3 to 5 years, keeping the drag active through most of the current planning cycle and limiting how quickly multi-year backlogs convert into recognized revenue.
| Challenge | (~) % CAGR Friction Drag | Geographic Relevance | Mitigation Horizon |
|---|---|---|---|
| Skilled Welder Talent Deficit | -0.5% | North America, Western Europe, Japan | Long term (4 years or more) |
| Custom Chassis Allocation Bottlenecks | -0.4% | Global | Medium term (2 to 4 years) |
| Battery Duty-Cycle Validation Gaps | -0.4% | North America, EU, China | Long term (4 years or more) |
| Depot Charging Grid Constraints | -0.3% | Urban North America, EU, Gulf states | Long term (4 years or more) |
| Fragmented Aftermarket Parts Networks | -0.3% | Global, worst in Latin America and Africa | Medium term (2 to 4 years) |
| Connected Vehicle Cyber Compliance | -0.2% | EU, UK, Japan, Korea | Medium term (2 to 4 years) |
Opportunities
Municipal and utility procurement statutes were written around capital appropriation of titled assets. Census Bureau state and local government finance data show specialty equipment acquisition still routed almost entirely through capital outlay lines. GASB 87 recognition rules and European Investment Bank municipal lending frameworks have only recently given treasurers a defensible basis for structuring availability-based, per-operating-hour contracts. This creates an addressable pool of subscription-ready fleets that no incumbent has systematically converted, representing white space for the first operator to build a credible Fleet-as-a-Service offering.
A bundled contract combining financing, scheduled maintenance, parts, telematics-based utilization management, and residual value capture supports blended margins in the 25% to 32% range. This compares favorably with low-double-digit product gross margins on transactional chassis-and-body sales. Revenue per asset over a 7 to 10 year contract term rises by a multiple of the initial invoice, and contracted recurring cash flow carries a structurally lower cost of capital. The first mover to build captive financing capacity, residual value underwriting, and sufficient service network density can target a 300 to 600 basis point expansion in enterprise-level operating margin.
| Opportunity | (~) % Potential CAGR Upside | Geographic Relevance | Execution Window |
|---|---|---|---|
| Fleet-as-a-Service Subscription Models | +0.9% | North America, EU, Gulf states | Medium term (2 to 4 years) |
| Electric Repower and Retrofit Aftermarket | +0.7% | EU, United States, China | Medium term (2 to 4 years) |
| Roll-Up of Independent Body Builders | +0.6% | North America, Southern Europe | Short term (2 years or less) |
| Airport ARFF and Mega-Project Fleets | +0.5% | Gulf states, Southeast Asia, India | Medium term (2 to 4 years) |
| Autonomous Off-Highway Work Platforms | +0.4% | Australia, Chile, Canada, China | Long term (4 years or more) |
| Certified Refurbishment Export Channel | +0.3% | Latin America, Sub-Saharan Africa, Southeast Asia | Long term (4 years or more) |
Key Company Insights
Robert Bosch GmbH positions itself as a tier-1 systems integrator across powertrain electronics, braking, and driver-assistance modules deployed in specialty vehicle platforms globally. Bosch’s deep integration into both ICE and electric drivetrain architectures gives it a supply-chain position that is difficult for chassis OEMs to displace without multi-year retooling cost. This cross-platform dependency creates structural pricing power, though it also exposes Bosch to export licensing restrictions on power electronics that regulators have targeted in bilateral US-China trade frameworks.
Denso Corporation holds a concentrated position in thermal management and electrification components that are increasingly specified in hybrid and electric specialty vehicle builds. Denso’s annual reports confirm sustained capital allocation toward electric powertrain and sensor technology, aligning its product roadmap with fleet electrification mandates across EU and East Asian markets. Following the completion of Workhorse’s merger with Motiv Electric Trucks in December 2025, the combined entity’s transition toward the W56 platform and its 200-plus contracted vehicles reflects the scale at which component suppliers like Denso must prepare production capacity to serve dedicated electric specialty fleets.
Key Players
- Robert Bosch GmbH
- Denso Corporation
- Aisin Corporation
- Continental AG
- BorgWarner Inc.
- Delphi Technologies
- Johnson Electric Holdings Limited
- Magna International Inc.
- Rheinmetall AG (Pierburg)
- ZF Friedrichshafen AG
- Valeo SA
- Hitachi Astemo, Ltd.
- Hella GmbH & Co. KGaA
- Schaeffler AG
- SHW AG
Recent Developments
- November 2025: REV Group invested USD 2.6 Million to expand Horton Emergency Vehicles’ manufacturing footprint in Grove City, Ohio, purchasing an adjacent 20,000-square-foot facility for final assembly and vehicle delivery operations, with the facility planned to become operational in early 2026.
- April 2026: Workhorse secured a 100-unit order for W56 electric step vans from Gateway Fleets, with deployment planned across Gateway’s electrified commercial-delivery sites beginning in July 2026.
- April 2026: Workhorse introduced a temporary price reduction of up to USD 61,000 on its W56 electric step vans, reducing the starting price of the 210 kWh extended-wheelbase model to USD 204,000 through September 2026.
- May 2026: Winnebago launched the ARKA all-season off-grid adventure truck, a new purpose-built vehicle in its Backcountry Series that underwent OEM-level durability testing simulating more than 100,000 miles of road and trail use.
Geopolitical Impact Analysis
According to WTO trade policy monitoring data, Section 232 steel and aluminum tariffs applied by the United States have pushed specialty vehicle chassis and body material costs materially higher for domestic assemblers relying on imported steel content. Tariff escalation carries an estimated -0.7% CAGR impact on the market. As reported by UNCTAD trade and development analysis, supply chain rerouting in response to bilateral US-China export licensing restrictions on power electronics adds procurement lead time and cost friction specifically for electric and hybrid specialty vehicle platforms, where inverters and battery management systems carry the highest restriction exposure.
Data from a 2026 chemical-logistics industry survey shows 46% of respondents planned to use new trade routes during 2026, reflecting how geopolitical route disruption has moved from contingency planning into active operational strategy across industrial supply chains that specialty vehicle manufacturers share. World Bank lending rate indices confirm that emerging-market municipalities face spreads materially wider than mature-market peers, a direct consequence of global monetary tightening that geopolitical risk premia have amplified further in frontier markets. This dynamic defers procurement awards by 6 to 9 months in markets where specialty vehicle demand growth would otherwise be strongest, concentrating near-term order intake in North America and Western Europe.
Report Scope
| Report Features | Description |
|---|---|
| Market Value (2025) | USD 76.0 Billion |
| Forecast Revenue (2035) | USD 105.4 Billion |
| CAGR (2026-2035) | 3.3% |
| Base Year for Estimation | 2025 |
| Historic Period | 2020-2024 |
| Forecast Period | 2026-2035 |
| Report Coverage | Revenue Forecast, Market Dynamics, Market Opportunity Analysis, Technology and Innovation Landscape, Competitive Landscape, Recent Developments |
| Segments Covered | By Vehicle Type (Ambulances, Fire Trucks, Armored Vehicles, Recreational Vehicles, Electric Specialty Vehicles, Others), By Application (Emergency and Medical Services, Construction and Mining, Agriculture and Forestry, Defense and Military, Others), By End Use (Government, Commercial, Industrial, Residential), By Propulsion Type (Internal Combustion Engine (ICE), Electric and Hybrid) |
| Regional Analysis | North America (US and Canada), Europe (Germany, France, The UK, Spain, Italy, and Rest of Europe), Asia Pacific (China, Japan, South Korea, India, Australia, and Rest of APAC), Latin America (Brazil, Mexico, and Rest of Latin America), Middle East and Africa (GCC, South Africa, and Rest of MEA) |
| Competitive Landscape | Robert Bosch GmbH, Denso Corporation, Aisin Corporation, Continental AG, BorgWarner Inc., Delphi Technologies, Johnson Electric Holdings Limited, Magna International Inc., Rheinmetall AG (Pierburg), ZF Friedrichshafen AG, Valeo SA, Hitachi Astemo Ltd., Hella GmbH & Co. KGaA, Schaeffler AG, SHW AG |
| Customization Scope | Customization for segments, region / country-level will be provided. Additional customization can be done based on requirements. |
| Purchase Options | We have three licenses to opt for: Single User License | Multi-User License (Up to 5 Users) | Corporate Use License (Unlimited User and Printable PDF) |





































