


Report Overview
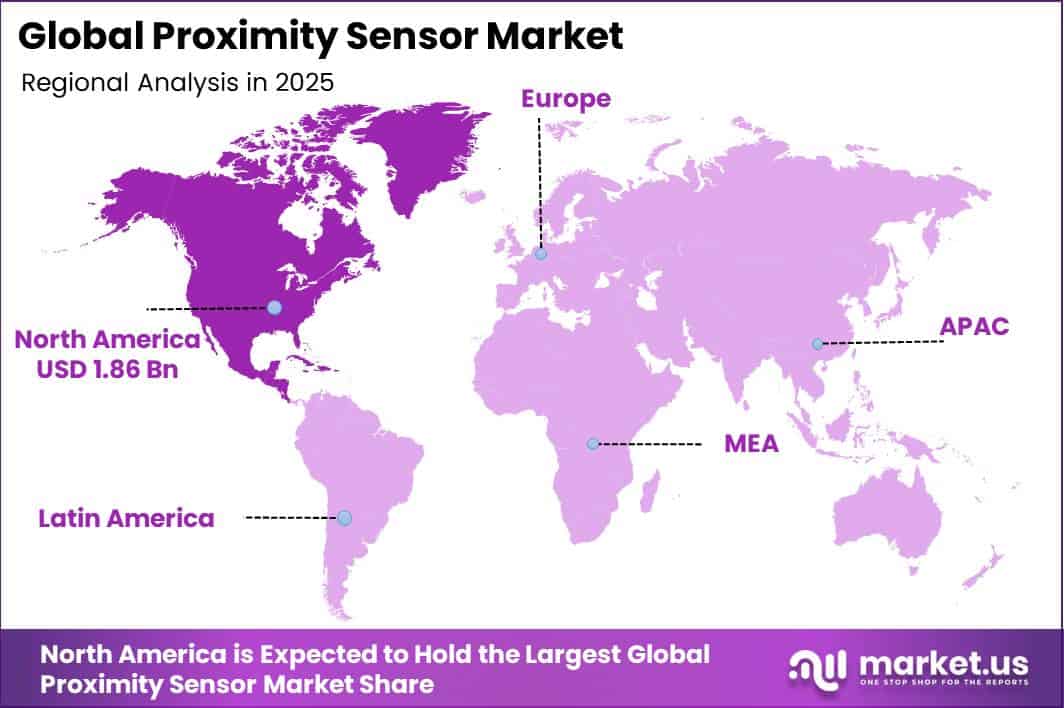
In 2025, the Global Proximity Sensor Market was valued at USD 5.2 billion. The market is projected to grow at a CAGR of 7.2% during 2026–2035, reaching approximately USD 10.4 billion by 2035. North America dominated the global market in 2025, accounting for more than 35.8% of the total market share and generating approximately USD 1.8 billion in revenue.
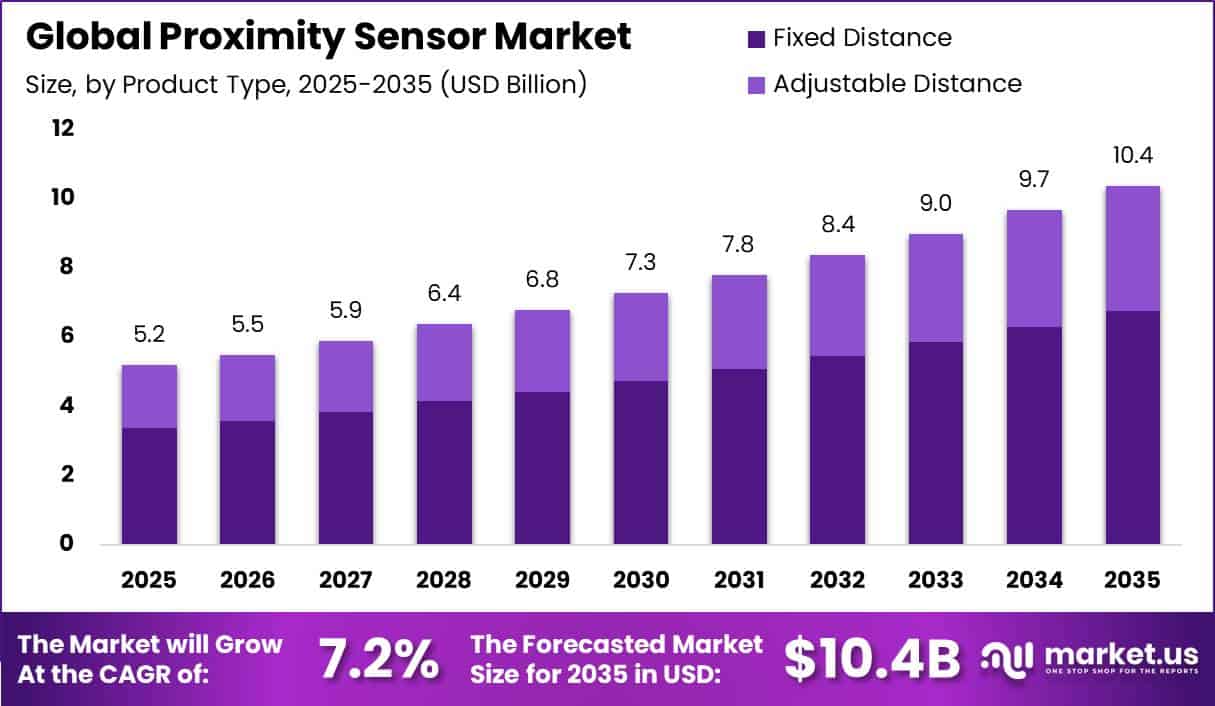
Market growth is being supported by the rapid use of factory automation, where proximity sensors help detect the position, presence, and movement of objects without physical contact. According to the International Federation of Robotics, 542,076 industrial robots were installed worldwide in 2024, while the global operational robot stock reached 4.6 million units, increasing 9% year over year.
Electronics accounted for 24% of global robot installations, followed by automotive at 23%, highlighting strong sensor demand from major automated industries. Proximity sensors are widely used across robotic cells, conveyors, packaging equipment, assembly lines, safety systems, and material-handling operations.
The United States produced approximately 10.2 million vehicles in 2025, supporting sensor demand across automotive manufacturing and vehicle applications. In addition, U.S. construction spending reached an annual rate of USD 2.1 trillion in June 2025, including USD 738.8 billion in private non-residential construction.
Key Takeaway
- The Proximity Sensor Market was valued at USD 5.2 billion in 2025 and is projected to reach USD 10.4 billion by 2035 at a 7.2% CAGR.
- The fixed-distance segment was dominated by product type, with a 65.1% share in 2025.
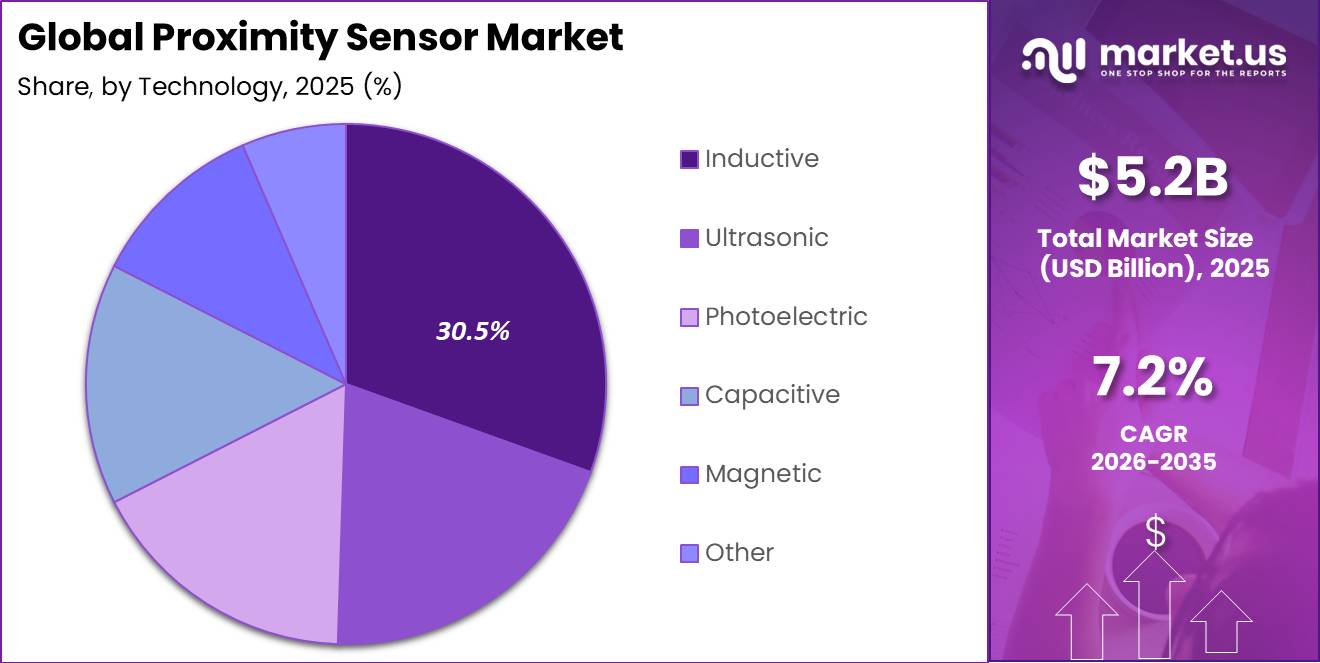
- Inductive sensors led by technology, with a 30.5% share in 2025.
- Automotive was the leading end-use industry with a 28.4% share in 2025.
- North America led the market in 2025 with a 35.8% share, worth approximately USD 1.8 billion.
By Product Type
In 2025, the Fixed-Distance segment held a dominant position in the proximity sensor market, accounting for a 65.1% share. These sensors are commonly used in conveyors, packaging lines, pick-and-place systems, machine guards, and semiconductor equipment, where accurate positioning and fast operation are important.
PMMI reported that U.S. packaging machinery shipments reached USD 10.9 billion in 2023, increasing 5.8%, with further market growth expected through 2027. New filling, labeling, inspection, conveying, and palletizing machines require multiple sensing points for product detection, counting, equipment control, and jam prevention.
SEMI projected global semiconductor manufacturing equipment sales of USD 125.5 billion for 2025, including USD 110.8 billion from wafer-fab equipment. These controlled production environments depend on reliable non-contact sensing at defined distances.
By Technology
In 2025, the Inductive segment held a dominant position in the proximity sensor market, capturing a 30.5% share. Its strong market position comes from its ability to detect metal objects accurately without physical contact, even in demanding industrial environments.
The World Steel Association reported that global crude-steel production reached 1.8 billion tonnes in 2024, showing the large scale of metal-processing activities that require accurate sensing and position control. In these operations, inductive sensors are used to detect workpieces, confirm strip position, monitor tool movement, and reduce the risk of machine collisions.
By End-Use Industry
In 2025, the Automotive segment held a dominant position in the proximity sensor market, capturing a 28.4% share. Its leadership is supported by the wide use of proximity sensors in both vehicle manufacturing and vehicle functions.
According to OICA, global motor vehicle production reached 91.8 million units in 2024, creating strong demand for sensors across stamping, body welding, powertrain assembly, paint shops, and final inspection lines.
Inductive and photoelectric proximity sensors help detect metal parts, monitor body-panel movement, control robotic equipment, and reduce the risk of machine collisions. Vehicle electrification is adding further demand. The International Energy Agency reported that 17.3 million electric cars were produced worldwide in 2024, around 25% more than in 2023.
Key Market Segments
By Product Type
- Fixed Distance
- Adjustable Distance
By Technology
- Inductive
- Ultrasonic
- Photoelectric
- Capacitive
- Magnetic
- Other
By End-Use Industry
- Automotive
- Aerospace and Defense
- Consumer Electronics
- Food and Beverages
- Other
Geopolitical Impact Analysis
Geopolitical tensions are increasing both the cost and delivery time of proximity sensors because the industry depends on global supplies of semiconductor chips, copper conductors, printed circuit boards, metal housings, and industrial electronic components. Red Sea security problems have pushed many Asia–Europe shipping routes away from the Suez Canal and around the Cape of Good Hope.
UNCTAD reported that Suez Canal tonnage in early May 2025 remained around 70% below its 2023 average. At the same time, the Shanghai Containerized Freight Index averaged 2,496 points in 2024, around 149% above 2023 levels. For a median-sized container vessel, an Asia–Europe round trip through the Cape costs about USD 1.7 million, compared with around USD 1.0 million through the Suez Canal.
Higher freight, fuel, insurance, and inventory expenses can therefore raise the landed cost of sensor components and delay distributor restocking. Trade policies are creating additional pressure. U.S. Section 301 tariffs on Chinese semiconductors increased to 50% from January 2025, affecting chips, diodes, transistors, and signal-conditioning components used in proximity sensors.
Alternative sourcing can require technical testing and supplier qualification, increasing procurement costs and lead times. Commodity inflation is another concern, with the World Bank projecting its metals and minerals price index to rise 17% in 2026, while aluminum prices could increase by around 22%.
Regional Analysis
In 2025, North America held the leading position in the global proximity sensor market, accounting for 35.8% of revenue and around USD 1.8 billion in market value. The region benefits from strong automation across automotive, metalworking, food processing, electronics, logistics, and warehouse operations.
According to the International Federation of Robotics, 393,700 industrial robots were operating in U.S. factories in 2024, representing a 3% increase from the previous year.
Asia Pacific is expected to be the fastest-growing regional market due to its large manufacturing base and rapid automation across China, Japan, South Korea, India, and Southeast Asia. IFR reported that Asia represented 74% of global industrial robot installations in 2024, compared with 16% in Europe and 9% in the Americas.
China alone had around 2.03 million industrial robots in operation in 2024, more than 5 times the U.S. installed base. Growing automation in electronics, batteries, automotive production, machine tools, and intralogistics is expected to strengthen regional demand for proximity sensors.
Key Regions and Countries
North America
- US
- Canada
Europe
- Germany
- France
- The UK
- Spain
- Italy
- Rest of Europe
Asia Pacific
- China
- Japan
- South Korea
- India
- Australia
- Rest of APAC
Latin America
- Brazil
- Mexico
- Rest of Latin America
Middle East & Africa
- GCC
- South Africa
- Rest of MEA
Market Dynamics
Drivers
| Driver | (~) % CAGR | Geographic Relevance | Impact Timeline |
|---|---|---|---|
| Factory Automation Expansion | +1.8% | Global | Short term (2 years or less) |
| EV Production Scaling | +1.2% | Asia Pacific, Europe, North America | Medium term (2 to 4 years) |
| Warehouse Automation Deployment | +0.9% | North America, Europe, Asia Pacific | Short term (2 years or less) |
| Smart Factory Retrofits | +0.7% | Europe, Japan, South Korea | Medium term (2 to 4 years) |
| Machine Safety Upgrades | +0.5% | Global | Medium term (2 to 4 years) |
Factory Automation Expansion
The global operating robot base also reached 4.664 million units, increasing 9% year over year. Annual industrial robot installations have remained above 500,000 units for 4 consecutive years, supporting demand for IO-Link-enabled and condition-monitoring sensors.
Each automated production line requires multiple sensors for part detection, positioning, tool verification, and safety control. Rising automation investment and higher sensor use per production line are estimated to add around 1.8% to the market’s baseline 7.2% CAGR.
Restraints
| Restraint | (~) % CAGR | Geographic Relevance | Impact Timeline |
|---|---|---|---|
| Semiconductor Import Tariffs | -1.4% | North America, China | Short term (2 years or less) |
| High Industrial Borrowing Costs | -0.9% | North America, Europe | Short term (2 years or less) |
| OEM Inventory Correction | -0.7% | Global | Short term (2 years or less) |
| Capital Equipment Deferrals | -0.6% | Europe, North America | Medium term (2 to 4 years) |
| Low-Cost Sensor Imports | -0.5% | Global | Medium term (2 to 4 years) |
Semiconductor Import Tariffs
Semiconductor tariff exposure is a major restraint because proximity sensors rely on microcontrollers, signal-conditioning ICs, transistors, and communication chips. The U.S. Section 301 tariff on Chinese semiconductors increased from 25% to 50% in January 2025.
UNCTAD also reported that the China Containerized Freight Index increased by around 120% during2024, partly due to longer shipping routes around the Cape of Good Hope. Higher tariff, freight, metal, and energy costs raise component prices for sensor manufacturers.
Suppliers may face margin pressure when these costs cannot be passed quickly to customers, while equipment manufacturers may delay non-essential automation upgrades. Together, these pressures are estimated to reduce the market’s baseline 7.2% CAGR by around 1.4%.
Challenges
| Challenge | (~) % CAGR | Geographic Relevance | Mitigation Horizon |
|---|---|---|---|
| Multi-Region Supply Qualification | -1.1% | Global | Medium term (2 to 4 years) |
| Industrial Cybersecurity Compliance | -0.8% | Europe, North America | Medium term (2 to 4 years) |
| Skilled Automation Labour Gap | -0.7% | Global | Long term (4 years or more) |
| Interoperability Standard Fragmentation | -0.6% | Global | Medium term (2 to 4 years) |
| Application Engineering Complexity | -0.5% | Global | Long term (4 years or more) |
Multi-Region Supply Qualification
Multi-region supply qualification remains a major challenge because sensor manufacturers must approve alternative suppliers for semiconductors, connectors, enclosures, and printed circuit boards without affecting product quality or safety.
UNCTAD reported that Suez Canal tonnage in early 2025 remained around 70% below the 2023 average, increasing the need for buffer inventories and dual sourcing. Changing component suppliers also requires IEC compliance checks, customer validation, and ISO 9001 quality procedures before full-scale production can begin.
These additional engineering, testing, audit, and inventory costs can slow supply-chain flexibility and are estimated to reduce the market’s maximum growth potential by around 1.1% until regional sourcing networks become more mature.
Opportunities
| Opportunity | (~) % CAGR | Geographic Relevance | Execution Window |
|---|---|---|---|
| Connected Sensor Service Models | +1.6% | North America, Europe, Japan | Medium term (2 to 4 years) |
| Battery Manufacturing Automation | +1.3% | Asia Pacific, Europe, North America | Medium term (2 to 4 years) |
| Autonomous Mobile Robot Sensing | +1.1% | Global | Medium term (2 to 4 years) |
| Brownfield Retrofit Kits | +0.9% | Europe, North America | Short term (2 years or less) |
| Hazardous Area Sensor Solutions | +0.7% | Middle East, Asia Pacific | Long term (4 years or more) |
Connected Sensor Service Models
Connected sensor service models remain an underused opportunity because most proximity sensors are still sold as one-time hardware rather than as monitored assets with diagnostic and predictive-maintenance services. Moving even a small share of installations toward software-enabled monitoring can create recurring service revenue and improve profitability.
Predictive diagnostics can help reduce unplanned downtime, while managed sensor services may increase gross margins by an estimated 5% to 10% compared with stand-alone hardware and provide up to 1.6% additional growth above the baseline 7.2% CAGR.
Key Players Analysis
The Proximity sensor market is led by diversified industrial automation companies with strong global distribution, broad product portfolios, and established factory customers. Tier-1 leaders include OMRON, Schneider Electric, Rockwell Automation, Honeywell, Panasonic, SICK, and Pepperl+Fuchs, which together are estimated to hold around 45–55% of global proximity sensor revenue.
OMRON has a strong position through its Industrial Automation Business, which generated JPY 409.5 billion in fiscal 2025, equal to 53% of group sales. The company also spent JPY 21.6 billion on R&D and JPY 6.1 billion on capital expenditure in fiscal 2024. Schneider Electric also benefits from large automation scale, with its Automation business generating EUR 7.02 billion in 2025 revenue, while R&D cash investment is targeted at around 7% of group revenue.
Rockwell Automation remains a major North American competitor, with its Intelligent Devices segment generating USD 3.7 billion in fiscal 2025. Its total R&D spending reached USD 482 million, equal to around 5.7% of group sales. Tier-2 specialists, including SICK, Balluff, ifm electronic, Hans Turck, and Pepperl+Fuchs, are estimated to hold a combined 20–30% share.
These companies compete through specialized inductive, photoelectric, ultrasonic, and hazardous-area sensors. Market competition is increasingly shaped by IO-Link connectivity, shorter delivery times, regional production, and sensor data that help reduce equipment downtime.
Top Key Players in the Market
- OMRON Corporation
- Panasonic Corporation
- Schneider Electric SE
- SICK AG
- Balluff GmbH
- Pepperl+Fuchs
- Hans Turck GmbH and Co. KG
- Honeywell International Inc.
- ifm electronic gmbh
- Rockwell Automation Inc.
Recent Developments
- In 2025, SICK and Endress+Hauser started their strategic partnership for process automation. Under the agreement, around 800 SICK employees across 42 countries moved to Endress+Hauser, while the new Endress+Hauser SICK joint venture included around 730 employees. Both companies each held a 50% stake in the venture.
- In 2025, Balluff launched the new generation of its BOS 6K photoelectric sensor family with Time-of-Flight, blue-light, red-light, laser, color, and contrast sensing options. Selected TOF models provide detection ranges of up to 1,500 mm, while the compact housing measures around 12 × 34 × 21.6 mm.
Report Scope
| Report Features | Description |
|---|---|
| Market Value (2025) | USD 5.2 Billion |
| Forecast Revenue (2035) | USD 10.4 Billion |
| CAGR (2026-2035) | 7.2% |
| Base Year for Estimation | 2025 |
| Historic Period | 2020-2024 |
| Forecast Period | 2026-2035 |
| Report Coverage | Revenue Forecast, Market Dynamics, Competitive Landscape, Recent Developments |
| Segments Covered | By Product Type (Fixed Distance, Adjustable Distance); By Technology (Inductive, Ultrasonic, Photoelectric, Capacitive, Magnetic, Other); By End-Use Industry (Automotive, Aerospace and Defense, Consumer Electronics, Food and Beverages, Other) |
| Regional Analysis | North America – US, Canada; Europe – Germany, France, The UK, Spain, Italy, Rest of Europe; Asia Pacific – China, Japan, South Korea, India, Australia, Singapore, Rest of APAC; Latin America – Brazil, Mexico, Rest of Latin America; Middle East & Africa – GCC, South Africa, Rest of MEA |
| Competitive Landscape | OMRON Corporation, Panasonic Corporation, Schneider Electric SE, SICK AG, Balluff GmbH, Pepperl+Fuchs, Hans Turck GmbH and Co. KG, Honeywell International Inc., ifm electronic gmbh, Rockwell Automation Inc. |
| Customization Scope | Customization for segments, region/country-level will be provided. Additional customization can be done based on requirements. |
| Purchase Options | We have three licenses to opt for: Single User License, Multi-User License (Up to 5 Users), Corporate Use License (Unlimited Users and Printable PDF) |








