


Report Overview
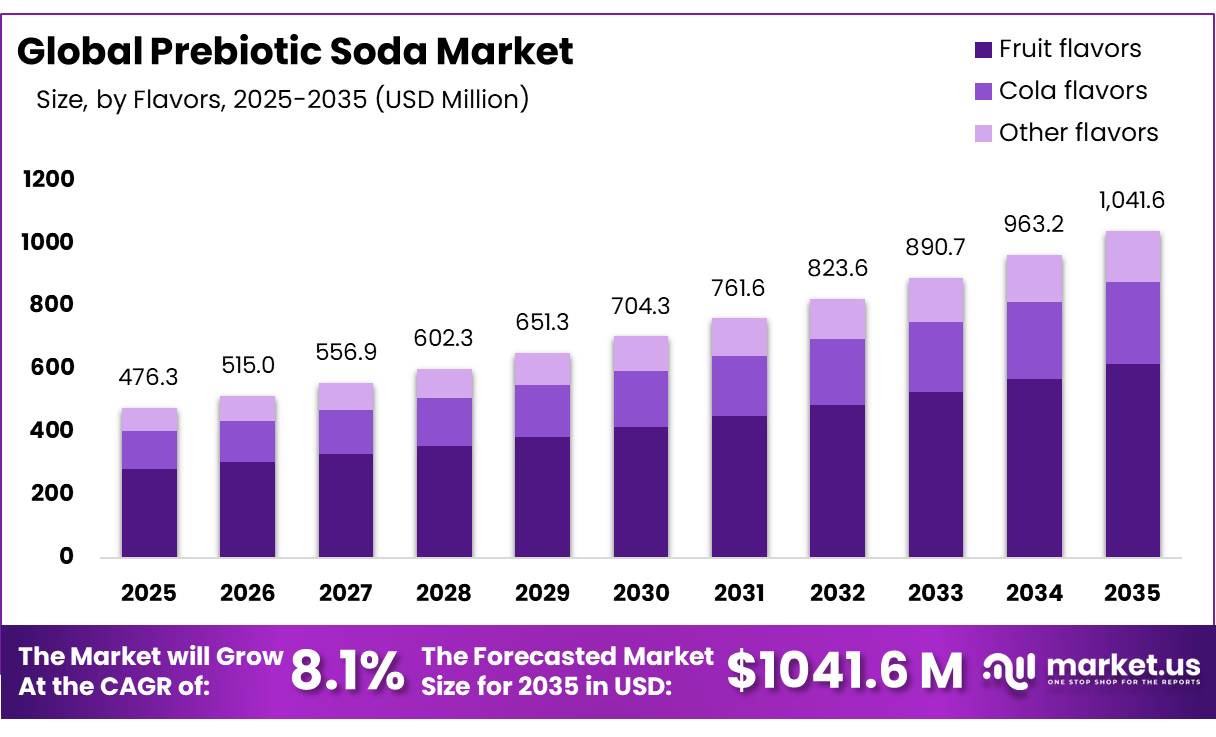
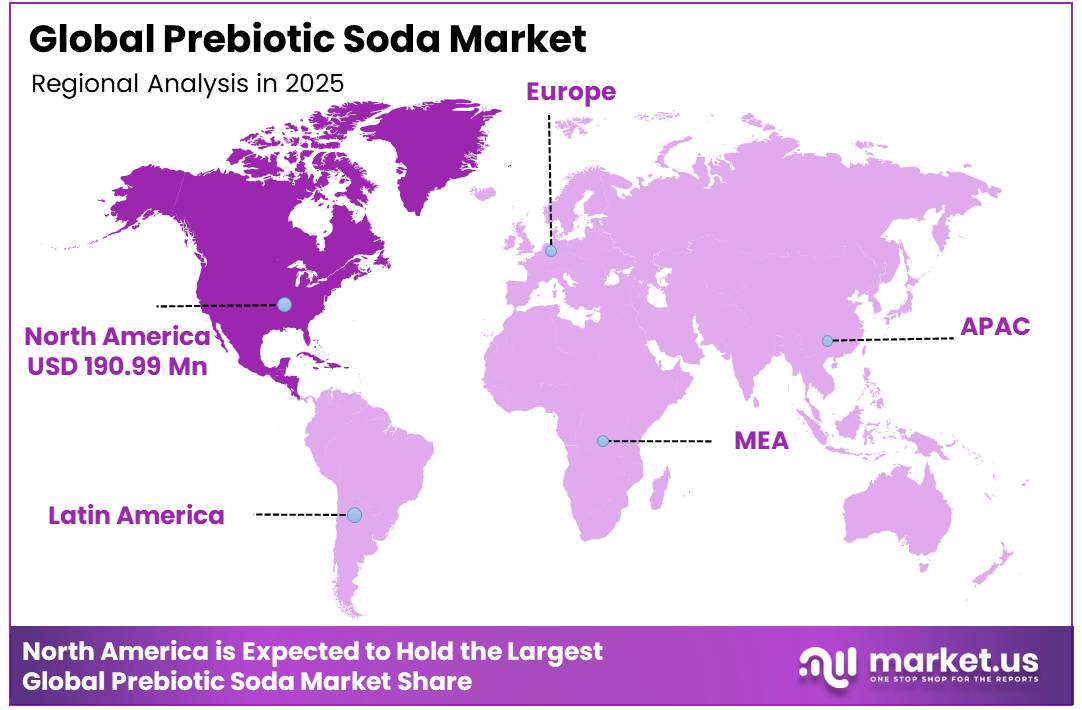
In 2025, the Global Prebiotic Soda Market was valued at US$476.3 million, and between 2026 and 2035, this market is estimated to register a CAGR of 8.1%, reaching about US$1041.6 million by 2035. North America held a dominant market position, capturing more than 40.1% share and generating USD 190.99 million in revenue.
Prebiotic soda is a carbonated beverage formulated with added prebiotic fibres such as inulin or other plant-derived dietary fibres that may support the growth of beneficial gut bacteria as part of a balanced diet. While it closely resembles traditional soda in appearance and taste, it is positioned as a functional alternative with reduced sugar content and added ingredients intended to support digestive health.
- According to the U.S. Department of Agriculture (USDA) and the U.S. Department of Health and Human Services’ Dietary Guidelines for Americans, 2025–2030, U.S. consumers average only 8.1 grams of dietary fibre per 1,000 calories, equivalent to about 58% of the recommended intake.
Key Takeaways
- The global prebiotic soda market was valued at US$476.3 million in 2025.
- The market is projected to grow at a CAGR of 8.1% and is estimated to reach US$1041.6 million by 2035.
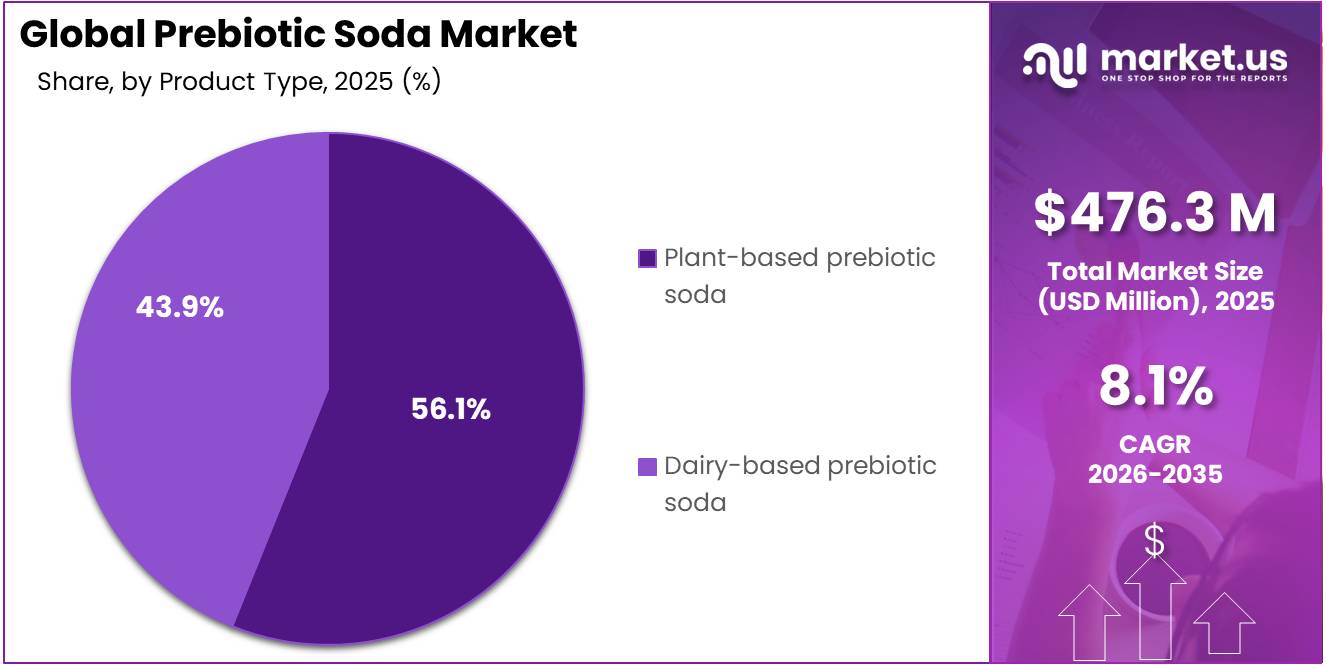
- On the basis of product type, plant-based prebiotic soda dominated the market, constituting 56.1% of the total market share.
- Based on flavors, fruit flavors dominated the prebiotic soda market, with a substantial market share of around 59.1%.
- Based on packaging, cans led the market, comprising 44.7% of the total market.
- Among the distribution channels, supermarkets and hypermarkets held a major share in the prebiotic soda market, accounting for 27.8% of the market share.
- In 2025, North America was the most dominant region in the prebiotic soda market, accounting for 40.1% of the total global consumption.
The expansion of the prebiotic soda market is closely linked to rising consumer interest in gut health and its broader role in overall wellness. Scientific research has increasingly explored potential connections between the gut microbiome and areas such as digestion and immune function, contributing to greater mainstream awareness of digestive health. At the same time, consumers particularly younger demographics, are showing a clear preference for lower-sugar, clean-label beverage options that align with healthier lifestyle choices without compromising on taste or convenience.
- The International Food Information Council (IFIC) released its 2025 Food & Health Survey, which found that 75% of Americans reported trying to limit or avoid sugar, while 63% specifically aimed to reduce their intake of added sugars.
- In addition, the U.S. Centers for Disease Control and Prevention (CDC), 2025, notes that a standard 12-ounce regular soda can contain about 42 grams of added sugar and approximately 150 calories from sugar.
Its growth is further supported by ongoing product innovation, flavour diversification, and increasing retail availability, particularly in North America and other developed beverage markets. As consumer awareness of digestive health and functional nutrition continues to evolve, prebiotic soda is expected to remain an important part of the broader shift toward wellness-focused beverage consumption.
Product Type Analysis
Plant-Based Prebiotic Soda Represents the Dominant Segment in the Market.
Plant-based prebiotic soda leads the market with 56.1% share. Consumers choosing prebiotic soda because they want something cleaner, healthier, and more aligned with a natural lifestyle and plant-based formulations speak directly to that motivation. Made from natural prebiotic fibres derived from sources like chicory root, agave, and green bananas, plant-based prebiotic sodas carry a clean-label credential that resonates strongly with health-conscious buyers who scrutinise every ingredient on the back of the can. They are also naturally suitable for a wider range of dietary preferences vegan, lactose-intolerant, and allergen-sensitive consumers can all drink them comfortably which significantly broadens their addressable consumer base compared to dairy-based alternatives.
- For instance, In February 2025, Olipop one of the leading plant-based prebiotic soda brands achieved a valuation of USD 1.85 billion following a USD 50 million fundraising round, directly reflecting the enormous commercial confidence investors have in the plant-based prebiotic soda segment and its long-term growth potential.
Dairy-based prebiotic soda is the fastest growing segment in the market particularly among consumers who are already familiar with dairy-based functional products like kefir and yoghurt and are comfortable with the gut health credentials that dairy-derived prebiotic ingredients carry. The dairy-based segment benefits from strong brand trust in markets where fermented dairy products have a long cultural history, and it is seeing growing innovation in formats that combine prebiotic fibres with probiotic cultures creating a dual-action functional beverage that appeals to consumers looking for maximum digestive health benefit in a single drink.
Flavor Analysis
Fruit Flavors Represent the Dominant Segment in the Market.
Fruit flavors dominate the prebiotic soda market with 59.1% share. A consumer switching from conventional sugary soda to a healthier functional alternative wants something that feels familiar, refreshing, and enjoyable not medicinal or strange. Fruit flavors deliver exactly that. Whether it is strawberry, raspberry, tropical, or citrus, fruit-flavored prebiotic sodas feel natural, approachable, and genuinely pleasurable to drink lowering the barrier to trial for first-time buyers and keeping existing customers coming back.
- For instance, in September 2025, Prodalim unveiled new fruit-based prebiotic soda concepts combining natural fruit ingredients with digestive health benefits, directly targeting growing demand for clean-label, fruit-flavored functional beverages across international markets. This trend is supported by the 2025 IFIC Food & Health Survey, which found that 84% of consumers said taste strongly influenced their food and beverage purchases, compared with 71% who cited price and 57% who cited healthfulness, highlighting the importance of flavor innovation in the functional beverage category.
Packaging Analysis
Cans Represent the Dominant Packaging Segment in the Market.
Cans lead the prebiotic soda packaging segment with a 44.7% share and their dominance reflects the on-the-go lifestyle of the core prebiotic soda consumer. Cans are lightweight, portable, recyclable, and instantly associated with the refreshing cold beverage occasion that prebiotic soda is designed to fill. For a young, active, and health-conscious consumer who might grab a prebiotic soda from a gym fridge, a convenience store, or a supermarket chiller on the way to work, the can format delivers exactly the right combination of convenience, portability, and premium visual appeal on a retail shelf.
For instance, In May 2025, Poppi one of the most recognized prebiotic soda brands in the US was acquired by PepsiCo for approximately USD 1.65 billion, with PepsiCo immediately citing the brand’s strong can-format retail presence and on-the-go consumption positioning as key strategic assets that aligned perfectly with its existing beverage distribution and retail infrastructure.
- According to the Aluminum Association’s 2025 sustainability data, aluminum beverage cans contain an average of approximately 71% recycled content, significantly higher than competing beverage packaging materials, reinforcing their appeal as a sustainable packaging choice.
Distribution Channel Analysis
Supermarkets and Hypermarkets Represent the Dominant Distribution Channel in the Market.
Supermarkets and hypermarkets account for 27.8% of prebiotic soda distribution the largest single Distribution Channel share because mainstream retail remains the most important point of consumer discovery and trial for a category that is still in the process of building broad mass-market awareness. When a curious but uninitiated consumer first encounters a prebiotic soda on a supermarket shelf positioned in the health beverage aisle next to kombucha and functional waters the physical retail environment provides the context, visibility, and impulse purchase opportunity that no other Distribution Channel can replicate at the same scale.
- The Food Industry Association’s U.S. Grocery Shopper Trends 2025 report, 54% of U.S. grocery shoppers always shop in-store at their primary retailer, while an additional 20% mostly shop in-store. The report also found that 17% of shoppers would miss the product discovery experience offered by physical grocery stores, highlighting the important role of supermarket shelves in introducing emerging products such as prebiotic sodas.
Key Market Segments
By Product Type
- Plant‑based prebiotic soda
- Dairy‑based prebiotic soda
By Flavors
- Fruit flavors
- Cola flavors
- Other flavors
By Packaging
- Bottles
- Cans
- Tetra packs
- Other packaging formats
Distribution Channel
- Supermarkets and hypermarkets
- Direct sales
- Specialty stores and garden centers
- Florists and kiosks
- Small stores and local retailers
- Online retailers and e‑commerce
- Franchises and other Distribution Channels
Driver Analysis
Global SSB Tax Expansion Driving Trade-Up Demand
As of 2025, at least 17 European countries enforce a sugar-sweetened beverage (SSB) excise tax, and the WHO’s 2026 Global Report on SSB taxes documents a continuing escalation in both geographic reach and rate intensity across 50+ countries. The structural mechanic is straightforward: tiered tax regimes such as France’s escalating duty tied to grams of added sugar per hectoliter, Ireland’s three-tier levy, Portugal’s four-band system ranging from €0.01/L to €0.20/L based on sugar density, and Estonia’s newly effective 2026 structure at €0.15–€0.45/L create a persistent price wedge that makes prebiotic sodas with zero or low added sugar economically competitive at shelf despite their premium Bill of Materials.
The UK’s Soft Drinks Industry Levy (SDIL), imposing £0.18–£0.24 per liter on beverages exceeding 5 g sugar/100 mL, has been operationally in force since 2018 and has demonstrably compelled reformulation; the UNESDA data confirms EU soft drinks manufacturers reduced average added sugars by 36.3% since 2000, with a further 14% reduction between 2019 and 2025 alone.
For prebiotic soda producers, this creates a three-vector commercial advantage: their products structurally fall outside the taxed threshold, enabling tax-exempt pricing in tiered regimes; reformulation pressure on legacy CSDs forces category incumbents to redirect innovation budgets toward functional alternatives, validating the format; and consumer behavior research published in PubMed demonstrates that a 1¢/oz. soda tax correlates with a 27.3% decrease in SSB purchases within taxing jurisdictions, directly redirecting that spend into untaxed categories.
Collectively, the SSB tax expansion driver is estimated to contribute +2.2 percentage points to the prebiotic soda CAGR, making it the single highest-impact structural market lever in the near-to-medium term.
Drivers Impact Analysis
| Driver | (~) % Impact on CAGR Forecast | Geographic Relevance | Impact Timeline |
|---|---|---|---|
| Federal Dietary Policy Shift | +1.8% | North America core; secondary EU, APAC spillover | Short term (≤ 2 years) |
| Global SSB Tax Expansion | +2.2% | EU core (UK, France, Ireland, Portugal, Netherlands); LatAm corridors; emerging Asia | Short-to-Medium term (1–4 years) |
| FDA GRAS & Clean-Label Regulatory Clarity | +1.5% | North America primary; Canada, APAC regulatory mirrors | Short term (≤ 2 years) |
| Gut-Brain Axis Science Commercialization | +1.9% | North America, EU R&D corridors; APAC urban premium | Medium term (2–4 years) |
| DTC & E-Commerce Channel Acceleration | +1.7% | North America, Western EU, APAC (China, India); South America spill-over | Medium term (2–4 years) |
| Organic & Clean-Label Premiumization | +1.3% | North America core; EU premium channels; APAC metro corridors | Long term (≥ 4 years) |
Restraint Analysis
Fiber-claim compliance drag
Prebiotic soda growth is constrained by a narrow formulation window between efficacious fiber loading, sensory acceptance, and legally defensible on-pack communication, because in the EU a source of fibre claim requires at least 3 g of fibre per 100 g or 1.5 g per 100 kcal while any broader health positioning must fit the authorized claims framework, and in the U.S. intentionally added ingredients that are not otherwise exempt must clear food-additive or GRAS expectations under FDA rules.
For a typical 330-355 ml can, this pushes many brands toward 5-9 g inclusion ranges that frequently create sediment, haze, viscosity drift, or flavor suppression, raising reformulation cycles by an estimated 2-3 extra pilot rounds and extending commercialization by roughly 4-6 months; the result is higher R&D burn, slower SKU rollout, and lower velocity in mainstream retail where ambiguous digestive-health messaging can trigger legal review and relabeling risk.
Restraint Impact Analysis
| Restraint | (~) % Impact on CAGR Forecast | Geographic Relevance | Impact Timeline |
|---|---|---|---|
| Fiber-claim compliance drag | -1.4% | North America core, EU | Short term (≤ 2 years) |
| Sweetener-cost volatility | -1.1% | North America core, LATAM-linked supply | Short term (≤ 2 years) |
| Packaging rule cost burden | -1.6% | EU, UK-adjacent channels, North America selective | Medium term (2-4 years) |
| Imported input tariff friction | -0.8% | U.S. import corridors, APAC supply routes | Medium term (2-4 years) |
| Price-premium demand ceiling | -1.3% | North America core, Western Europe, urban APAC | Short term (≤ 2 years) |
| Novel-food and claim limits | -0.9% | EU, UK, selective APAC | Long term (≥ 4 years) |
Opportunity Analysis
Fiber-dosing premiumization
Fiber-dosing premiumization is a distinct opportunity because the next stage of the category is not just “more fiber,” but more precisely engineered fiber delivery by use case, daypart, and tolerance profile, which unlocks margin expansion instead of only volume growth. FDA’s current dietary fiber framework rewards formulation discipline, and the category can exploit this by creating laddered SKUs with 3 g, 5 g, and 8 g functional fiber thresholds, thereby monetizing consumers who want incremental digestive benefits without committing to powders or gummies.
On a commercial basis, this can widen gross margin by about 150 to 250 basis points through smaller pack formats, higher ASPs, and reduced discount dependence while supporting a 1.6 percentage point CAGR uplift in North America, the EU, and dense APAC cities where premium functional beverages already have a stronger willingness to pay.
Opportunity Impact Analysis
| Opportunity | (~) % Potential CAGR Upside | Geographic Relevance | Execution Window |
|---|---|---|---|
| GLP-1 companion | +2.4% | North America core, EU metro | Short term (≤ 2 years) |
| Clinical-channel SKU | +1.8% | North America, UK, Australia | Medium term (2-4 years) |
| Fiber-dosing premiumization | +1.6% | North America, EU, APAC urban | Short term (≤ 2 years) |
| Sugar-reduction white space | +2.1% | North America, Latin America, APAC | Medium term (2-4 years) |
| Private-label scale-up | +1.3% | North America mass retail, EU | Medium term (2-4 years) |
| Roll-up and D2C export | +1.9% | North America, EU, GCC, Singapore | Long term (≥ 4 years) |
Challenges Analysis
Fiber input supply volatility
The prebiotic soda category depends heavily on a narrow group of soluble fiber inputs such as inulin and fructooligosaccharides, which are often produced either from chicory or specialized carbohydrate streams concentrated in a limited number of EU and North American plants, creating systemic exposure to the broader supply‑chain instability that government reviews project to persist into 2025. Public‑sector assessments of global supply chains highlight continued shipping delays and port congestion, with transit times on key EU–North America corridors elevated by 20–30% versus pre‑pandemic baselines and variation in container arrival times of 5–10 days, which transmits directly into inventory buffers and safety‑stock requirements for prebiotic ingredients.
When commodity‑scale fiber capacity is congested, prebiotic soda producers face input cost inflation in the high single digits and spike risks of 15–20% during localized shortages, forcing many mid‑tier brands to hold 60–90 days of raw‑material stock instead of 30–45 days, tying up working capital and raising carrying costs by an estimated 0.5–1.0 percentage points of margin. With only a small number of large industrial producers dominating supply, diversification across two or three fiber types typically requires reformulation windows of 6–12 months and validation of sensory and functional performance in 3–5 pilot batches per market, which slows SKU refresh cycles and contributes to under‑utilization of production lines by 3–5% relative to potential.
Combined, persistent volatility in specialty fiber inputs, elevated logistics lead times and limited upstream redundancy reduce the effective speed at which volume can scale, translating into an estimated 1.1 percentage point drag on attainable CAGR as producers prioritize continuity over aggressive expansion until capacity and shipping reliability normalize.
Challenges Impact Analysis
| Challenge | (~) % CAGR Friction Drag | Geographic Relevance | Mitigation Horizon |
|---|---|---|---|
| Prebiotic claim ambiguity | -1.3% | EU, North America core | Medium term (2-4 years) |
| Fiber input supply volatility | -1.1% | EU, North America, APAC | Medium term (2-4 years) |
| Functional beverage plant constraints | -0.9% | North America core, APAC hubs | Long term (≥ 4 years) |
| Regulatory evidence burden | -1.0% | EU regulatory hubs, India | Long term (≥ 4 years) |
| Logistics and trade disruption overhang | -0.8% | Global trade corridors | Short term (≤ 2 years) |
| Skilled formulation talent gap | -0.7% | Global innovation clusters | Long term (≥ 4 years) |
Geopolitical Impact Analysis
Trade Tariffs and Regulatory Fragmentation Are Directly Reshaping Prebiotic Soda Supply Chains and Market Access.
Current geopolitical tensions are reshaping the prebiotic soda market through ingredient sourcing concentration risks, import tariff pressures, regulatory inconsistencies, and accelerating localisation strategies across functional beverage manufacturing ecosystems. The prebiotic soda market is heavily dependent on a concentrated group of countries for its most critical raw materials chicory root inulin from Belgium and the Netherlands, agave-derived fructans from Mexico, and various botanical prebiotic extracts from Asia and Latin America. This geographic concentration of ingredient supply creates meaningful vulnerability for manufacturers, as any disruption to these sourcing relationships through trade restrictions, export controls, or geopolitical instability in key producing regions directly impacts formulation costs, product consistency, and production planning across the entire supply chain.
United States tariff measures introduced in 2025 have elevated the landed cost of imported prebiotic ingredients, driving procurement and formulation strategy changes across the industry. Manufacturers are being pushed toward supply diversification, increased use of long-term supply contracts, and a pivot toward domestically sourced or nearshore prebiotic fibre alternatives where feasible a transition that takes time, adds cost, and in some cases requires reformulation that must go through fresh regulatory review.
Regional Analysis
North America Leads the Global Prebiotic Soda Market.
In 2025, North America dominated the global prebiotic soda market with the largest regional share of 40.1% a commanding lead built on the region’s deeply established functional beverage culture, exceptionally high consumer health awareness, and the most commercially mature prebiotic soda ecosystem in the world. The United States is the single largest and most developed national market for prebiotic soda globally, home to the category’s defining pioneer brands and driven by a consumer base that has embraced gut health as a mainstream daily priority. The region benefits from the most advanced functional beverage retail infrastructure in the world, with prebiotic soda products now widely available across mainstream grocery chains, convenience stores, gyms, and e-commerce platforms simultaneously giving the category a breadth of consumer touchpoints that no other region has yet been able to replicate at the same scale and depth.
Similarly, Canada contributes meaningfully to North America’s regional dominance through its own rapidly growing health-conscious consumer base particularly in major urban centres where functional beverage adoption is accelerating alongside broader wellness lifestyle trends. The landmark acquisition of Poppi by PepsiCo and Coca-Cola’s launch of Simply Pop have injected the full distribution power and marketing firepower of the world’s two largest beverage corporations into the North American prebiotic soda market a development that will dramatically accelerate mainstream retail penetration and consumer awareness across the region through the forecast period. This combination of pioneering brand heritage, unmatched retail infrastructure, and corporate giant investment ensures that North America remains the undisputed core demand centre for the global prebiotic soda market.
Key Regions and Countries Covered
- North America
- The US
- Canada
- Europe
- Germany
- France
- The UK
- Spain
- Italy
- Russia & CIS
- Rest of Europe
- APAC
- China
- Japan
- South Korea
- India
- ASEAN
- Rest of APAC
- Latin America
- Brazil
- Mexico
- Rest of Latin America
- Middle East & Africa
- GCC
- South Africa
- Rest of MEA
Key Players Analysis
Prebiotic soda manufacturers focus on strengthening brand differentiation, product innovation, and distribution scale to maintain competitiveness in the rapidly growing functional beverage market. A key priority is continuous formulation development, including the incorporation of diverse prebiotic fibers, reduced-sugar recipes, natural ingredients, and functional additives that enhance digestive health benefits while maintaining appealing taste profiles. Companies like The Coca‑Cola Company, OLIPOP, Poppi, GT’s Living Foods invest heavily in flavor innovation and consumer-centric product development, as taste remains a critical factor driving repeat purchases and mainstream adoption.
Strategic partnerships with major retailers, convenience stores, and foodservice Distribution Channels help expand market reach and improve shelf visibility in an increasingly competitive environment. Manufacturers also emphasize supply chain optimization and ingredient sourcing to manage production costs while ensuring product quality and consistency. Capacity expansion and broader geographic distribution, particularly across North America and emerging international markets, enable companies to capitalize on growing consumer demand for healthier soda alternatives.
Additionally, market participants focus on brand-building initiatives, digital marketing, influencer partnerships, and direct-to-consumer engagement to strengthen consumer loyalty and increase category awareness. Intellectual property protection around proprietary formulations, packaging innovation, and functional ingredient combinations further supports competitive positioning. Long-term retail partnerships and strategic collaborations with large beverage companies help reinforce market presence, improve distribution efficiency, and strengthen positioning within high-growth functional beverage segments.
The Major Players in The Industry
- OLIPOP
- Poppi
- The Coca‑Cola Company
- GT’s Living Foods
- Health‑Ade Kombucha
- KeVita
- Brew Dr. Kombucha
- Humm Kombucha
- Revive Kombucha
- LIVE Soda
- Culture Pop Sod
- Remedy Drinks
- SunSip
- Wildwonder
- The Gutsy Captain Kombucha
- Others
Key Development
- In February 2026, The Coca-Cola Company expanded its Simply Pop portfolio by introducing the Raspberry Simply Pop flavor. Each 12-ounce (355 mL) can contains 6 grams of prebiotic fibre, 20–30% real fruit juice, 25–30% less added sugar than many traditional soft drinks, and no added probiotics, delivering digestive health benefits through prebiotic fibre while offering a fruit-forward taste.
- In January 2026, Remedy Drinks partnered with the McGrath Foundation and Orora to launch a limited-edition Raspberry Sodaly can, donating AUD 1 from every 250 mL can sold to cancer-care services. The beverage contains 0 g sugar, 8 calories per can, and is packaged in a 100% recyclable aluminum can.
Report Scope
| Report Features | Description |
|---|---|
| Market Value (2025) | USD 476.3 Mn |
| Forecast Revenue (2035) | USD 1041.6 Mn |
| CAGR (2026-2035) | 8.1% |
| Base Year for Estimation | 2025 |
| Historic Period | 2020-2024 |
| Forecast Period | 2026-2035 |
| Report Coverage | Revenue Forecast, Market Dynamics, Competitive Landscape, Recent Developments |
| Segments Covered | By Product Type (Plant-Based Prebiotic Soda and Dairy-Based Prebiotic Soda), By Flavors (Fruit Flavors, Cola Flavors, and Other Flavors), By Packaging (Bottles, Cans, Tetra Packs, and Other Packaging Formats), By Distribution Channel (Supermarkets and Hypermarkets, Direct Sales, Specialty Stores, Small Stores and Local Retailers, Online Retailers and E-Commerce, Franchises, and Other Distribution Channels) |
| Regional Analysis | North America – The US & Canada; Europe – Germany, France, The UK, Spain, Italy, Russia & CIS, Rest of Europe; APAC– China, Japan, South Korea, India, ASEAN & Rest of APAC; Latin America– Brazil, Mexico & Rest of Latin America; Middle East & Africa– GCC, South Africa, & Rest of MEA |
| Competitive Landscape | OLIPOP Poppi The Coca‑Cola Company GT’s Living Foods Health‑Ade Kombucha KeVita Brew Dr. Kombucha Humm Kombucha Revive Kombucha LIVE Soda Culture Pop Sod Remedy Drinks SunSip Wildwonder The Gutsy Captain Kombucha Others. |
| Customization Scope | Customization for segments, region/country-level will be provided. Moreover, additional customization can be done based on the requirements. |
| Purchase Options | We have three licenses to opt for: Single User License, Multi-User License (Up to 5 Users), Corporate Use License (Unlimited Users and Printable PDF) |





































