
Quick Navigation
- Report Overview
- Key Takeaways
- Product Type Analysis
- Interconnect Level Analysis
- Fiber Mode Analysis
- Data Rates Analysis
- Distance Analysis
- Application Analysis
- Key Market Segments
- Drivers
- Restraints
- Challenges
- Opportunities
- Regional Analysis
- Key Regions and Countries
- Key Company Insights
- Recent Developments
- Report Scope
Report Overview
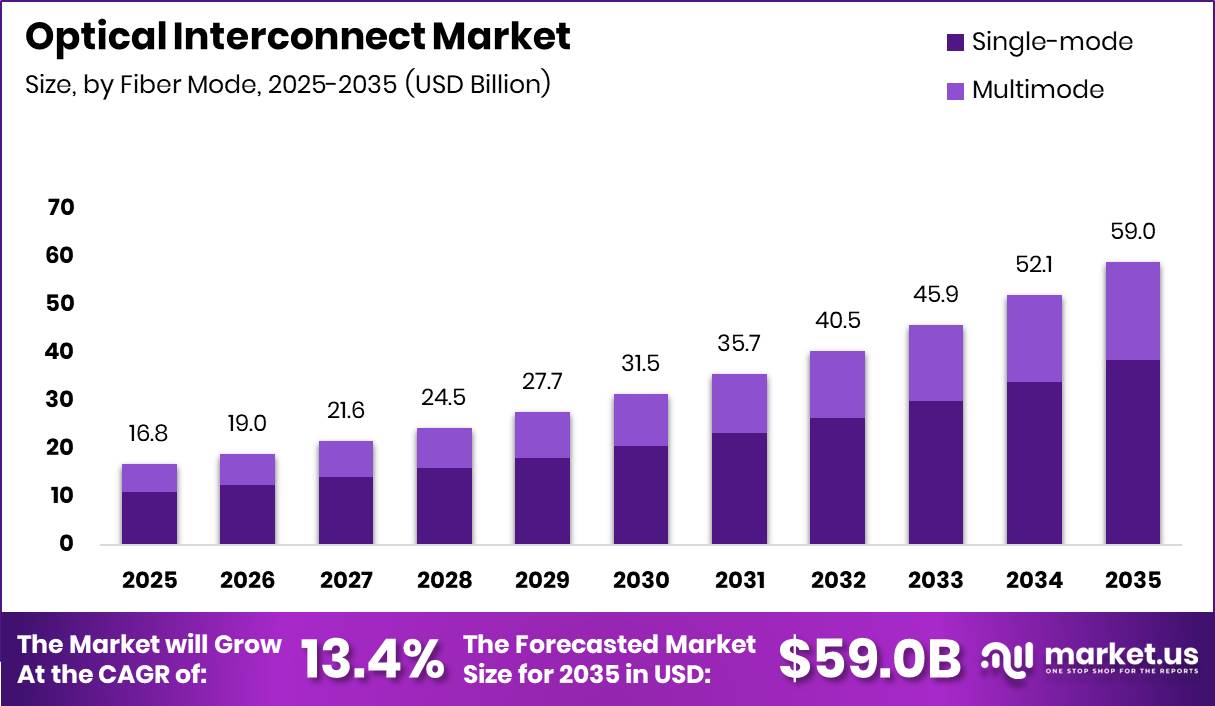
Global Optical Interconnect Market size is expected to be worth around USD 59.0 Billion by 2035 from USD 16.8 Billion in 2025, growing at a CAGR of 13.4% during the forecast period 2026 to 2035. This trajectory reflects capital commitment from hyperscale data centers and AI infrastructure builders who require bandwidth density that copper cannot deliver at scale.
The optical interconnect market covers hardware and photonic components that transmit data as light signals across computing and networking environments. This includes optical transceivers, cable assemblies, connectors, silicon photonics modules, optical engines, and fiber-based systems. The market serves data communication, telecommunications, and military and defense applications. Products are differentiated by fiber mode, data rate, distance range, and interconnect level.
Key Takeaways
- The Global Optical Interconnect Market is valued at USD 16.8 Billion in 2025 and is projected to reach USD 59.0 Billion by 2035.
- The market grows at a CAGR of 13.4% during the forecast period 2026 to 2035.
- By Product Type, Optical Transceivers dominate with a 25.4% share.
- By Interconnect Level, Board-to-Board and Rack-Level Optical Interconnect leads with a 43.4% share.
- By Fiber Mode, Single-mode fiber holds a 65.4% share versus Multimode at 34.6%.
- By Data Rates, the 50-100 Gbps segment leads with 35.6% share.
- By Distance, the 11-100 Km segment holds the largest share at 35.6%.
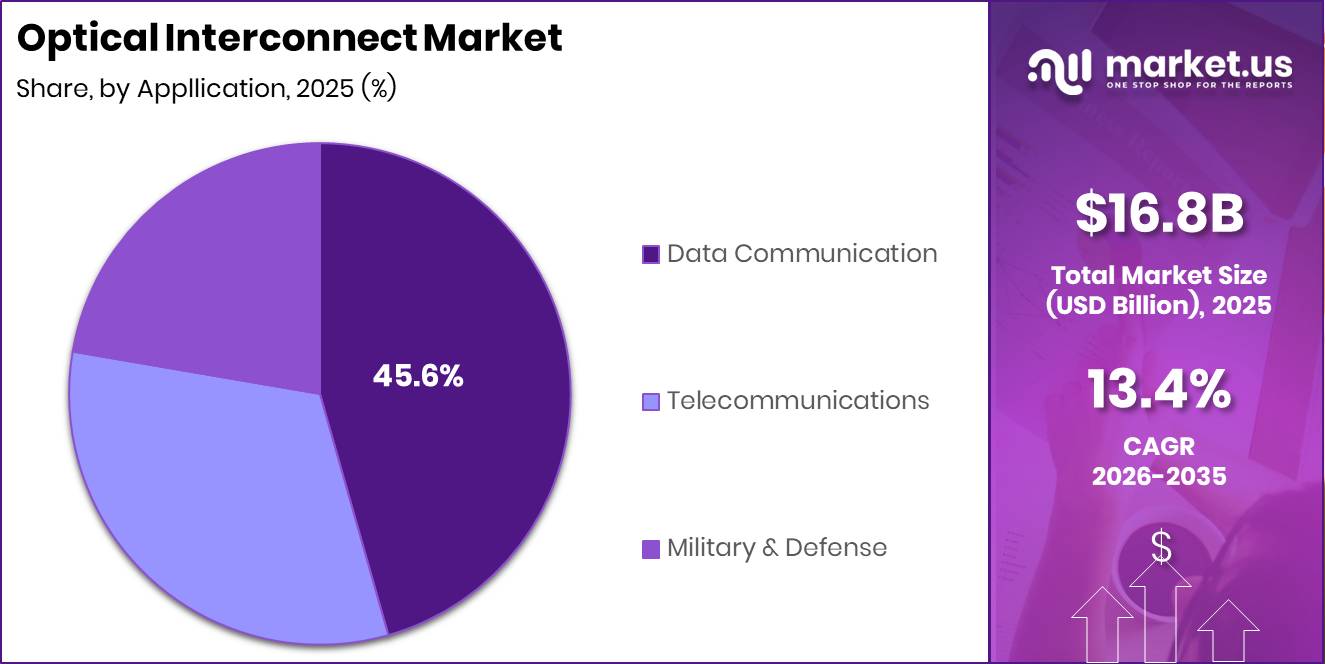
- By Application, Data Communication dominates with a 45.6% share, followed by Telecommunications at 32.1% and Military and Defense at 22.3%.
- Asia Pacific is the dominant region with a 40.1% share, valued at USD 6.73 Billion in 2025.
As per our research, AMD acquired Enosemi in May 2025 to strengthen its silicon photonics and co-packaged optics capabilities for future AI systems. This move signals how semiconductor firms are treating optical interconnect as a core design layer rather than a peripheral procurement category. Vendors that lack integrated photonics capability face a structural disadvantage as AI cluster requirements evolve.
According to Broadcom investor data, the Tomahawk 6 Ethernet switch delivers 102.4 Tbps of switching capacity for AI and optical interconnect networks. This level of throughput sets a new baseline for what hyperscale AI fabric operators expect from network hardware. Vendors unable to meet this performance threshold risk displacement from the highest-value procurement decisions in the market.
Broadcom investor data also shows a single Tomahawk 6 switch can directly connect up to 512 AI accelerators in scale-up architectures. This density reduces the number of network tiers required per cluster, directly lowering infrastructure cost per accelerator. This creates strong pull-through demand for optical interconnects that can operate reliably at this scale.
Product Type Analysis
Optical Transceivers dominate with 25.4% due to universal deployment in data center switching.
In 2025, Optical Transceivers held a dominant market position in the By Product Type segment of the Optical Interconnect Market, with a 25.4% share. Transceivers function as the primary active interface between electrical and optical signals in network equipment. This structural role makes them a mandatory purchase for any data center or telecom operator expanding bandwidth capacity, which sustains demand regardless of broader capex cycles.
Cable Assemblies serve as the physical backbone of optical data center cabling infrastructure. These products connect switches, servers, and storage nodes with pre-terminated fiber links. Buyers prioritize cable assemblies for rapid deployment and reduced installation error, making them a high-volume, repeatable procurement item that supports predictable revenue for suppliers across hyperscale and enterprise segments. In December 2025, LightSpeed Photonics secured USD 6.5 million in funding to accelerate photonic chip and optical interconnect development for AI and high-performance computing data centers, signaling investor confidence in hardware-level optical solutions.
Connectors provide the precision mechanical interface that maintains signal integrity across optical links. Their performance determines insertion loss and return loss across entire optical paths. Connector quality directly impacts system-level reliability, which makes this segment sticky for vendors who can demonstrate consistent precision manufacturing and low failure rates in high-density AI cluster deployments.
Silicon Photonics, Optical Engines, PIC-based Interconnects, Free Space Optics, Fibers and Waveguides, and Others collectively hold the remaining share of the Product Type segment. These categories are attracting disproportionate R&D investment relative to their current revenue share, as hyperscale buyers evaluate them for next-generation co-packaged and chiplet-based architectures.
Interconnect Level Analysis
Board-to-Board and Rack-Level Optical Interconnect dominates with 43.4% due to hyperscale rack density requirements.
In 2025, Board-to-Board and Rack-Level Optical Interconnect held a dominant market position in the By Interconnect Level segment of the Optical Interconnect Market, with a 43.4% share. This segment benefits directly from the expansion of AI training clusters, where rack-level bandwidth aggregation has become a primary bottleneck. Operators that solve rack-level optical density first gain a structural latency and throughput advantage over competitors running copper-based alternatives.
Metro and Long-haul Optical Interconnect addresses carrier and data center operator needs for high-capacity transport over distances exceeding a single facility. This segment is positioned to capture investment from network operators upgrading backbone capacity to support AI inference traffic between distributed data centers. Telecom infrastructure renewal cycles and national broadband programs in APAC and Latin America strengthen mid-term procurement volumes in this category.
Chip and Board-Level Optical Interconnect represents the frontier of packaging integration in the optical market. This segment enables bandwidth scaling within and between chips, addressing the internal communication bottlenecks that arise as AI processor die sizes increase. Vendors who establish a manufacturing lead in chip-level optical integration will secure design wins at the semiconductor level, which are structurally harder to displace than module-level supply relationships.
Fiber Mode Analysis
Single-mode fiber dominates with 65.4% due to long-distance, high-bandwidth transport requirements.
In 2025, Single-mode fiber held a dominant market position in the By Fiber Mode segment of the Optical Interconnect Market, with a 65.4% share. Single-mode fiber’s ability to support coherent transmission over metropolitan and long-haul distances makes it the default choice for telecom operators and data center interconnect deployments. This structural preference reinforces the purchasing decisions of the largest buyers in the market, reducing the competitive window for multimode alternatives outside short-reach environments.
Multimode fiber holds a 34.6% share and retains a defined role in short-reach data center applications where cost per link and ease of termination matter more than maximum distance. This segment is well-suited to intra-rack and campus-level deployments. Vendors focused on enterprise and mid-market data center customers can build stable revenue in multimode without competing directly against the high-volume coherent transport deals that dominate the single-mode segment.
Data Rates Analysis
The 50-100 Gbps segment dominates with 35.6% due to current AI cluster interconnect deployment cycles.
In 2025, the 50-100 Gbps segment held a dominant market position in the By Data Rates segment of the Optical Interconnect Market, with a 35.6% share. This range aligns with the mass deployment of 100G and 400G transceiver platforms that power current-generation AI and cloud infrastructure. Buyers standardizing on this tier today are building infrastructure that will require an upgrade path, creating a visible replacement cycle for vendors who establish early supply relationships.
Less than 10 Gbps, 10-50 Gbps, and More than 100 Gbps segments collectively hold the remaining share. The More than 100 Gbps category is the highest-growth segment by strategic interest, as hyperscale operators qualifying 800G and 1.6T platforms expect this tier to absorb an increasing share of new deployment volume within the forecast period.
Distance Analysis
The 11-100 Km segment dominates with 35.6% due to metro data center interconnect demand.
In 2025, the 11-100 Km segment held a dominant market position in the By Distance segment of the Optical Interconnect Market, with a 35.6% share. This range covers metro and regional data center interconnect links, which are the primary conduit for distributed AI workload management between geographically separated facilities. Buyers deploying AI inference at scale across multiple sites drive the bulk of procurement in this distance band.
Less than 10 Km and More than 100 Km segments hold the remaining distance share. The Less than 10 Km segment serves intra-campus and within-data-center architectures, while the More than 100 Km segment addresses national backbone and submarine cable-adjacent applications that require coherent transmission over extended spans.
Application Analysis
Data Communication dominates with 45.6% due to hyperscale and AI infrastructure expansion.
In 2025, Data Communication held a dominant market position in the By Application segment of the Optical Interconnect Market, with a 45.6% share. Hyperscale cloud and AI compute infrastructure forms the demand base for this segment. Capital expenditure commitments from major cloud operators translate directly into procurement volumes for transceivers, optical engines, and cable assemblies serving data center environments.
Telecommunications held a 32.1% share, making it the second-largest application segment. Telecom operators upgrading core and metro transport networks to handle 5G backhaul and broadband access traffic are the primary buyers in this segment. APAC markets, where 5G rollout and fiber-to-the-home programs remain active, provide the strongest regional demand signal for telecom-segment optical interconnect products.
Military and Defense accounts for a 22.3% share and represents the highest average selling price tier within the application mix. Defense procurement emphasizes reliability, security, and performance over cost, which supports premium pricing for ruggedized optical components. Vendors with established government and defense certifications hold a durable competitive barrier against commercially focused competitors in this segment.
Key Market Segments
By Product Type
- Optical Transceivers
- Cable Assemblies
- Connectors
- Silicon Photonics
- Optical Engines
- PIC-based Interconnects
- Free Space Optics, Fibers and Waveguides
- Others
By Interconnect Level
- Metro and Long-haul Optical Interconnect
- Board-to-Board and Rack-Level Optical Interconnect
- Chip and Board-Level Optical Interconnect
By Fiber Mode
- Single-mode
- Multimode
By Data Rates
- Less than 10 Gbps
- 10-50 Gbps
- 50-100 Gbps
- More than 100 Gbps
By Distance
- Less than 10 Km
- 11-100 Km
- More than 100 Km
By Application
- Data Communication
- Telecommunications
- Military and Defense
Drivers
Ultra-low-latency connectivity serves financial trading hubs including New York-New Jersey, London-Frankfurt, Tokyo-Osaka, and Singapore. Algorithmic trading and cross-venue arbitrage intensify demand for optimized fiber routes with precise timing synchronization. Optical systems designed for ultra-low latency performance command price premiums that create a distinct high-margin segment within broader optical networking deployments.
Emerging workloads including AR/VR, remote robotics, and industrial control systems are expanding latency-sensitive network requirements beyond finance. These applications require deterministic connectivity between edge locations and centralized data centers. Vendors who certify optical products for latency-sensitive industrial and edge environments gain access to a premium-priced segment that is structurally less price-sensitive than standard data center procurement channels.
| Driver | (~) % Impact on CAGR Forecast | Geographic Relevance | Impact Timeline |
|---|---|---|---|
| Managed optics lifecycle services | +2.3% | North America core, EU carriers, Japan | Medium term (2-4 years) |
| Enterprise campus fiber densification | +2.0% | North America enterprise, EU, GCC, APAC tier-1 cities | Short term (≤ 2 years) |
| 5G/FTTx backhaul optical upgrade | +1.9% | APAC corridors, India, Africa, Latin America | Medium term (2-4 years) |
| Open and disaggregated transport networks | +1.7% | EU, North America, India, open RAN and open optical hubs | Medium term (2-4 years) |
| Ultra-low-latency financial and edge links | +1.5% | New York–NJ, London–Frankfurt, Tokyo–Osaka, Singapore hubs | Long term (≥ 4 years) |
| Sustainability-driven optical efficiency gains | +1.6% | EU Green Deal markets, Nordics, North America, Japan | Long term (≥ 4 years) |
Restraints
Cross-border cost pass-through is a structural restraint in the optical interconnect supply chain. The industry spans semiconductors, lasers, substrates, and final assembly across multiple geographies, making it highly sensitive to import duties, freight costs, and currency fluctuations. As reported by U.S. trade data, goods imports reached $304.9 billion in April 2026, including capital goods and computer-related categories, reflecting continued pressure on cross-border electronics supply chains.
Suppliers often cannot fully pass cost increases to customers due to pre-negotiated contracts and pricing resistance from hyperscale buyers. Part of the pressure is absorbed within supplier margins rather than reflected in end pricing. This leads to reduced profitability and encourages regional sourcing adjustments as vendors attempt to optimize cost exposure across geographies and limit exposure to tariff-driven volatility.
| Restraint | (~) % Impact on CAGR Forecast | Geographic Relevance | Impact Timeline |
|---|---|---|---|
| Buyer concentration exposure | -1.8% | North America core, Taiwan supply chain, APAC cloud corridors | Medium term (2-4 years) |
| Standards monetization lag | -1.5% | North America, EU labs, Japan, South Korea | Medium term (2-4 years) |
| EU security compliance cost | -1.3% | EU core, UK adjacency, exporters into Europe | Medium term (2-4 years) |
| Cross-border cost pass-through | -1.6% | North America import lanes, China-plus-one corridors, EMEA | Short term (≤ 2 years) |
| Pluggable price erosion | -1.2% | Global datacom markets, APAC manufacturing hubs | Short term (≤ 2 years) |
| Deployment power economics | -1.7% | North America AI clusters, Nordics, Middle East, East Asia | Long term (≥ 4 years) |
Challenges
Mix volatility across optical form factors creates planning and production challenges in the interconnect market. Demand shifts rapidly between pluggables, coherent modules, short-reach transceivers, and integrated photonics, making capacity forecasting difficult. Financial reporting shows sharp quarter-to-quarter swings in networking revenue, reflecting how quickly product mix and customer priorities can shift across optical product lines.
Customers frequently shift focus toward specific technologies such as 800G pluggables, coherent data-center interconnect modules, or early-stage 1.6T solutions. These transitions lead to inventory mismatches, underutilized manufacturing lines, and inefficient test-capacity allocation. The lack of a single dominant optical architecture forces vendors to maintain multiple parallel product roadmaps, increasing operational complexity and reducing forecasting accuracy across the optical interconnect supply chain.
| Challenge | (~) % CAGR Friction Drag | Geographic Relevance | Mitigation Horizon |
|---|---|---|---|
| Packaging yield instability | -1.6% | Taiwan, US photonics hubs, EU packaging nodes | Medium term (2-4 years) |
| Standards timing misalignment | -1.2% | North America core, EU labs, Japan, APAC hyperscale | Medium term (2-4 years) |
| Skilled photonics labor gap | -1.3% | North America core, EU engineering clusters, Singapore | Long term (≥ 4 years) |
| Customer qualification drag | -1.1% | North America hyperscale, Japan, EU telecom | Medium term (2-4 years) |
| Mix volatility across form factors | -1.0% | Global OEM channels, Taiwan manufacturing, China assembly | Short term (≤ 2 years) |
| Thermal reliability validation | -1.4% | North America AI clusters, Middle East, East Asia | Long term (≥ 4 years) |
Opportunities
M&A-led stack integration offers a strategic path to market consolidation across a fragmented optical ecosystem spanning lasers, DSPs, transceivers, co-packaged optics, and control software layers. Consolidation reduces product development timelines by 18 to 36 months through integrated platforms and acquired capabilities. This creates a direct financial incentive for acquirers to prioritize optical and photonics targets with differentiated intellectual property for AI infrastructure.
Bundling silicon, optics, and firmware into unified offerings strengthens system-level differentiation versus standalone components. This approach improves cross-selling opportunities and increases customer stickiness. Over time, integration shifts competition toward platform-based optical computing stacks, where switching costs are higher and margin structures are more durable than in the commoditized transceiver and cable assembly segments.
| Opportunity | (~) % Potential CAGR Upside | Geographic Relevance | Execution Window |
|---|---|---|---|
| Co-packaged optics ramp | +2.9% | North America core, Taiwan, Japan, EU photonics clusters | Medium term (2-4 years) |
| 1.6T module monetization | +2.4% | North America hyperscale, China, South Korea, Singapore | Short term (≤ 2 years) |
| AI cluster DCI expansion | +2.1% | North America core, Nordics, Middle East, India | Medium term (2-4 years) |
| Optical chiplet platform plays | +1.8% | US design ecosystem, Taiwan foundry chain, EU R&D hubs | Long term (≥ 4 years) |
| Sovereign AI fabric build | +1.7% | EU, India, GCC, Southeast Asia | Medium term (2-4 years) |
| M&A-led stack integration | +1.5% | North America core, Israel, Japan, EU component hubs | Medium term (2-4 years) |
Regional Analysis
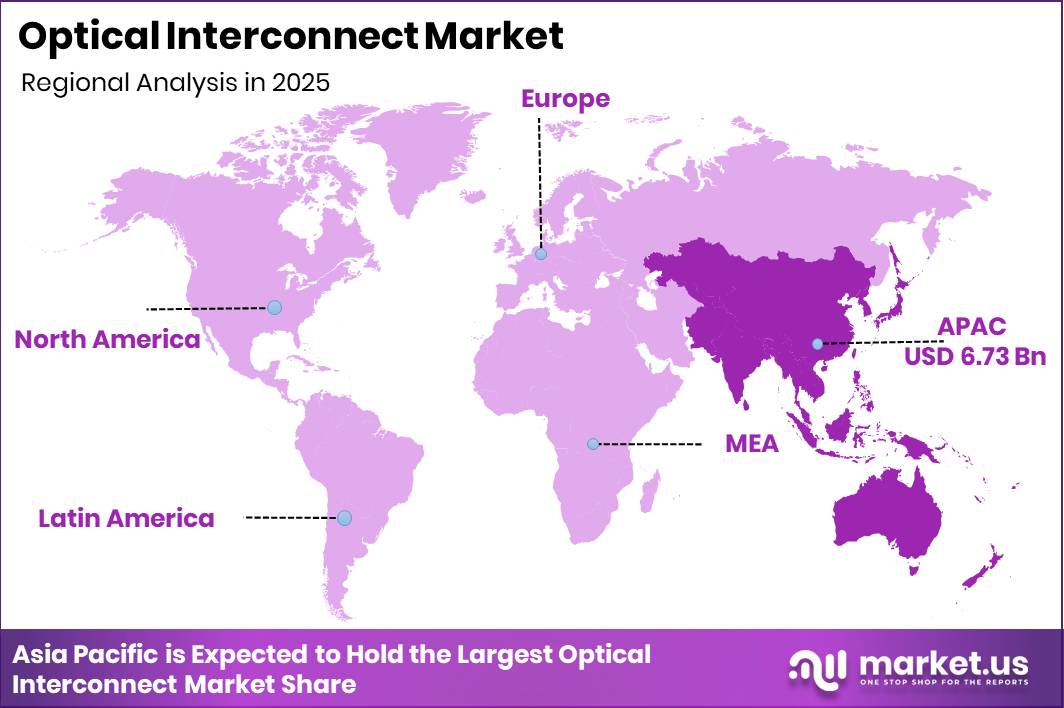
Asia Pacific Dominates the Optical Interconnect Market with a Market Share of 40.1%, Valued at USD 6.73 Billion
Asia Pacific held a 40.1% share of the Optical Interconnect Market, valued at USD 6.73 Billion in 2025. The region concentrates both manufacturing and demand, with Taiwan, Japan, South Korea, and China anchoring the optical component supply chain. Active 5G and broadband infrastructure programs across India, Southeast Asia, and Australia continue to generate sustained procurement volume across transceiver and cable assembly categories.
North America represents the second-largest regional market, driven by hyperscale cloud and AI infrastructure capital expenditure concentrated in the United States. In February 2025, Nokia completed its acquisition of Infinera, strengthening its optical networking and data-center interconnect portfolio to address AI-driven bandwidth demand. This consolidation reflects how North American buyers are reshaping their supplier base to secure integrated optical and networking capabilities for large-scale AI deployments.
Europe’s optical interconnect demand is shaped by carrier network modernization, enterprise fiber densification, and EU-mandated Green Deal efficiency standards. Germany, France, and the UK lead regional procurement. The EU security compliance cost restraint creates added procurement friction for non-European vendors, which benefits suppliers with locally certified product lines and established EU distribution networks.
Latin America and the Middle East and Africa each represent smaller but structurally growing segments. Brazil and Mexico anchor Latin American demand through telecom network expansion programs. GCC countries are investing in AI-ready data center infrastructure as part of sovereign technology initiatives, which creates targeted procurement opportunities in high-performance optical interconnect categories.
Key Regions and Countries
North America
- US
- Canada
Europe
- Germany
- France
- The UK
- Spain
- Italy
- Rest of Europe
Asia Pacific
- China
- Japan
- South Korea
- India
- Australia
- Rest of APAC
Latin America
- Brazil
- Mexico
- Rest of Latin America
Middle East and Africa
- GCC
- South Africa
- Rest of MEA
Key Company Insights
Broadcom holds a structural advantage in AI optical interconnect through its vertically integrated switch and optics portfolio. Its Tomahawk 6 supports scale-out AI networks connecting up to 128,000 XPUs using only two network tiers. In March 2025, Broadcom launched its Sian3 and Sian2M 200G/lane DSP PHY solutions, targeting AI cluster optical interconnects and reducing power consumption in high-bandwidth networks. Co-Packaged Optics reduces power consumption by approximately 70% versus conventional pluggable optics, giving Broadcom a clear differentiation point with hyperscale buyers optimizing data center energy cost.
Coherent Corp. positions itself as a full-stack optical components and modules supplier with coverage across transceiver, laser, and networking hardware categories. This breadth allows Coherent to serve data communication, telecom, and defense application segments simultaneously, reducing concentration risk on any single end market. However, managing multiple product lines across highly differentiated buyer requirements increases operational complexity and R&D allocation pressure, which could slow response time to fast-moving platform transitions in AI-driven interconnect architectures.
Key Players
- Amphenol Communications Solutions
- Broadcom
- Coherent Corp.
- Fujitsu Limited
- InnoLight
- Lumentum Operations LLC
- Molex
- NVIDIA Corporation
- Sumitomo Electric Industries, Ltd
- TE Connectivity
- Aavritii Interconnect Pvt. Ltd.
- ACON OPTICS Communications Inc.
- Radiall
- SYLEX
- Renesas Electronics Corporation
- Other Key Players
Recent Developments
- March 2025 – Teradyne announced the acquisition of Quantifi Photonics to expand photonic integrated circuit testing capabilities for next-generation optical interconnect applications.
- November 2025 – Lightwave Logic launched a technical development program with a Fortune Global 500 customer to co-develop 400Gb/s co-packaged optics solutions for AI networking applications.
- March 2026 – Coherent Corp. launched its CHR1074 224Gbps quad-channel transimpedance amplifier, designed for 800G and 1.6T optical transceivers used in AI and cloud optical interconnect networks.
- March 2026 – The Optical Compute Interconnect Multi-Source Agreement was established by AMD, Broadcom, Meta, Microsoft, NVIDIA, and OpenAI to create open optical scale-up interconnect specifications for large AI infrastructure deployments.
Report Scope
| Report Features | Description |
|---|---|
| Market Value (2025) | USD 16.8 Billion |
| Forecast Revenue (2035) | USD 59.0 Billion |
| CAGR (2026-2035) | 13.4% |
| Base Year for Estimation | 2025 |
| Historic Period | 2020-2024 |
| Forecast Period | 2026-2035 |
| Report Coverage | Revenue Forecast, Market Dynamics, Market Opportunity Analysis, Technology and Innovation Landscape, Competitive Landscape, Recent Developments |
| Segments Covered | By Product Type (Optical Transceivers, Cable Assemblies, Connectors, Silicon Photonics, Optical Engines, PIC-based Interconnects, Free Space Optics, Fibers and Waveguides, Others); By Interconnect Level (Metro and Long-haul Optical Interconnect, Board-to-Board and Rack-Level Optical Interconnect, Chip and Board-Level Optical Interconnect); By Fiber Mode (Single-mode, Multimode); By Data Rates (Less than 10 Gbps, 10-50 Gbps, 50-100 Gbps, More than 100 Gbps); By Distance (Less than 10 Km, 11-100 Km, More than 100 Km); By Application (Data Communication, Telecommunications, Military and Defense) |
| Regional Analysis | North America (US and Canada), Europe (Germany, France, The UK, Spain, Italy, and Rest of Europe), Asia Pacific (China, Japan, South Korea, India, Australia, and Rest of APAC), Latin America (Brazil, Mexico, and Rest of Latin America), Middle East and Africa (GCC, South Africa, and Rest of MEA) |
| Competitive Landscape | Amphenol Communications Solutions, Broadcom, Coherent Corp., Fujitsu Limited, InnoLight, Lumentum Operations LLC, Molex, NVIDIA Corporation, Sumitomo Electric Industries Ltd, TE Connectivity, Aavritii Interconnect Pvt. Ltd., ACON OPTICS Communications Inc., Radiall, SYLEX, Renesas Electronics Corporation, Other Key Players |
| Customization Scope | Customization for segments, region/country-level will be provided. Additional customization can be done based on requirements. |
| Purchase Options | We have three licenses to opt for: Single User License, Multi-User License (Up to 5 Users), Corporate Use License (Unlimited User and Printable PDF) |


