


Report Overview
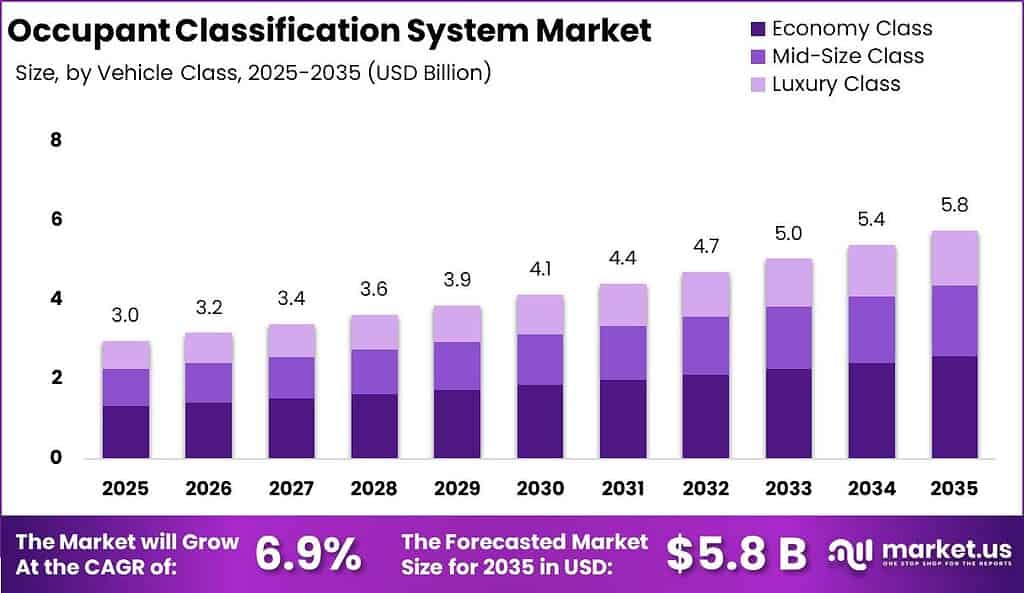
Global Occupant Classification System Market size is expected to be worth around USD 5.80 Billion by 2035 from USD 3.00 Billion in 2025, growing at a CAGR of 6.90% during the forecast period 2026 to 2035. This expansion reflects rising safety content per vehicle rather than simple unit volume growth alone. Investors who track sensor content per seat gain clearer visibility into durable revenue streams across platform cycles.
Therefore, the Occupant Classification System Market covers hardware and software that identify occupant presence, size, weight class, and seating status to manage airbags and belt reminders. The structure spans vehicle class, component, sensor type, propulsion type, electric vehicle type, and application layers. This multi-layer stack lets suppliers sell discrete sensors or full control modules depending on OEM architecture choices.
Key Takeaways
- The market is valued at USD 3.00 Billion in 2025 and is projected to reach USD 5.80 Billion by 2035.
- The market is expected to expand at a CAGR of 6.90% during the forecast period from 2026 to 2035.
- By Vehicle Class, Economy Class led with a 45.00% share in 2025.
- By Component, Sensors held a 63.60% share in 2025.
- By Sensor Type, Seat-Belt Tension Sensors accounted for a 32.00% share in 2025.
- By Propulsion Type, Internal Combustion Engine Vehicles dominated with a 72.00% share in 2025.
- By Electric Vehicle Type, Battery Electric Vehicles led with a 52.00% share in 2025.
- By Application, Airbag Deployment Control held a 29.00% share in 2025.
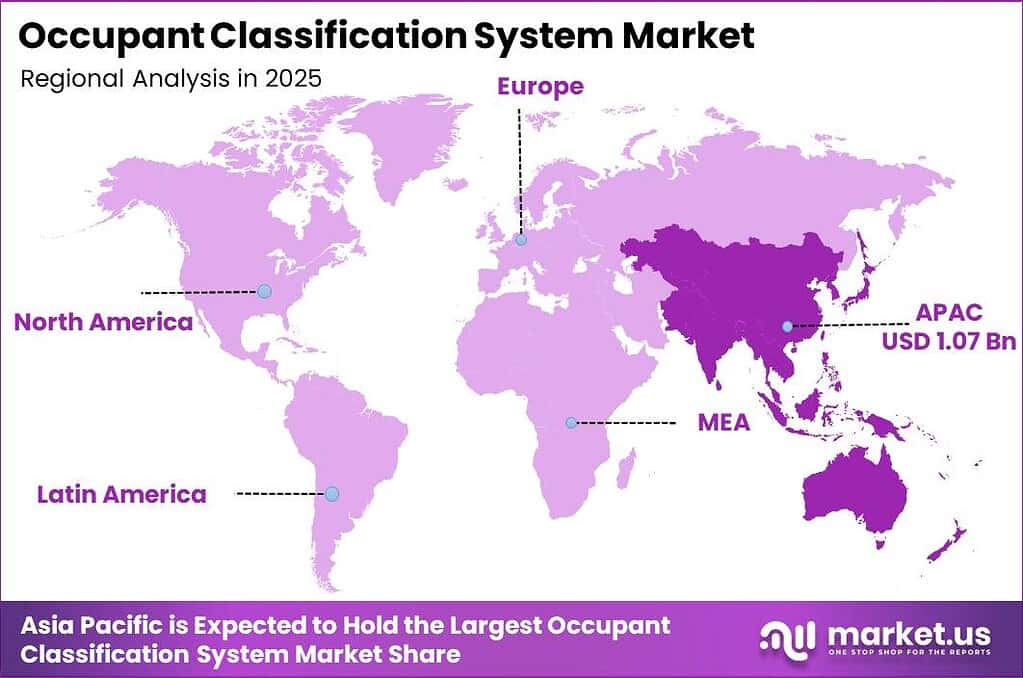
- Asia Pacific dominated the market with a 36.00% share, valued at USD 1.07 Billion in 2025.
As per our research, Euro NCAP awards 0 child-presence-detection points to vehicles that rely only on indirect sensing from 2025 protocols onward. This rule forces OEMs toward direct cabin sensing to protect rating scores. Consequently, classification hardware moves from optional content to score-critical safety architecture on new platforms.
Based on Euro NCAP framework data, the 2025 occupant-monitoring scheme assigns 15 points to child-presence detection within the broader scoring structure. This point weight raises the commercial value of accurate cabin sensors for European-bound models. Suppliers that certify direct sensing early lock multi-year module awards before late entrants clear validation gates.
Figures from a 2025 Hyundai vehicle OCS manual show the passenger airbag status indicator generally illuminates for about 4 seconds after start, while classification completes after several seconds of sensing. This timing standard shapes how cabin electronics sequence power-up diagnostics. In September 2025, ZF presented software-defined vehicle safety and intelligent sensor solutions at IAA Mobility 2025, reinforcing OEM demand for updatable classification logic tied to restraint control.
Vehicle Class Analysis
Economy Class dominates with 45.00% due to high global production volumes.
In 2025, Economy Class held a dominant market position in the By Vehicle Class segment of Occupant Classification System Market, with a 45.00% share. OICA data show global motor vehicle production reached about 96.4 million units in 2025. Economy platforms absorb the largest absolute sensor counts even at lower content per vehicle. Suppliers who win high-volume economy programs secure scale that funds later luxury feature development.
Mid-Size Class vehicles add denser sensor packages as buyers expect higher NCAP scores and multi-stage airbag logic. Asia Pacific produced roughly 59.2 million vehicles in 2025, equal to more than 61% of world output per regional industry tallies. Mid-size growth in that base lifts average OCS bill-of-materials faster than pure economy volume. Vendors that bundle weight and belt-tension sensing for mid-size platforms capture rising content without waiting for luxury-only cycles.
Luxury Class programs specify camera fusion, electric-field sensing, and multi-zone occupancy maps that raise per-vehicle revenue. China alone built about 24.3 million vehicles in 2025 according to OICA-linked country rankings. Luxury and premium mixes inside that output pull advanced classification modules into series production. Early movers on luxury sensor fusion gain reference designs that cascade into mid-size programs later.
Component Analysis
Sensors dominate with 63.60% due to multi-point cabin sensing needs.
In 2025, Sensors held a dominant market position in the By Component segment of Occupant Classification System Market, with a 63.60% share. Global vehicle output near 96.4 million units in 2025 multiplies seat-level sensor demand across every seating row that carries classification duty. This volume concentration rewards sensor specialists with long tooling amortization. Component makers who expand pressure and weight cell capacity capture the largest share of incremental cabin electronics spend.
Airbag Control Units integrate classification outputs into deployment algorithms and fault diagnostics across the restraint network. IEA figures show electric car sales reached about 21 million units in 2025, equal to roughly one in four cars sold worldwide. Higher electronics density in those platforms increases ACU channel counts and software loads. Control-unit suppliers that certify OCS algorithms for mixed ICE and EV architectures protect design-win continuity.
Other Components include wiring, connectors, bladders, and mounting hardware that complete the sensing loop. US production near 7.8 million vehicles in 2025 still requires full harness and seat-structure content for every classified seat. These secondary parts create recurring aftermarket and service demand when sensors are replaced. Integrators who control both sensor and interconnect specifications reduce OEM validation cycles.
Sensor Type Analysis
Seat-Belt Tension Sensors dominate with 32.00% due to belt-reminder regulation links.
In 2025, Seat-Belt Tension Sensors held a dominant market position in the By Sensor Type segment of Occupant Classification System Market, with a 32.00% share. Global light-vehicle production near 96.4 million units multiplies belt-path sensing points as rear-seat reminder rules expand. This regulatory pull stabilizes multi-year sensor demand independent of optional comfort features. Suppliers aligned with belt-reminder mandates secure high attach rates on volume platforms.
Pressure Sensors map load distribution across the seat cushion to separate empty seats from small occupants. Japan produced about 6.2 million vehicles in 2025 per OICA country rankings, sustaining dense domestic demand for mature pressure-mat designs. Pressure technology remains the baseline path for many cost-sensitive programs. Vendors who improve calibration stability cut warranty exposure and win follow-on platform awards.
Weight Sensors provide discrete mass classes that feed airbag suppression logic for child seats and small adults. India produced about 4.8 million vehicles in 2025, expanding the installed base that still relies on weight-based classification. Accurate weight thresholds reduce misclassification risk in mixed seating postures. Manufacturers who tighten sensor-to-seat-frame tolerances lower field failure rates.
Camera-Based Sensors, Electric-Field Sensors, and Other Sensors hold the remaining share collectively and enable fusion architectures for child-presence and posture detection. Germany produced about 3.1 million vehicles in 2025, supporting premium programs that trial these advanced modalities. Fusion paths raise software value over pure hardware replacement cycles. Suppliers who productize multi-modal stacks open subscription-style algorithm upgrades.
Propulsion Type Analysis
Internal Combustion Engine Vehicles dominate with 72.00% due to still-large fleet production.
In 2025, Internal Combustion Engine Vehicles held a dominant market position in the By Propulsion Type segment of Occupant Classification System Market, with a 72.00% share. Global production of about 96.4 million vehicles in 2025 keeps ICE platforms the largest absolute carriers of seat sensors and control units. This base funds supplier factories while EV content ramps. Component makers who keep ICE-qualified part numbers active protect cash flow during the propulsion transition.
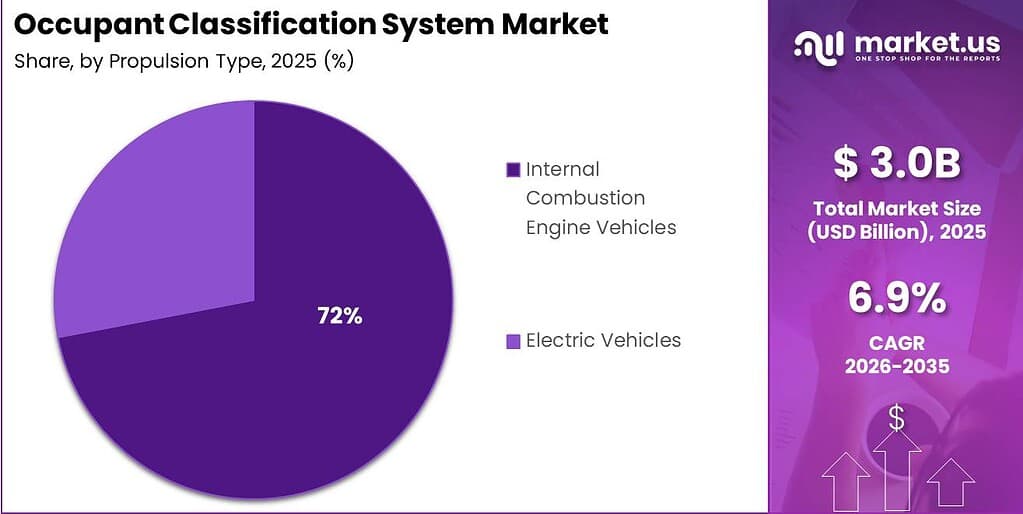
Electric Vehicles require the same core classification functions plus tighter integration with high-voltage cabin electronics and quieter interiors that favor radar or camera sensing. IEA data show electric car sales rose more than 20% year on year to about 21 million units in 2025. Faster EV growth lifts demand for software-defined OCS features on new skateboard platforms. Suppliers who dual-qualify modules for ICE and EV electrical architectures win broader OEM nominations.
Electric Vehicle Type Analysis
Battery Electric Vehicles dominate with 52.00% due to pure-electric sales scale.
In 2025, Battery Electric Vehicles held a dominant market position in the By Electric Vehicle Type segment of Occupant Classification System Market, with a 52.00% share. IEA reporting places global electric car sales near 21 million units in 2025, with BEVs forming the core of that volume. High BEV electronics content supports richer in-cabin sensing suites. Sensor vendors who optimize power draw for always-on cabin monitoring fit BEV energy budgets better than legacy designs.
Hybrid Electric Vehicles retain ICE thermal and packaging constraints while adding electrified power electronics that complicate seat harness routing. Global EV sales share reached about 25% of cars sold in 2025 per IEA-linked summaries. HEV programs still need full FMVSS-class occupant classification on shared platforms. Suppliers offering packaging-flexible mats and controllers serve hybrid lines without unique tooling for every powertrain.
Plug-In Hybrid Electric Vehicles and Fuel Cell Electric Vehicles hold the remaining share collectively and often adopt BEV-like cabin electronics once volumes justify common modules. China vehicle production near 24.3 million units in 2025 includes the world’s deepest EV mix for these subtypes. Common OCS software across BEV, PHEV, and FCEV cuts OEM validation cost. Algorithm providers who certify once across electric subtypes scale faster than hardware-only rivals.
Application Analysis
Airbag Deployment Control dominates with 29.00% due to core restraint regulation duty.
In 2025, Airbag Deployment Control held a dominant market position in the By Application segment of Occupant Classification System Market, with a 29.00% share. World vehicle production near 96.4 million units in 2025 multiplies every seat that must feed suppression or multi-stage airbag logic. This application remains the non-negotiable core of OCS value. Suppliers tied to deployment-control ASIL processes hold the strongest switching barriers.
Occupant Detection establishes empty-versus-occupied status before finer classification runs. Asia Pacific’s roughly 59.2 million vehicles produced in 2025 create the largest regional install base for basic detection loops. Detection accuracy underpins reminder chimes and energy management for other cabin systems. Vendors who cut false-empty errors reduce both safety risk and customer complaints.
Occupant Classification assigns size and weight classes that gate airbag power levels and child-seat logic. US output near 7.8 million vehicles in 2025 still depends on mature classification thresholds under FMVSS frameworks. Clear class boundaries limit over-deployment injuries and under-deployment gaps. Algorithm teams that publish transparent class boundaries win OEM trust during audit cycles.
Seat-Belt Reminder and Child-Presence Detection hold the remaining share collectively and gain weight from Euro NCAP and rear-belt rules. Electric car sales near 21 million units in 2025 add quiet cabins where radar-based presence detection performs well. These applications open software feature flags beyond one-time hardware sales. Providers who certify child-presence paths early capture rating-driven content growth.
Key Market Segments
By Vehicle Class
- Economy Class
- Mid-Size Class
- Luxury Class
By Component
- Airbag Control Unit
- Sensors
- Other Components
By Sensor Type
- Pressure Sensors
- Seat-Belt Tension Sensors
- Weight Sensors
- Camera-Based Sensors
- Electric-Field Sensors
- Other Sensors
By Propulsion Type
- Internal Combustion Engine Vehicles
- Electric Vehicles
By Electric Vehicle Type
- Battery Electric Vehicles
- Hybrid Electric Vehicles
- Plug-In Hybrid Electric Vehicles
- Fuel Cell Electric Vehicles
By Application
- Occupant Detection
- Occupant Classification
- Airbag Deployment Control
- Seat-Belt Reminder
- Child-Presence Detection
Regional Analysis
Asia Pacific Dominates the Occupant Classification System Market with a Market Share of 36.00%, Valued at USD 1.07 Billion
Asia Pacific leads with a 36.00% share valued at USD 1.07 Billion in 2025 on the back of unmatched vehicle output scale. Regional production reached about 59.2 million vehicles in 2025, more than 61% of global assembly. This manufacturing depth pulls sensor and ACU localization into China, Japan, South Korea, and India supply chains. Investors targeting volume programs should prioritize Tier-1 partnerships already embedded in Asia Pacific seat and electronics clusters.
North America ranks among the fastest-growing demand centers as FMVSS 208 rear-seat belt reminder rules force full-cabin sensing upgrades. US vehicle production near 7.8 million units in 2025 still anchors high regulatory content per vehicle. Compliance timelines compress OEM sourcing decisions into short windows. Suppliers with NHTSA-ready validation packs gain share as platforms refresh under the new reminder mandate.
Europe follows with GSR II and Euro NCAP scoring that reward direct child-presence and occupant-monitoring hardware. Germany alone produced about 3.1 million vehicles in 2025, supporting premium sensing specs that set global templates. Latin America and Middle East and Africa add smaller but rising volumes as safety ratings influence import and local-build mix. Regional certification readiness remains the gate for multi-continent module awards.
Key Regions and Countries
North America
- US
- Canada
Europe
- Germany
- France
- The UK
- Spain
- Italy
- Rest of Europe
Asia Pacific
- China
- Japan
- South Korea
- India
- Australia
- Rest of APAC
Latin America
- Brazil
- Mexico
- Rest of Latin America
Middle East and Africa
- GCC
- South Africa
- Rest of MEA
Market Dynamics
Market Opportunity Analysis - Lower-share sensor modes, EV subtypes, and emerging regions still leave white space for focused entrants
Camera-Based Sensors remain outside the leading Seat-Belt Tension share band, so many volume platforms still underuse vision for classification. Economy Class already holds 45.00% of vehicle-class demand, yet most of that mix still runs mature pressure or weight mats. New entrants that offer camera fusion as a drop-in software layer on existing DMS cameras can undercut dedicated mat cost. This path targets OEMs seeking NCAP child-presence points without full seat redesign.
Electric-Field Sensors and Other Sensors also sit outside the 32.00% Seat-Belt Tension lead and suit premium posture detection. Luxury Class programs already pay for richer cabin electronics and can absorb field-sensing validation cost. Suppliers who prove stable classification across reclined seats open a niche ICE and EV premium lane. Early design wins here become reference cases for mid-size cascade later.
Hybrid Electric Vehicles, Plug-In Hybrid Electric Vehicles, and Fuel Cell Electric Vehicles sit below the 52.00% BEV lead inside the EV type split. Shared skateboard electronics still need propulsion-agnostic OCS software. Vendors who certify one algorithm pack across HEV, PHEV, and FCEV cut OEM retest cost. This underexploited subtype set rewards software-first suppliers over single-powertrain hardware houses.
Latin America and Middle East and Africa remain smaller than Asia Pacific’s 36.00% lead valued at USD 1.07 Billion. Rising safety-rating influence on import and local-build mix creates room for cost-optimized economy OCS kits. Entrants who localize simple detection and belt-reminder bundles can win share before global Tier-1s fully prioritize these fleets. Regional aftersales support becomes the practical moat.
Technology and Innovation Landscape - Radar resolution, vital-sign sensing, and high-accuracy child detection redefine cabin safety stacks
A 2026 SAE technical paper on a Mercedes-Benz R&D in-cabin sensing system reported 97% accuracy for occupancy detection and 94% accuracy for vital-sign monitoring. Detection latency stayed under 10 seconds, with emergency response activation within 5 minutes. These figures show classification hardware can extend into health and emergency services. Suppliers who productize vital-sign layers create new OEM feature packages beyond airbag control alone.
Infineon documentation states that its 60 GHz radar sensor can provide child presence detection with more than 99% accuracy across the entire cabin of a 5-seat vehicle. This performance level supports Euro NCAP direct-sensing credit paths. Radar that covers all seats with one module lowers harness complexity versus multi-mat layouts. Manufacturers who integrate 60 GHz parts early align with rating-driven cabin monitoring rules.
A May 2026 engineering review reported that 60 GHz in-cabin radar can deliver resolution down to 5 cm, helping systems separate adults from children. The same review found more than 20 times the resolution of 24 GHz systems, enabled by bandwidth up to 5.5 GHz. Sub-millimeter motion sensing supports breathing and heartbeat detection. Investors should treat high-bandwidth radar IP as a durable differentiator in next-wave OCS awards.
Drivers
The amendment to FMVSS 208 finalized by NHTSA and effective January 3, 2025 requires rear-seat belt use warnings tied to occupant detection logic. Compliance phase-in for new models begins within a 24-month window, so OEMs must lock sensor sourcing now. Tier-1 suppliers report seat-sensor unit content rising by an estimated 15% to 20% per vehicle. This shift converts front-only compliance into full-cabin sensing spend and stabilizes multi-year contracts for classification component makers.
As a result, engineering validation and certification costs are front-loaded, compressing near-term supplier margins by an estimated 150 to 250 basis points. Volume-driven unit economics still improve once platforms clear the statutory deadline. Buyers gain higher rear-row safety performance while sellers secure longer award horizons. Investors should treat mandate-driven content gains as higher-confidence revenue than optional ADAS upsell alone.
| Driver | (~) % Impact on CAGR Forecast | Geographic Relevance | Impact Timeline |
|---|---|---|---|
| FMVSS 208 rear-seat belt reminder mandate | +1.8% | North America | Short term (2 years or less) |
| UN-ECE and GSR II harmonized crash-protection rules | +1.4% | Europe | Short term (2 years or less) |
| Rising mid-size and luxury vehicle production volumes | +1.1% | Asia Pacific | Medium term (2 to 4 years) |
| Tier-1 supplier capacity expansion for pressure/weight sensors | +0.9% | Global | Medium term (2 to 4 years) |
| Consumer safety-rating pressure (NCAP scoring weight) | +0.6% | Global | Short term (2 years or less) |
| Increasing airbag control unit integration density | +0.5% | North America, Europe | Medium term (2 to 4 years) |
Restraints
Major central bank benchmark rates held in a 4.25% to 4.50% range through much of 2025 to 2026 per Federal Reserve and OECD lending-rate indices. Higher financing costs raised the price of vehicle-platform capital for automakers already leveraged from EV tooling. OEM capital expenditure guidance on next-generation interior electronics fell by an estimated 8% to 12%. Deferred platform refreshes slow new OCS design-ins even when end safety demand remains intact.
This means classification-system suppliers tied to new launches face a near-term freeze in incremental unit volume. Fixed R&D amortization spreads over a smaller shipped base and compresses gross margins by an estimated 200 basis points. Market participants must defend cash flow with carry-over part sales and aftermarket service. Investors should stress-test supplier models against prolonged high-rate platform delays through 2026.
| Restraint | (~) % Impact on CAGR Forecast | Geographic Relevance | Impact Timeline |
|---|---|---|---|
| High interest rates delaying OEM platform capex | -1.5% | Global | Short term (2 years or less) |
| EV price compression squeezing safety-content budgets | -1.0% | China, North America | Short term (2 years or less) |
| Semiconductor allocation constraints for ACU chipsets | -0.7% | Global | Short term (2 years or less) |
| Legacy vehicle fleet retrofit restrictions | -0.5% | Emerging markets | Medium term (2 to 4 years) |
| Raw material cost volatility (rare-earth, copper) | -0.4% | Global | Short term (2 years or less) |
Challenges
Pressure-based and electric-field sensors still struggle to separate borderline weight classes across varied seating postures. Supplier quality reports place field misclassification near 2% to 4% of deployed units within the first 36 months. Recurring recalibration and warranty cost create after-sales drag without stopping new-vehicle shipments. This reliability gap opens a revenue path for fusion software and service contracts that cut false class rates.
Tier-1 engineering roadmaps target false-classification incidents below 1% by the early 2030s through weight, pressure, and camera fusion. That investment cycle keeps engineering cost ratios elevated by an estimated 3% to 5% of segment revenue. Companies that sell calibration tools and over-the-air algorithm fixes monetize the pain point directly. Early movers on fusion stacks convert a technical challenge into differentiated service income.
| Challenge | (~) % CAGR Friction Drag | Geographic Relevance | Mitigation Horizon |
|---|---|---|---|
| Sensor calibration accuracy variance | -0.9% | Global | Medium term (2 to 4 years) |
| Skilled embedded-systems talent shortage | -0.6% | North America, Europe | Long term (4 years or more) |
| Fragmented regional certification standards | -0.5% | Global | Medium term (2 to 4 years) |
| Multi-tier supply chain lead-time volatility | -0.4% | Asia Pacific | Medium term (2 to 4 years) |
| Data privacy concerns over in-cabin sensing | -0.3% | Europe | Long term (4 years or more) |
Opportunities
Camera-based fusion is not yet mandated as the default architecture under active FMVSS or UN-ECE text, so it remains optional white space. Repurposing driver-monitoring cameras for occupant classification can lower incremental per-vehicle sensing cost by an estimated 25% to 30% versus dedicated pressure mats. Eliminating duplicate hardware lines improves OEM bill-of-materials efficiency. Suppliers who productize shared-camera algorithms capture share before regulation forces a single design path.
Software-licensing models can sell classification features as over-the-air updates rather than one-time hardware. That margin structure could expand supplier gross margins by an estimated 400 to 600 basis points versus traditional module sales. Early movers who standardize fusion code across platforms and secure regulatory pre-approval own the upgrade lane. Investors should favor firms building recurring software revenue on top of installed cabin cameras.
| Opportunity | (~) % Potential CAGR Upside | Geographic Relevance | Execution Window |
|---|---|---|---|
| Camera-based in-cabin sensor fusion monetization | +1.6% | Global | Medium term (2 to 4 years) |
| Aftermarket retrofit kits for aging fleets | +0.9% | Emerging markets | Medium term (2 to 4 years) |
| Software-defined vehicle subscription safety features | +0.8% | North America, Europe | Long term (4 years or more) |
| Autonomous shuttle and robotaxi cabin adaptation | +0.7% | China, North America | Long term (4 years or more) |
| Cross-licensing with occupant health-monitoring platforms | +0.5% | Global | Long term (4 years or more) |
Key Company Insights
Robert Bosch GmbH deepens vehicle motion and chassis electronics scale after announcing in April 2026 the planned acquisition of Bosch Chassis Systems India Private Limited. This move strengthens regional manufacturing reach for safety-related sensing and control content. Broader motion-portfolio density helps Bosch bundle classification inputs with adjacent vehicle dynamics modules. The approach raises switching costs for OEMs already standardized on Bosch cabin and chassis electronics.
Continental AG positions as a full-stack safety electronics supplier linking occupant sensing to restraint and domain-controller architectures. Integrated offerings reduce OEM interface risk across multi-seat classification programs. Strong European and global OEM relationships support long validation cycles typical of airbag-critical parts. However, heavy reliance on traditional hardware mix leaves margin upside if software-defined cabin features scale faster than hardware refresh rates.
Key Players
- Robert Bosch GmbH
- Continental AG
- ZF Friedrichshafen AG
- DENSO Corporation
- Autoliv, Inc.
- Aptiv PLC
- TE Connectivity Ltd.
- IEE Smart Sensing Solutions
- AISIN Corporation
- Joyson Safety Systems
- Hyundai Mobis Co., Ltd.
- Lear Corporation
- Magna International Inc.
- Forvia SE
- Sensata Technologies, Inc.
Recent Developments
- October 2025: ZF LIFETEC introduced an adaptive restraint system using camera and sensor fusion to classify vehicle occupants in real time, enabling customized airbag and seat-belt deployment strategies based on occupant size, position, and seating condition.
- July 2025: ZF launched the next generation of its Smart Chassis Sensor with integrated 3D acceleration measurement capability, expanding intelligent vehicle sensing functions that support advanced safety and vehicle control applications.
- February 2025: A NHTSA filing identified 30 model-year 2025 Zeekr RT vehicles potentially affected by occupant-weight-sensor software that could disable occupant classification and the passenger airbag, with Zeekr estimating 100% of that population contained the defect.
- March 2026: Ford recalled 3,170 vehicles, comprising 1,515 Bronco Sport and 1,655 Maverick units, over potentially defective occupant-classification-sensor bladder ports, estimating 1% of the population had the defect.
- March 2026: Toyota recalled 15,264 Lexus LX vehicles, with approximately 30% estimated to have insufficient seat-frame clearance capable of causing occupant-load mismeasurement and misclassification.
Geopolitical Impact Analysis
According to WTO trade monitoring, increased tariffs taking effect through 2025 dampen merchandise trade into the second half of 2025 and into 2026. Data from trade notifications show 25% US tariffs on passenger vehicles, light trucks, and many auto parts under Section 232 style measures. These rates raise landed cost for imported seat sensors, bladders, and ACU chipsets used in occupant classification modules. As a result, OEMs accelerate dual-sourcing inside USMCA and Asia assembly hubs to protect restraint-system bill-of-materials.
UNCTAD’s Review of Maritime Transport 2025 projects seaborne trade growth slowing to about 0.5% in 2025 after 2.2% growth in 2024. Longer rerouted voyages lift freight volatility for copper wiring, electronic controllers, and seat structures that carry classification sensors. This logistics friction extends lead times for multi-tier OCS supply chains tied to Asia Pacific export plants. Therefore, Tier-1 suppliers with regional buffer stocks and local module final assembly defend OEM start-of-production dates better than pure long-haul exporters.
Report Scope
| Report Features | Description |
|---|---|
| Market Value (2025) | USD 3.00 Billion |
| Forecast Revenue (2035) | USD 5.80 Billion |
| CAGR (2026-2035) | 6.90% |
| Base Year for Estimation | 2025 |
| Historic Period | 2020-2024 |
| Forecast Period | 2026-2035 |
| Report Coverage | Revenue Forecast, Market Dynamics, Market Opportunity Analysis, Technology and Innovation Landscape, Competitive Landscape, Recent Developments |
| Segments Covered | By Vehicle Class (Economy Class, Mid-Size Class, Luxury Class), By Component (Airbag Control Unit, Sensors, Other Components), By Sensor Type (Pressure Sensors, Seat-Belt Tension Sensors, Weight Sensors, Camera-Based Sensors, Electric-Field Sensors, Other Sensors), By Propulsion Type (Internal Combustion Engine Vehicles, Electric Vehicles), By Electric Vehicle Type (Battery Electric Vehicles, Hybrid Electric Vehicles, Plug-In Hybrid Electric Vehicles, Fuel Cell Electric Vehicles), By Application (Occupant Detection, Occupant Classification, Airbag Deployment Control, Seat-Belt Reminder, Child-Presence Detection) |
| Regional Analysis | North America (US and Canada), Europe (Germany, France, The UK, Spain, Italy, and Rest of Europe), Asia Pacific (China, Japan, South Korea, India, Australia, and Rest of APAC), Latin America (Brazil, Mexico, and Rest of Latin America), Middle East and Africa (GCC, South Africa, and Rest of MEA) |
| Competitive Landscape | Robert Bosch GmbH, Continental AG, ZF Friedrichshafen AG, DENSO Corporation, Autoliv, Inc., Aptiv PLC, TE Connectivity Ltd., IEE Smart Sensing Solutions, AISIN Corporation, Joyson Safety Systems, Hyundai Mobis Co., Ltd., Lear Corporation, Magna International Inc., Forvia SE, Sensata Technologies, Inc. |
| Customization Scope | Customization for segments, region / country-level will be provided. Additional customization can be done based on requirements. |
| Purchase Options | We have three licenses to opt for: Single User License | Multi-User License (Up to 5 Users) | Corporate Use License (Unlimited User and Printable PDF) |





































