
Global Observability Market Size, Share Report Analysis By Component(Solutions; Services), By Deployment Mode (Cloud / SaaS; On-Premises; Hybrid), By Enterprise Size (Small and Medium Enterprises; Large Enterprises), By End-user Vertical (IT and Telecom; BFSI; Retail and E-commerce; Manufacturing; Healthcare and Life Sciences; Government and Defense; Other End-user Verticals), By Application (DevOps and APM; Infrastructure Monitoring; Security and Compliance; Data Observability; Business Analytics; Others), By Regional Analysis, Global Trends and Opportunity, Future Outlook By 2025-2034
- Published date: Dec. 2025
- Report ID: 169869
- Number of Pages: 217
- Format:
-
keyboard_arrow_up
Quick Navigation
- Observability Market Size
- Top Market Takeaways
- Report Overview
- By Component
- By Deployment Mode
- By Enterprise Size
- By End User Vertical
- By Region – North America (37.9%)
- Driver Analysis
- Restraint Analysis
- Opportunity Analysis
- Emerging Trends
- Growth Factors
- Key Market Segments
- Competitive Analysis
- Recent Developments
- Report Scope
Observability Market Size
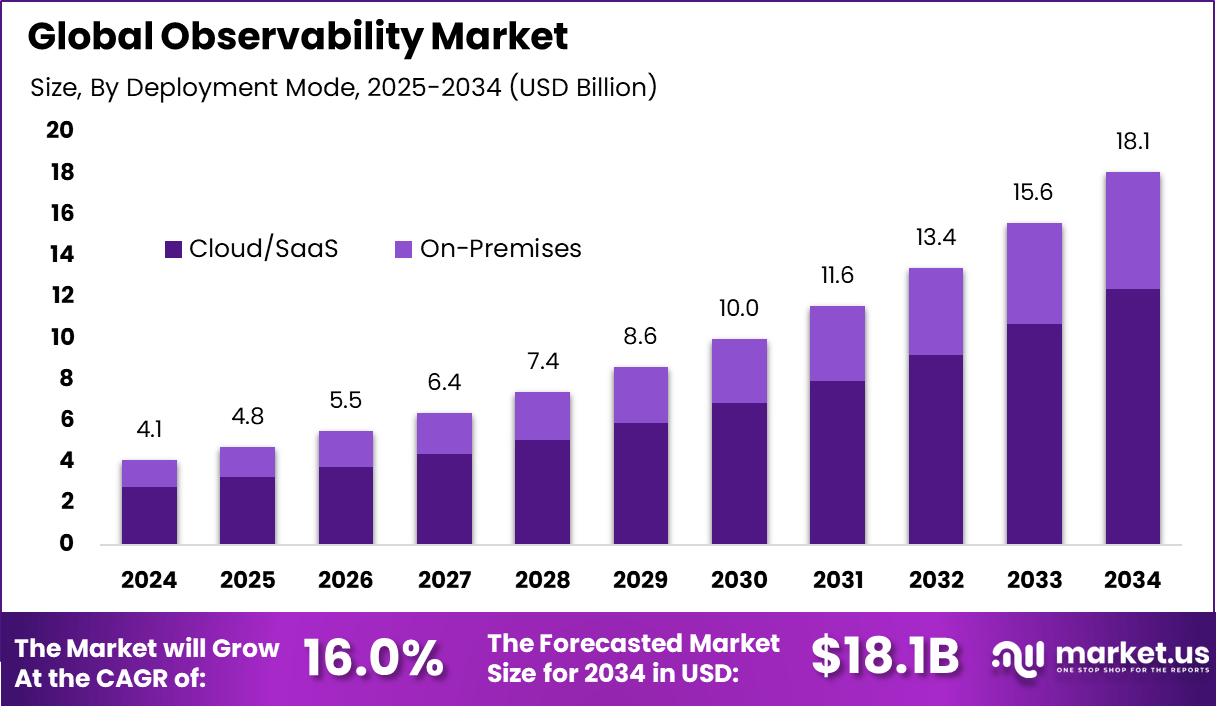
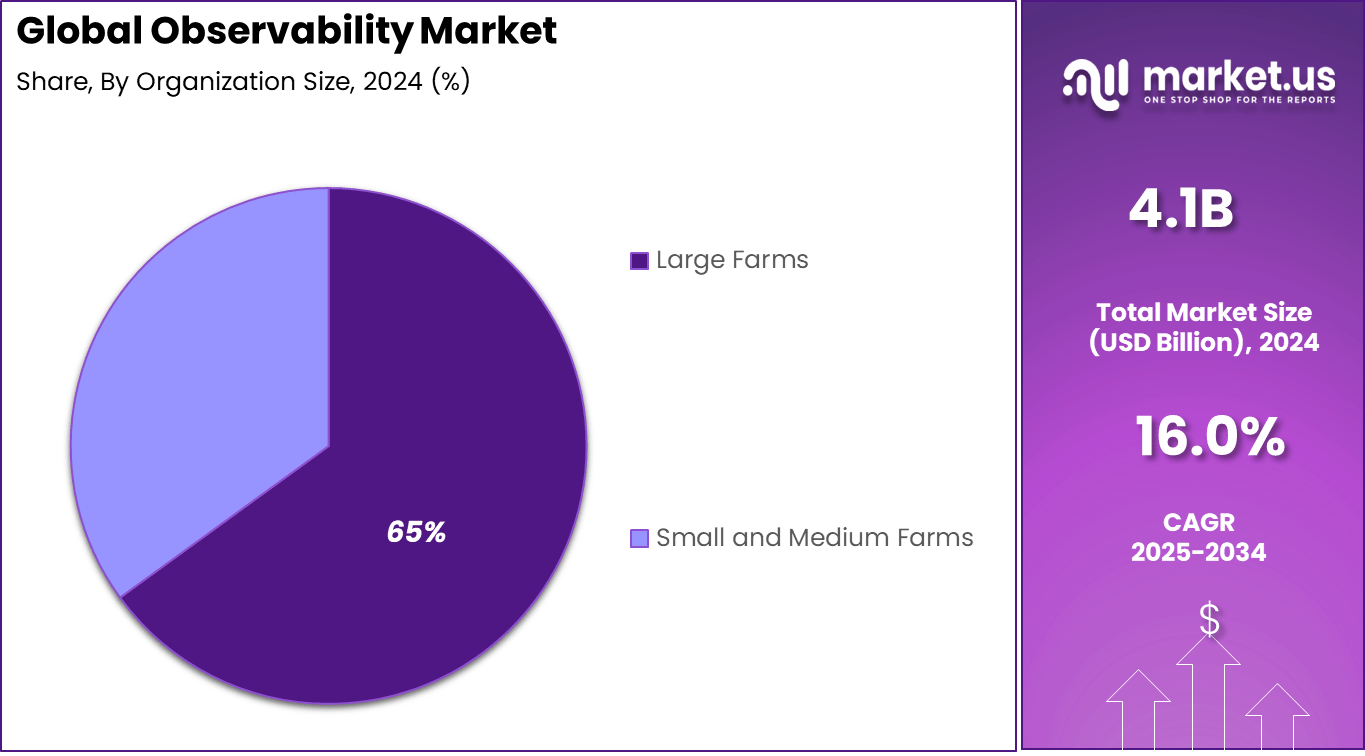
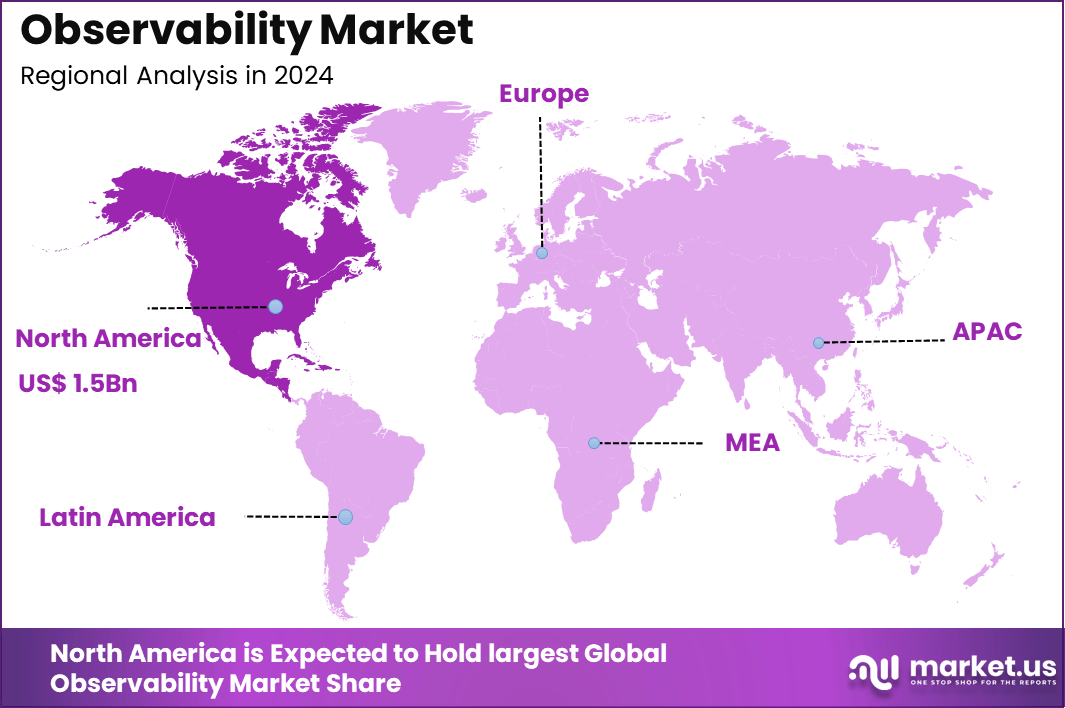
The Global Observability Market generated USD 4.1 billion in 2024 and is predicted to register growth from USD 4.8 billion in 2025 to about USD 18.1 billion by 2034, recording a CAGR of 16% throughout the forecast span. In 2024, North America held a dominan market position, capturing more than a 37.9% share, holding USD 1.5 Billion revenue.
Top Market Takeaways
- Solutions dominated with a 72.9% share, showing that enterprises prefer full observability platforms over standalone monitoring tools.
- Cloud and SaaS deployment captured 68.6%, reflecting strong demand for scalable, flexible, and remotely managed observability systems.
- Large enterprises accounted for 65%, driven by complex application environments and high data visibility needs.
- The IT and telecom sector generated 30.2%, supported by round-the-clock network operations and strict uptime requirements.
- North America led with 37.9%, backed by early cloud adoption, mature DevOps practices, and strong digital infrastructure.
Report Overview
The observability market has grown as organisations depend more on complex digital systems that include cloud platforms, applications, networks and data services. Growth is linked to the need for continuous visibility into system performance, errors and data flow. Observability platforms help organisations understand how their systems behave in real time and identify problems before they affect end users.
The growth of the market can be attributed to rising use of cloud computing, greater adoption of microservices and increasing pressure to maintain high system uptime. As digital services become more critical to daily business operations, even short service interruptions can cause major disruption. Organisations need better tools to detect issues early and reduce the risk of system failure.
According to Market.us, The global AI in observability market was valued at USD 1.4 billion in 2023 and is projected to reach approximately USD 10.7 billion by 2033, expanding at a CAGR of 22.5% during the forecast period from 2024 to 2033. In 2023, North America dominated the market with a 37.4% share, generating around USD 0.52 billion in revenue.
Demand is rising across banking, retail, healthcare, telecom, manufacturing, logistics, government and software service providers. Any organisation that runs customer facing digital platforms depends on observability to track service quality. Demand is highest where online transactions, digital payments and real time data services play a central role in daily operations.
By Component
The solutions segment leads the market with a strong 72.9% share, showing that most observability platforms are delivered through integrated monitoring and analytics software. These solutions help organizations track application performance, infrastructure health, network behavior, and user experience through a single system.
High demand for observability solutions is driven by the growing complexity of digital systems and cloud environments. Enterprises depend on software-based platforms to gain real-time visibility, reduce system downtime, and improve operational efficiency across IT operations.
By Deployment Mode
Cloud and SaaS deployment holds a 68.6% share, reflecting the shift of businesses toward cloud-based digital infrastructure. Cloud-based observability tools allow real-time monitoring, flexible access, and easy scalability without heavy on-site setup.
The adoption of this deployment mode is supported by the rise of remote work, digital services, and multi-cloud operations. Organizations prefer cloud-based tools as they enable rapid performance tracking and faster fault detection across distributed systems.
By Enterprise Size
Large enterprises account for 65.0% of total demand, showing that observability is most critical for organizations with large and complex IT systems. These enterprises manage thousands of servers, applications, and network layers that require continuous monitoring.
Their strong presence in this segment is linked to high digital dependency, strict uptime requirements, and higher business risk from system failures. As a result, observability platforms are treated as essential infrastructure tools rather than optional IT services.
By End User Vertical
The IT and telecom sector generates 30.2% of total end-user demand, making it the largest vertical for observability adoption. These organizations operate large-scale digital networks and customer-facing platforms that demand high performance and stability.
Observability tools help telecom operators and IT service providers monitor data traffic, detect service issues, and maintain service quality. Rising data consumption and network modernization continue to support steady demand from this sector.
By Region – North America (37.9%)
North America leads with a 37.9% regional share, supported by advanced cloud adoption, strong enterprise digitization, and early use of modern IT monitoring tools. Businesses in the region invest heavily in maintaining digital service reliability and performance.
High demand for observability platforms is also linked to the rapid growth of cloud platforms, digital banking, online retail, and software services. Continuous investments in IT modernization and cybersecurity further strengthen regional adoption of observability solutions.
Driver Analysis
A major driver in the observability market is the rapid rise of complex IT environments. Many organizations now run a mix of on-premise systems, cloud services, containers, microservices and distributed applications. Traditional monitoring tools cannot track how these components interact or how failures in one layer affect others.
Observability platforms address this need by collecting and correlating logs, metrics and traces so that teams can understand the health of the entire system. This broad visibility supports quicker detection of problems and reduces time spent diagnosing failures.
Another driver is increasing reliance on digital services across all industries. As more businesses depend on online platforms, mobile apps and connected devices, the cost of downtime increases. Poor service performance affects user experience, customer loyalty and revenue. Observability solutions help teams identify slowdowns, capacity issues or unusual behaviour before users encounter them.
Restraint Analysis
A significant restraint in this market is the cost of managing and storing the large volume of data required for observability. Logs, metrics and traces grow rapidly in modern systems, which leads to high storage and processing expenses. Smaller organizations may find the cost challenging and may adopt limited or partial observability only. Cost concerns can slow adoption, especially for firms without large operational budgets.
Another restraint arises from the difficulty of integrating observability tools across diverse environments. Many companies still rely on older systems that do not easily support telemetry collection. In addition, each environment may use different protocols or formats. Connecting all systems into a single observability layer requires skilled staff and careful planning. This complexity may discourage adoption in organizations with limited technical resources.
Opportunity Analysis
There is strong opportunity in applying observability to industries outside traditional technology sectors. Sectors such as manufacturing, healthcare, finance and transportation are increasingly digital. As they adopt cloud, automation and connected systems, they require tools that help track performance, detect risks and manage service quality. Observability vendors can expand into these areas by offering sector-specific solutions.
Another opportunity is the rising need for observability in multi cloud and hybrid cloud environments. Many companies use services from several cloud providers along with on-premise systems. Observability tools that unify data from all environments and present a single operational picture can help reduce complexity. This creates room for solutions designed for large distributed architectures.
Emerging Trends
A notable trend is the shift from simple monitoring toward platforms that provide context. Instead of only reporting metrics or logs, modern observability tools help teams understand relationships between services, user activity and system behaviour. This trend supports faster problem resolution and more proactive planning.
Another trend is increased interest in observability for security operations. Many organizations are using observability data to detect anomalies, track unusual patterns and support investigation of suspicious activity. This overlap between performance observability and security observability is growing and may shape future platform design.
Growth Factors
One important growth factor is widespread adoption of microservices and container-based architectures. As services become smaller and more distributed, the number of components that must be tracked increases. Observability platforms help teams understand how these components behave together and maintain reliability at scale.
Another growth factor is the need for real-time decision support. Organizations want to identify issues quickly, adjust resource usage and maintain service stability during peak demand. Observability solutions that process data in real time support these goals and help companies maintain smooth operations.
Key Market Segments
By Component
- Solutions
- Services
By Deployment Mode
- Cloud / SaaS
- On-Premises
- Hybrid
By Enterprise Size
- Small and Medium Enterprises
- Large Enterprises
By End-user Vertical
- IT and Telecom
- BFSI
- Retail and E-commerce
- Manufacturing
- Healthcare and Life Sciences
- Government and Defense
- Other End-user Verticals
By Application
- DevOps and APM
- Infrastructure Monitoring
- Security and Compliance
- Data Observability
- Business Analytics
- Others
Regional Analysis and Coverage
- North America
- US
- Canada
- Europe
- Germany
- France
- The UK
- Spain
- Italy
- Russia
- Netherlands
- Rest of Europe
- Asia Pacific
- China
- Japan
- South Korea
- India
- Australia
- Singapore
- Thailand
- Vietnam
- Rest of Latin America
- Latin America
- Brazil
- Mexico
- Rest of Latin America
- Middle East & Africa
- South Africa
- Saudi Arabia
- UAE
- Rest of MEA
Competitive Analysis
GitLab, Broadcom, and Dynatrace lead the observability market with unified platforms that combine application performance monitoring, infrastructure visibility, and automated root-cause analysis. Their solutions help enterprises track system health across cloud, hybrid, and on-premise environments. These companies focus on real-time telemetry, AI-driven analytics, and end-to-end visibility. Growing reliance on cloud-native applications continues to reinforce their leadership.
IBM and LogicMonitor strengthen the competitive landscape with enterprise-grade observability platforms for infrastructure monitoring, network performance, and IT operations intelligence. Their tools support predictive alerts, capacity planning, and service reliability management across complex digital estates. These providers emphasize scalability, security, and integration with IT service management systems. Rising demand for proactive IT operations continues to support their market relevance.
Other participants expand the observability market with specialized tools for metrics, logs, traces, and real-time system diagnostics. Their platforms target mid-sized enterprises and cloud-first teams seeking faster deployment and cost-efficient monitoring. These players focus on usability, customizable dashboards, and API-based integration. Increasing digitalization, microservices adoption, and uptime requirements continue to drive steady demand for observability solutions worldwide.
Top Key Players in the Market
- GitLab B.V.
- Broadcom Inc.
- Dynatrace LLC
- IBM Corporation
- LogicMonitor Inc.
- Others
Recent Developments
- August, 2025 – Broadcom announced AI‑native VMware Cloud Foundation and advanced network observability capabilities around its WatchTower platform, targeting unified visibility across data center and cloud.
- May, 2025 – LogicMonitor used its Elevate 2025 conference to position LM Envision as a hybrid observability fabric, highlighting AI‑driven alert correlation and “agentic” automation for complex, multi‑cloud estates.
- In May 2025, Datadog reported USD 762 million in Q1 revenue and expanded its observability capabilities through the acquisition of Eppo and Metaplane, strengthening experimentation and data analytics across its platform.
- In April 2025, ControlTheory emerged from stealth with USD 5 million in seed funding, aiming to address rising observability costs by improving cost control and efficiency for enterprises.
- In February 2025, New Relic launched its Intelligent Observability Platform, introducing agentic orchestration and GitHub Copilot integration to enhance automation and developer productivity.
Report Scope
Report Features Description Market Value (2024) USD 4.1 Bn Forecast Revenue (2034) USD 18.1 Bn CAGR(2025-2034) 16.0% Base Year for Estimation 2024 Historic Period 2020-2023 Forecast Period 2025-2034 Report Coverage Revenue forecast, AI impact on Market trends, Share Insights, Company ranking, competitive landscape, Recent Developments, Market Dynamics and Emerging Trends Segments Covered By Component(Solutions; Services), By Deployment Mode (Cloud / SaaS; On-Premises; Hybrid), By Enterprise Size (Small and Medium Enterprises; Large Enterprises), By End-user Vertical (IT and Telecom; BFSI; Retail and E-commerce; Manufacturing; Healthcare and Life Sciences; Government and Defense; Other End-user Verticals), By Application (DevOps and APM; Infrastructure Monitoring; Security and Compliance; Data Observability; Business Analytics; Others) Regional Analysis North America – US, Canada; Europe – Germany, France, The UK, Spain, Italy, Russia, Netherlands, Rest of Europe; Asia Pacific – China, Japan, South Korea, India, New Zealand, Singapore, Thailand, Vietnam, Rest of Latin America; Latin America – Brazil, Mexico, Rest of Latin America; Middle East & Africa – South Africa, Saudi Arabia, UAE, Rest of MEA Competitive Landscape Broadcom Inc., Dynatrace LLC, GitLab B.V., IBM Corporation, LogicMonitor Inc. and Others Customization Scope Customization for segments, region/country-level will be provided. Moreover, additional customization can be done based on the requirements. Purchase Options We have three license to opt for: Single User License, Multi-User License (Up to 5 Users), Corporate Use License (Unlimited User and Printable PDF) 
-
-
- GitLab B.V.
- Broadcom Inc.
- Dynatrace LLC
- IBM Corporation
- LogicMonitor Inc.
- Others
Our Clients
- 169869
- Dec. 2025


