
Global Observability-Driven Analytics Market Size, Share and Analysis Report By Component (Software/Solutions, Services), By Deployment Mode (Cloud-based, On-premises), By Organization Size (Large Enterprises, Small and Medium-sized Enterprises), By Application (Root Cause Analysis and Incident Forensics, Business Impact Analysis, Anomaly Detection and Prediction, Customer Experience and Digital Journey Analytics, Others), By End-User Industry (IT and Telecommunications, Banking, Financial Services, and Insurance, E-commerce and Retail, Healthcare, Others), By Regional Analysis, Global Trends and Opportunity, Future Outlook By 2025-2035
- Published date: Feb. 2026
- Report ID: 177906
- Number of Pages: 212
- Format:
-
keyboard_arrow_up
Quick Navigation
- Report Overview
- Key Takeaway
- Key Performance Statistics
- By Component
- By Deployment Mode
- By Organization Size
- By Application
- By End User Industry
- Regional Analysis
- Driver Analysis
- Restraint Analysis
- Opportunity Analysis
- Challenge Analysis
- Top Emerging Trends
- Customer Impact: Trends and Disruptors
- Key Market Segments
- Key Players Analysis
- Recent Developments
- Report Scope
Report Overview
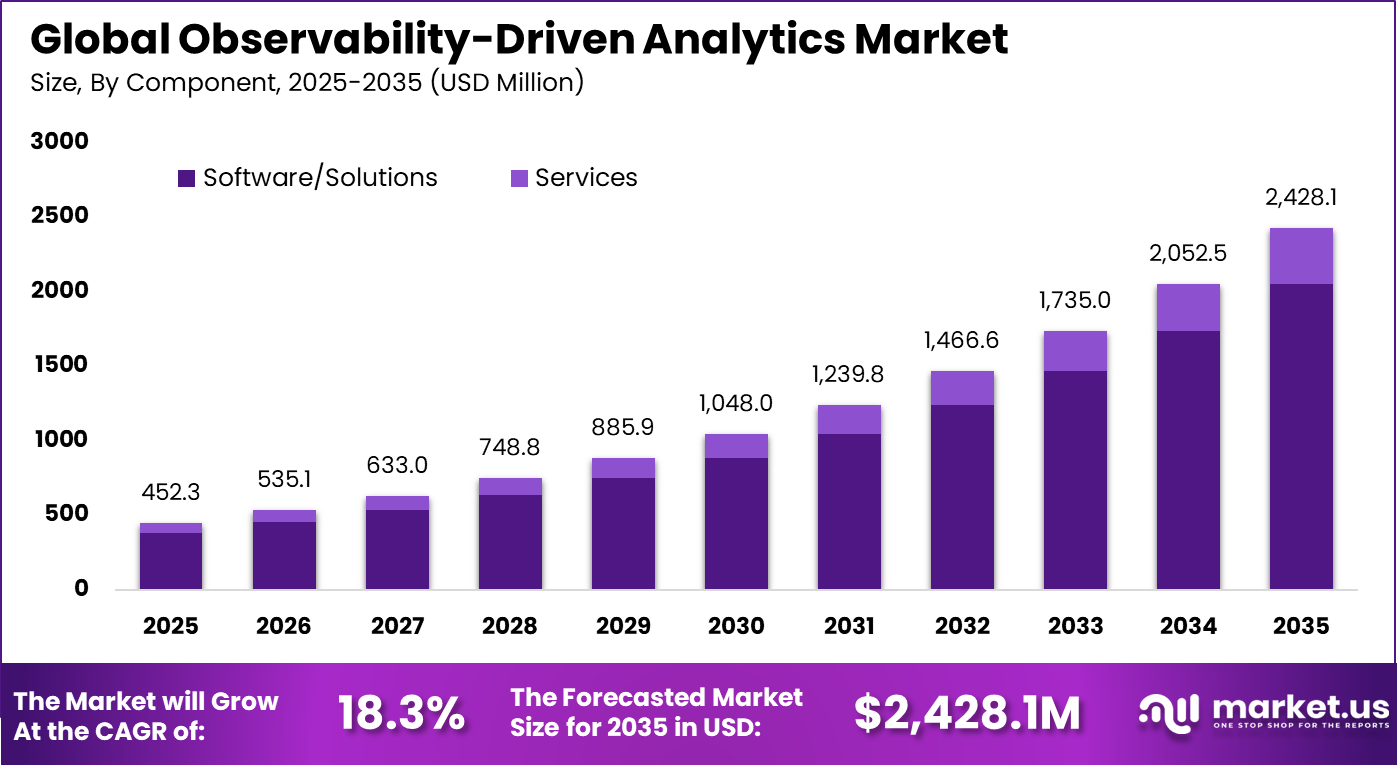
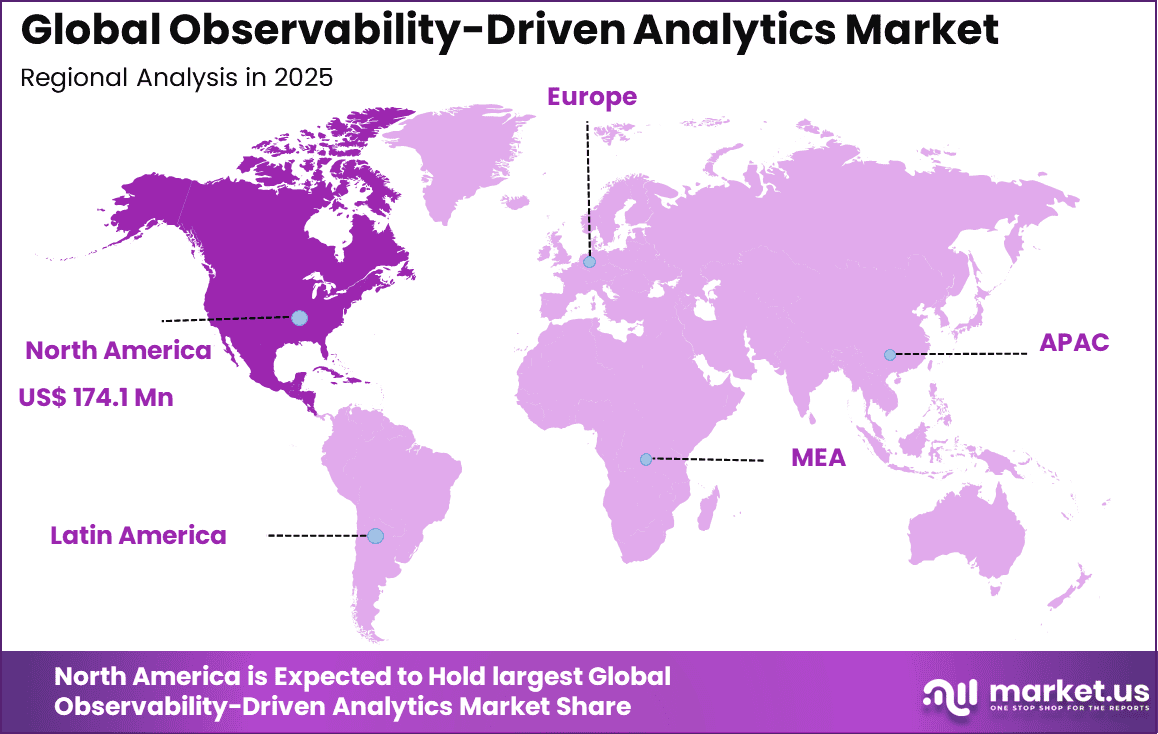
The Global Observability-Driven Analytics Market size is expected to be worth around USD 2,428.1 million by 2035, from USD 452.3 million in 2025, growing at a CAGR of 18.3% during the forecast period from 2025 to 2035. North America held a dominant market position, capturing more than a 38.5% share, holding USD 174.1 million in revenue.
The Observability Driven Analytics Market refers to analytical platforms that transform operational telemetry such as logs, metrics, traces, and events into decision intelligence. Instead of only monitoring system uptime, organizations analyze operational behavior to understand performance patterns, customer impact, and service reliability. The approach connects IT operations with business analytics so operational anomalies can be interpreted in a business context.
Modern enterprises operate distributed applications and complex data ecosystems, making it difficult to rely on periodic reporting. Observability practices monitor reliability, availability and quality across pipelines and detect anomalies immediately. Data observability enables teams to identify and resolve issues in near real time and maintain consistent data reliability across systems. As a result, analytics has shifted from retrospective reporting to operational intelligence.
The primary growth driver is the rapid increase in enterprise data complexity. Organizations now operate multiple ingestion sources such as SaaS applications, APIs, sensors, and transaction systems. Studies in data engineering communities show that almost 60% of data incidents originate from upstream schema or pipeline changes rather than system downtime. Observability platforms address this gap by focusing on data behavior instead of server health.
Demand is strongest among organizations operating real time analytics environments. Streaming pipelines and continuous ingestion significantly increase the chance of unnoticed data drift. Internal surveys within large engineering teams indicate that analytics teams spend nearly 40% of their troubleshooting time locating data quality issues rather than fixing them. Observability reduces this diagnostic effort by automatically identifying the root cause.
For instance, in September 2025, Monte Carlo launched Agent Observability to monitor AI agents and ensure reliable data+AI pipelines. Building on their unstructured data tools, it detects freshness issues in real-time for LLMs and workflows. A timely boost for enterprises scaling gen AI without quality breakdowns.
Key Takeaway
- By component, software and solutions dominated the Observability Driven Analytics Market with a 84.6% share, reflecting strong demand for advanced monitoring and analytics platforms.
- By deployment mode, cloud based solutions led with a 87.3% share, supported by scalability, centralized visibility, and faster implementation.
- By organization size, large enterprises accounted for 76.8% of total adoption, driven by complex digital environments and higher operational monitoring needs.
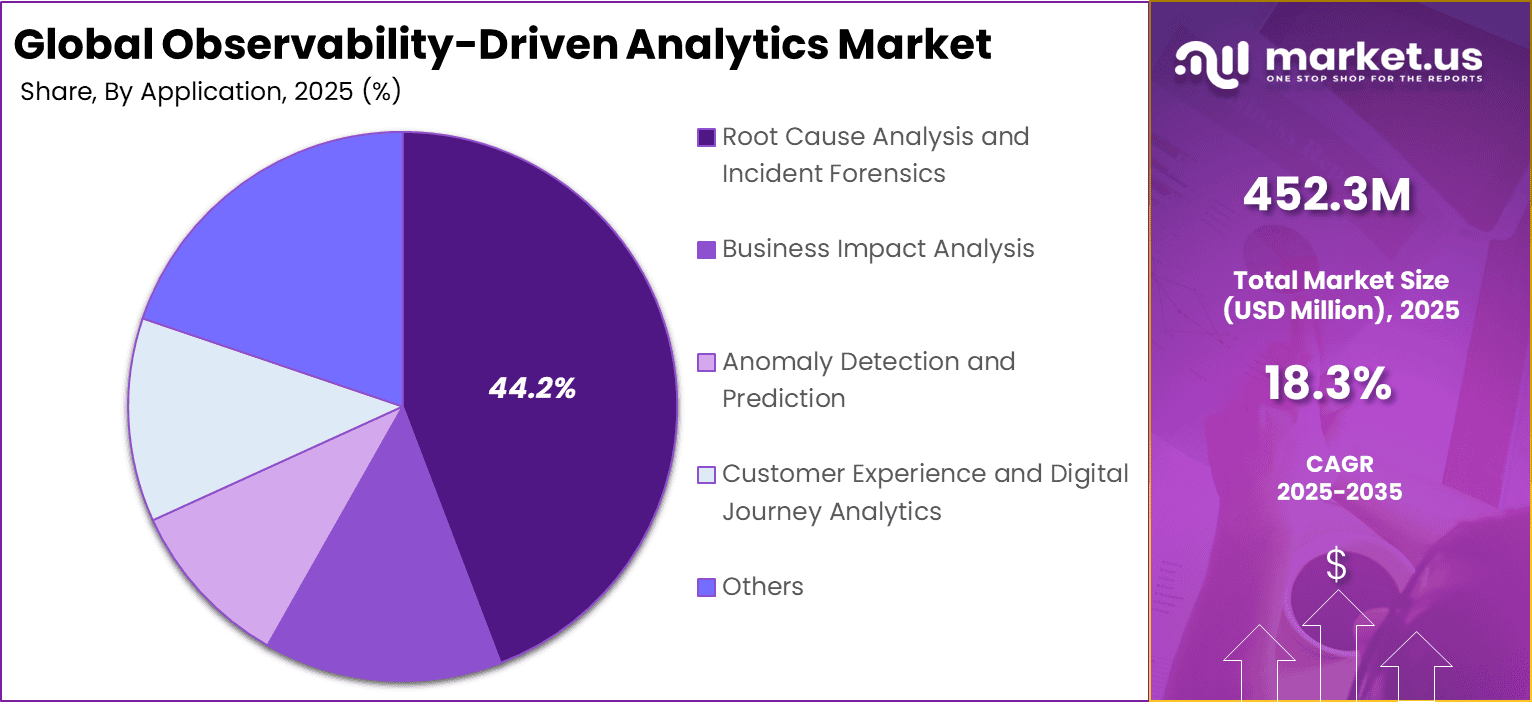
- By application, root cause analysis and incident forensics represented 44.2% of the market, highlighting the focus on faster issue identification and resolution.
- By end user industry, IT and telecommunications held a 52.7% share, supported by high network traffic and continuous service monitoring requirements.
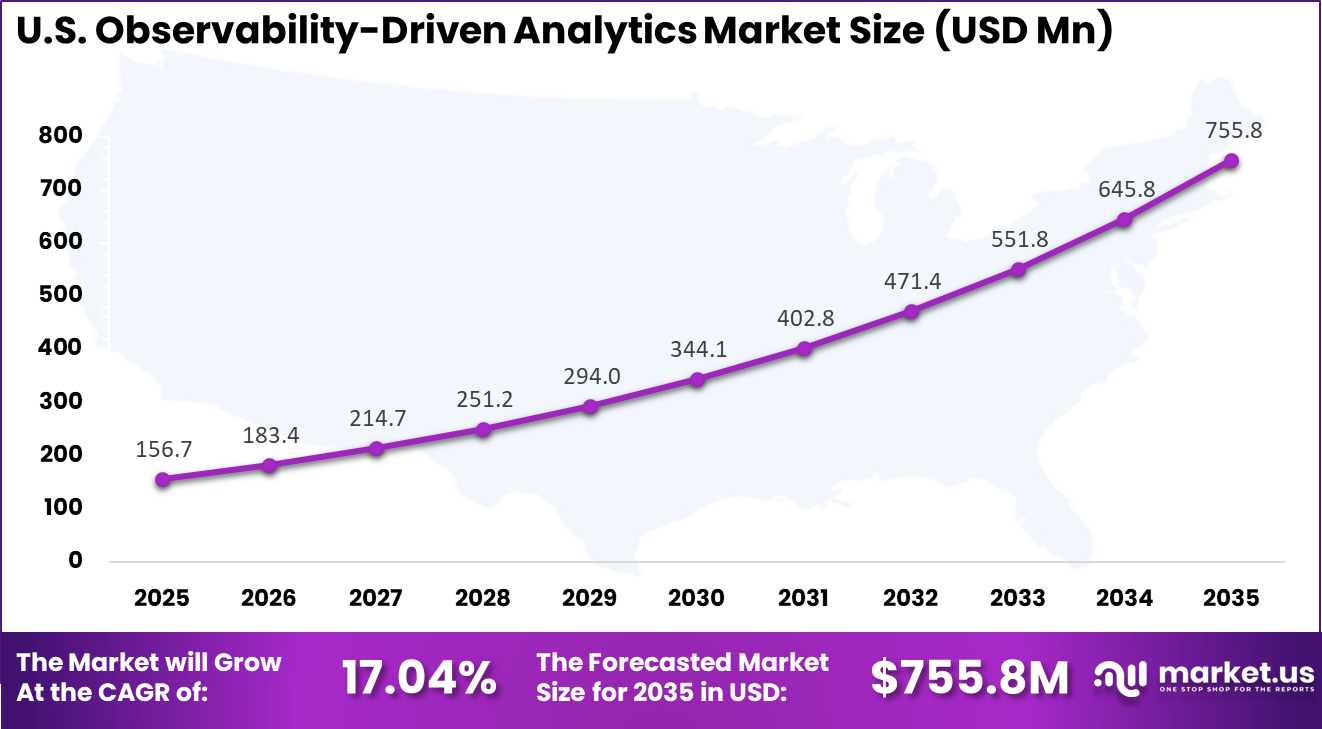
- Regionally, North America captured 38.5% of the market, with the US valued at USD 156.7 million and recording a CAGR of 17.04%, reflecting strong enterprise investment in observability platforms.
Key Performance Statistics
- Organizations implementing observability practices report a 54% reduction in Mean Time to Resolution, improving service continuity and operational response.
- Teams with mature observability frameworks experience 64% fewer customer impacting incidents, strengthening reliability and user trust.
- Among teams applying AI within observability workflows, 78% report reduced maintenance time and 60% confirm faster root cause identification.
- By 2026, about 70% of organizations effectively using observability are expected to achieve lower decision latency through improved data visibility.
- Nearly two thirds of enterprises are projected to invest in automated data observability tools by 2026 to enhance data reliability and governance.
- Poor data quality and drift result in average annual losses of USD 12.9 million per organization, reflecting operational inefficiencies and missed opportunities.
- Companies allocate between 10% and 30% of their revenue to address data quality related challenges.
- By 2026, around 50% of enterprises operating distributed data architectures are expected to deploy data observability tools, compared with less than 20% in 2024.
- Approximately 92% of data leaders indicate that observability will become a central element of their data strategy within the next 1 to 3 years, reflecting long term commitment to monitoring and reliability.
By Component
Software and solution platforms represented 84.6% of adoption. Organizations prefer integrated analytical engines that correlate operational data streams and generate contextual insights. Automated interpretation allows abnormal behavior to be detected across applications, infrastructure, and databases without manual inspection. This improves operational awareness across digital services.
Correlation capabilities connect technical metrics with business transactions. Instead of isolated alerts, systems provide explanations describing service degradation and impact scope. Operational teams therefore act faster with clear diagnostic context. The process improves reliability and reduces operational uncertainty.
Unified platforms are replacing fragmented monitoring tools because siloed visibility limits analysis accuracy. Centralized analytics combines multiple telemetry sources into a single operational view. This increases diagnostic confidence across distributed architectures. Enterprises therefore adopt consolidated observability solutions for continuous operational insight.
For Instance, in October 2025, Datadog launched new software capabilities, including LLM observability in its platform. This adds monitoring for AI agents and workflows, unifying metrics, logs, and traces. It helps developers debug generative apps faster while scaling securely.
By Deployment Mode
Cloud based deployment held 87.3% share due to scalability requirements of telemetry analytics. Observability generates large volumes of operational data which require elastic processing capacity. Hosted infrastructure allows continuous ingestion and analysis during unpredictable workload changes. This ensures consistent monitoring performance across digital environments.
Modern systems operate across containers, APIs, and distributed services. Cloud environments allow telemetry from different locations to be analyzed collectively. This prevents blind spots across infrastructure boundaries. Operational teams gain full service visibility rather than partial infrastructure monitoring.
Centralized dashboards improve collaboration between engineering and operations teams. Shared access to analytics reduces communication delays during incident response. Continuous synchronization across environments supports proactive maintenance. As architectures grow more complex, hosted observability becomes operationally practical.
For instance, in November 2025, Microsoft Azure Monitor rolled out full-stack observability updates on its cloud platform. New AI agents and streamlined onboarding enable quick monitoring of VMs and containers across cloud setups. ITOps teams gain centralized dashboards for faster issue resolution.
By Organization Size
Large enterprises accounted for 76.8% of adoption. These organizations manage extensive service ecosystems with interdependent systems. Observability driven analytics provides real time visibility into service performance across complex dependencies. Without automated correlation, incident identification would be slow and inconsistent.
Enterprise operations integrate multiple internal and external platforms. Failures in one component may affect customer transactions across systems. Analytical observability identifies relationships between technical disruptions and operational outcomes. This protects service continuity.
Executive management also relies on measurable reliability indicators. Performance metrics derived from telemetry support operational governance and planning. As digital reliance increases, analytics based monitoring becomes a management necessity.
For Instance, in February 2026, Cisco expanded AgenticOps innovations for large enterprise networks. The rollout includes early detection across data centers and campuses, integrated with Splunk for deeper observability. It helps big firms automate resilience at scale.
By Application
Root cause analysis and incident forensics represented 44.2% of primary usage. Organizations require faster understanding of disruptions affecting user experience. Observability platforms reconstruct operational timelines to determine triggering conditions. This replaces manual inspection across separate monitoring tools.
Historical telemetry allows investigation of events preceding failures. Teams analyze behavior patterns instead of reacting to isolated alerts. The approach reduces recovery time and prevents repeated incidents. Continuous analysis improves long term stability.
Security investigations also benefit from detailed event reconstruction. Suspicious activity can be traced accurately across service layers. Operational accountability improves through evidence based diagnostics. This strengthens service assurance.
For Instance, in December 2025, New Relic deepens AWS integrations for root cause observability. Enhanced analytics across EC2 and Lambda pinpoint issues faster in cloud apps. DevOps gains visibility into metrics and logs, streamlining forensics in multi-cloud setups for quicker resolutions.
By End User Industry
The IT and telecommunications sector accounted for 52.7% of adoption. Service providers operate latency sensitive infrastructures where performance consistency is critical. Observability analytics monitors service availability, traffic flow, and latency conditions. This ensures customer service quality remains stable.
Telecommunication networks generate continuous event streams requiring real time interpretation. Analytical processing identifies abnormal traffic behavior and congestion patterns. Operators adjust configurations before widespread disruption occurs. Preventive maintenance improves operational reliability.
Customer experience monitoring integrates operational metrics with usage behavior. Service improvements can be prioritized based on actual performance impact. Observability analytics therefore becomes part of service management strategy.
For Instance, in August 2025, Elastic was named a Leader in Gartner Magic Quadrant for Observability Platforms. Its OpenTelemetry-native tools and ES|QL excel in IT/telecom for fast queries on petabyte data. The platform scales security and performance monitoring without retention trade-offs.
Regional Analysis
North America accounted for 38.5% share of adoption. The region demonstrates strong implementation of advanced operational monitoring due to widespread digital service ecosystems. Organizations prioritize continuous service assurance and operational intelligence across industries. Mature infrastructure and skilled workforce support broad integration of observability analytics.
The United States contributed USD 156.7 Mn with an estimated growth rate of 17.04% annually. Enterprises increasingly embed operational analytics into service management and reliability engineering practices. Strong focus on uptime commitments and user experience monitoring encourages ongoing investment. Adoption continues to expand as businesses rely on real time operational decision making.
For instance, in July 2025, IBM was named a Leader in the 2025 Gartner Magic Quadrant for Observability Platforms, highlighting Instana’s full-stack observability capabilities. In October 2025, IBM launched an integrated intelligent observability experience, unifying Instana, Turbonomic, and Concert with AI-driven insights for proactive operations. This demonstrates U.S. leadership in scalable, AI-powered observability solutions.
Driver Analysis
Growth of Complex Digital Infrastructure
Modern enterprises operate distributed applications, cloud platforms, and real-time services that generate massive operational signals. As systems grow interconnected, manual troubleshooting becomes ineffective and organizations require analytical visibility to understand behavior across components. Observability-driven analytics provides a continuous view of data flows and helps teams track performance dependencies.
The adoption is also driven by reliability expectations in always-available digital services. Faster anomaly detection and automated remediation enable organizations to prevent service disruptions before they affect users. Predictive insights derived from operational data allow infrastructure teams to shift from reactive repair toward preventive management.
Restraint Analysis
Data Volume and Operational Complexity
One restraint comes from the large volume of telemetry information generated by observability systems. Storing, processing, and analyzing this continuous stream requires specialized architecture and skilled management. Without proper design, analysis becomes laborious and operational costs increase.
Another limitation is the integration difficulty across teams and platforms. Multiple tools and fragmented workflows can create alert fatigue and inconsistent interpretation of analytics insights. Organizations often struggle to connect operational signals with business context, reducing the practical value of the analytics output.
Opportunity Analysis
Proactive Data Reliability and AI Operations
A major opportunity lies in using observability insights to ensure trustworthy analytics and automated decision systems. By detecting missing, late, or inconsistent data early, organizations can improve data quality and enable more accurate reporting and machine learning outcomes.
Another opportunity comes from predictive operations powered by intelligent analysis. Observability analytics can correlate system events and anticipate irregularities before incidents occur, enabling automation and operational efficiency improvements. This capability supports continuous digital service optimization across industries.
Challenge Analysis
Translating Signals into Business Value
A key challenge is interpreting technical telemetry into meaningful operational actions. Observability generates large quantities of signals, but identifying which insights truly matter requires analytical maturity and governance processes. Organizations must develop standardized frameworks to convert technical metrics into decision-ready intelligence.
Another challenge is maintaining security and compliance while analyzing operational data. Observability increasingly tracks behavior of advanced systems and data usage patterns, which introduces privacy and risk management responsibilities. Ensuring transparent and secure analysis remains essential for adoption in regulated environments.
Top Emerging Trends
One emerging trend is the integration of artificial intelligence into observability workflows. Analytical engines automatically detect anomalies, forecast failures, and recommend corrective actions based on operational behavior patterns. This transformation moves observability from monitoring toward autonomous operational intelligence.
Another trend is end-to-end visibility across the data lifecycle. Organizations increasingly monitor freshness, volume, lineage, and distribution of data to maintain analytical accuracy and trust. These multi-dimensional observations enable unified understanding of digital operations and analytics performance.
Customer Impact: Trends and Disruptors
For customers, the primary impact is improved service stability and faster problem resolution. When anomalies are detected early, outages and performance degradation are minimized, leading to more reliable digital experiences. Operational transparency also increases confidence in digital services.
Another disruptive effect is better decision quality through reliable data insights. Observability-driven analytics ensures information used in reporting and automation remains accurate and timely, which strengthens operational planning and customer engagement strategies.
Key Market Segments
By Component
- Software/Solutions
- Services
By Deployment Mode
- Cloud-based
- On-premises
By Organization Size
- Large Enterprises
- Small and Medium-sized Enterprises
By Application
- Root Cause Analysis and Incident Forensics
- Business Impact Analysis
- Anomaly Detection and Prediction
- Customer Experience and Digital Journey Analytics
- Others
By End-User Industry
- IT and Telecommunications
- Banking, Financial Services, and Insurance
- E-commerce and Retail
- Healthcare
- Others
Key Regions and Countries
North America
- US
- Canada
Europe
- Germany
- France
- The UK
- Spain
- Italy
- Russia
- Netherlands
- Rest of Europe
Asia Pacific
- China
- Japan
- South Korea
- India
- Australia
- Singapore
- Thailand
- Vietnam
- Rest of APAC
Latin America
- Brazil
- Mexico
- Rest of Latin America
Middle East & Africa
- South Africa
- Saudi Arabia
- UAE
- Rest of MEA
Key Players Analysis
Global cloud and enterprise technology providers such as IBM, Microsoft, Google, and Amazon Web Services lead the observability-driven analytics market. Their platforms integrate logs, metrics, and traces into unified analytics environments. Advanced AI models support predictive insights and automated remediation. These vendors benefit from strong enterprise adoption and scalable cloud ecosystems. Demand is driven by digital transformation and complex multi-cloud architectures.
Dedicated observability providers such as Datadog, Splunk, Dynatrace, New Relic, Elastic, and Sumo Logic focus on real-time event analytics and anomaly detection. LogicMonitor strengthens hybrid monitoring capabilities. Adoption is strong among enterprises seeking improved operational resilience and faster root cause analysis.
Emerging and security-focused vendors such as Honeycomb, Lightstep, CrowdStrike, and Cisco expand analytics into security and network observability domains. These players emphasize high-cardinality data analysis and threat detection. Other vendors enhance innovation and regional presence, supporting steady growth of observability-driven analytics across enterprise IT environments.
Top Key Players in the Market
- IBM
- Microsoft
- Amazon Web Services
- Cisco
- LogicMonitor
- Datadog
- Splunk
- Dynatrace
- New Relic
- Elastic
- Sumo Logic
- Honeycomb
- Lightstep
- CrowdStrike
- Others
Recent Developments
- In March 2025, Dynatrace acquired Metis to revolutionize database observability with AI-powered troubleshooting. This fills a key gap for DevOps teams, combining Metis’ database expertise with Dynatrace’s Davis AI for end-to-end stack visibility. Faster issue resolution and optimization will be a game-changer for cloud-native apps.
- In November 2025, Microsoft unveiled the Azure Copilot observability agent at Ignite 2025, introducing agentic AI for full-stack troubleshooting in Azure Monitor. It automates root cause analysis across infrastructure and apps, cutting manual effort dramatically. This innovation cements Microsoft’s edge in AI-native observability for hybrid environments.
Report Scope
Report Features Description Market Value (2025) USD 452.3 Million Forecast Revenue (2035) USD 2,428.1 Million CAGR(2025-2035) 18.3% Base Year for Estimation 2024 Historic Period 2020-2024 Forecast Period 2025-2035 Report Coverage Revenue forecast, AI impact on Market trends, Share Insights, Company ranking, competitive landscape, Recent Developments, Market Dynamics and Emerging Trends Segments Covered By Component (Software/Solutions, Services), By Deployment Mode (Cloud-based, On-premises), By Organization Size (Large Enterprises, Small and Medium-sized Enterprises), By Application (Root Cause Analysis and Incident Forensics, Business Impact Analysis, Anomaly Detection and Prediction, Customer Experience and Digital Journey Analytics, Others), By End-User Industry (IT and Telecommunications, Banking, Financial Services, and Insurance, E-commerce and Retail, Healthcare, Others) Regional Analysis North America – US, Canada; Europe – Germany, France, The UK, Spain, Italy, Russia, Netherlands, Rest of Europe; Asia Pacific – China, Japan, South Korea, India, New Zealand, Singapore, Thailand, Vietnam, Rest of Latin America; Latin America – Brazil, Mexico, Rest of Latin America; Middle East & Africa – South Africa, Saudi Arabia, UAE, Rest of MEA Competitive Landscape IBM, Microsoft, Google, Amazon Web Services, Cisco, LogicMonitor, Datadog, Splunk, Dynatrace, New Relic, Elastic, Sumo Logic, Honeycomb, Lightstep, CrowdStrike, Others Customization Scope Customization for segments, region/country-level will be provided. Moreover, additional customization can be done based on the requirements. Purchase Options We have three license to opt for: Single User License, Multi-User License (Up to 5 Users), Corporate Use License (Unlimited User and Printable PDF)  Observability-Driven Analytics MarketPublished date: Feb. 2026add_shopping_cartBuy Now get_appDownload Sample
 -
-
- IBM
- Microsoft
- Amazon Web Services
- Cisco
- LogicMonitor
- Datadog
- Splunk
- Dynatrace
- New Relic
- Elastic
- Sumo Logic
- Honeycomb
- Lightstep
- CrowdStrike
- Others
Our Clients
- 177906
- Feb. 2026


