
Global Non-Gmo Food Market Size, Share Analysis Report By Product Type (Cereals and Grains, Liquor, Meat and Poultry, Bakery Products, Edible Oils, Others), By Application (Beverages, Meat Products, Fruits and Vegetables, Dairy Alternatives, Animal Feed, Others), By Distribution Channel (Food Service, Supermarkets and Hypermarkets, Convenience Stores, Online Stores, Others), By Region and Companies - Industry Segment Outlook, Market Assessment, Competition Scenario, Trends and Forecast 2026-2035
- Published date: Mar 2026
- Report ID: 181490
- Number of Pages: 318
- Format:
-
keyboard_arrow_up
Quick Navigation
Report Overview
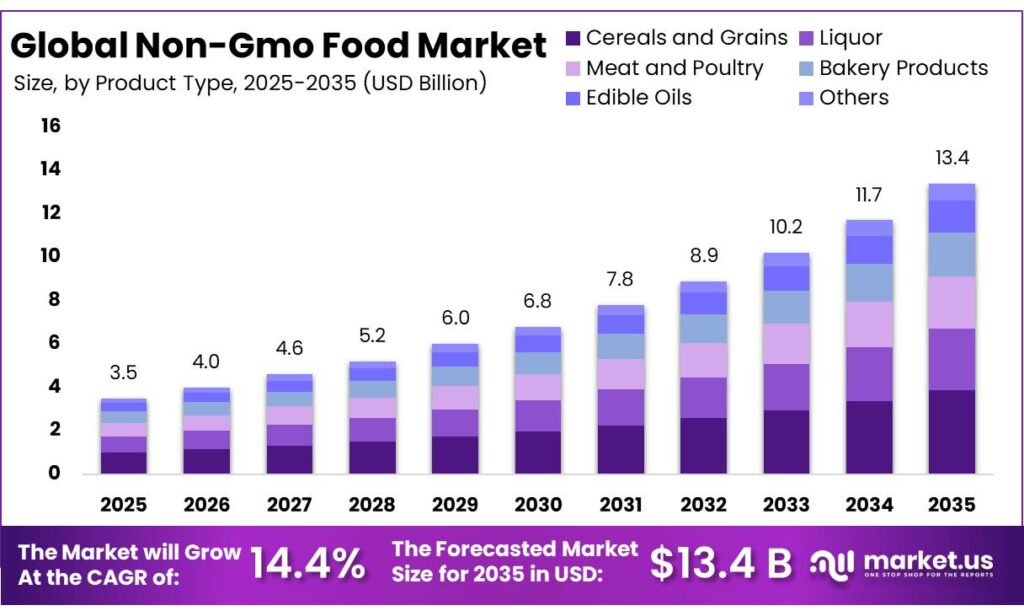
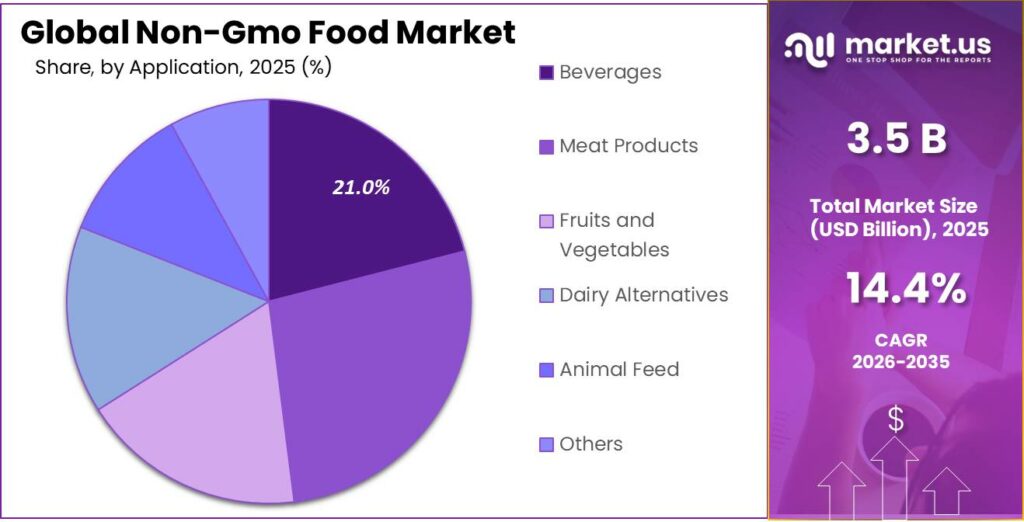
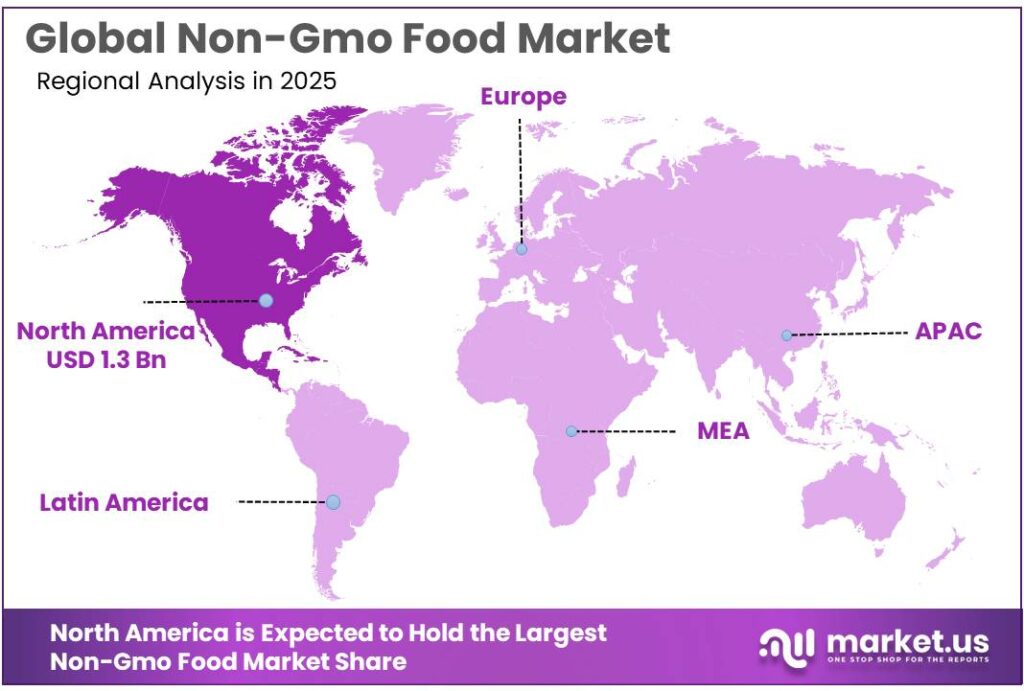
The Global Non-Gmo Food Market size is expected to be worth around USD 13.4 Billion by 2035, from USD 3.5 Billion in 2025, growing at a CAGR of 14.4% during the forecast period from 2026 to 2035. In 2025, North America held a dominant market position, capturing more than a 39.6% share, holding USD 1.3 billion revenue.
The non-GMO food industry represents a premium yet increasingly mainstream segment of the broader packaged food and fresh produce economy, shaped by consumer preference for ingredient transparency, traceability, and simplified formulations. In the United States, the category benefits from a strong overlap with organic purchasing: USDA data show that U.S. certified or exempt organic product sales reached $9.6 billion in 2022, while USDA ERS also reports that produce accounted for 33% of U.S. organic food sales in 2024.
The supply-side contrast remains significant, because USDA ERS states that more than 90% of U.S. corn, soybean, and upland cotton acreage is produced with genetically engineered varieties, including roughly 92% of corn acreage and 96% of soybean acreage in the latest data. That structural gap between highly engineered commodity agriculture and consumer demand for identity-preserved foods continues to create a durable commercial space for non-GMO offerings.
The current industry scenario remains favorable because adjacent “better-for-you” categories continue to expand. The Organic Trade Association reported that U.S. organic sales reached $71.6 billion in 2024, up 5.2% year over year, and then accelerated to $76.6 billion in 2025, with 6.8% annual growth versus 3.4% for the comparable marketplace. USDA’s ERS also notes that organic food sales reached $65.4 billion in 2024 in inflation-adjusted terms, with produce accounting for 33% of U.S. organic food sales that year.
The principal growth drivers are clear. labeling visibility matters: the Non-GMO Project says the USDA has estimated that up to 70% of packaged foods contain GMOs or GMO derivatives, which keeps avoidance claims commercially relevant. Product economics are becoming more accessible: as of August 1, 2025, the Non-GMO Project verification fee for most products was $115, lowering the barrier for branded CPG participation.
Public-sector support is improving supply depth. USDA’s Organic Transition Initiative is a $300 million effort, TOPP is investing up to $100 million over 5 years, and USDA’s Organic Market Development Grant program is designed to expand domestic organic processing and market capacity. Together, these initiatives improve ingredient availability and strengthen the upstream ecosystem on which non-GMO food brands depend.
In 2025: Hain Celestial reported $1.56 billion in fiscal 2025 net sales, highlighting continued portfolio recalibration in natural foods.
Key Takeaways
- Non-Gmo Food Market size is expected to be worth around USD 13.4 Billion by 2035, from USD 3.5 Billion in 2025, growing at a CAGR of 14.4%.
- Cereals and Grains held a dominant market position, capturing more than a 29.5% share.
- Meat Products held a dominant market position, capturing more than a 26.8% share.
- Supermarkets and Hypermarkets held a dominant market position, capturing more than a 44.2% share.
- North America clearly stands as the dominating region in the non-GMO food market, accounting for approximately 39.6% market share, valued at around USD 1.3 billion.
By Product Type Analysis
Cereals and Grains dominate with 29.5% due to everyday consumption an strong clean-label demandd
In 2025, Cereals and Grains held a dominant market position, capturing more than a 29.5% share. This segment continues to lead the non-GMO food market because it forms a staple part of daily diets across both developed and developing regions. Consumers are increasingly choosing non-GMO variants of basic foods such as rice, wheat, oats, cornmeal, and breakfast cereals, mainly due to rising awareness around food safety and ingredient transparency. The shift is especially visible in urban households, where buyers are reading labels more carefully and preferring products that are perceived as natural and minimally processed.
By Application Analysis
Meat Products lead with 26.8% as consumers prefer clean-label and responsibly sourced protein
In 2025, Meat Products held a dominant market position, capturing more than a 26.8% share. This segment has gained strong traction as consumers are paying closer attention to how their meat is produced, especially in terms of animal feed and overall farming practices. Non-GMO meat products are typically linked with livestock raised on non-GMO feed, which appeals to buyers looking for more natural and transparent food options. This preference is particularly noticeable in urban and premium retail markets, where customers are willing to spend more on quality and traceability.
By Distribution Channel Analysis
Supermarkets and Hypermarkets dominate with 44.2% as they offer wide product choice and easy access
In 2025, Supermarkets and Hypermarkets held a dominant market position, capturing more than a 44.2% share. This channel continues to lead as it gives consumers the convenience of finding a wide range of non-GMO food products under one roof. From cereals and snacks to fresh produce and meat, these stores provide clear labeling and organized sections that make it easier for shoppers to identify non-GMO options. Many large retail chains have also introduced dedicated shelves or tags for clean-label and non-GMO products, which has improved product visibility and boosted sales.
Key Market Segments
By Product Type
- Cereals and Grains
- Liquor
- Meat and Poultry
- Bakery Products
- Edible Oils
- Others
By Application
- Beverages
- Meat Products
- Fruits and Vegetables
- Dairy Alternatives
- Animal Feed
- Others
By Distribution Channel
- Food Service
- Supermarkets and Hypermarkets
- Convenience Stores
- Online Stores
- Others
Emerging Trends
Rise of Clean-Label and Transparency Movement in Non-GMO Food
One of the most noticeable trends in the non-GMO food space today is the growing shift toward clean-label and transparent food choices. Consumers are no longer just picking food based on taste or price — they want to know what goes into their food and where it comes from. This change is very real and backed by numbers. According to the Non-GMO Project, nearly 70% of packaged foods in grocery stores still contain GMOs, which has pushed many consumers to actively look for verified non-GMO alternatives.
Government efforts are also supporting this shift. The U.S. introduced the National Bioengineered Food Disclosure Standard, which makes it mandatory for companies to disclose genetically modified ingredients. This kind of policy is slowly making consumers more aware and encouraging food brands to adopt non-GMO positioning to stay competitive.
Expansion of Non-GMO into Everyday and Functional Foods
Another important trend shaping the industry is how non-GMO food is moving beyond niche organic stores into everyday food categories. Earlier, non-GMO products were mostly limited to specialty shelves, but today they are becoming part of regular diets — from snacks and cereals to beverages and ready-to-eat meals. This shift is clearly supported by market numbers. The global non-GMO food sector reached around USD 836.35 billion in 2025 and is expected to grow significantly in the coming years as demand spreads across mainstream consumption.
Food companies are adapting quickly to this shift. For example, Blue Diamond Growers is expanding almond-based snacks, Clif Bar & Company is innovating in performance nutrition, and Chiquita Brands is strengthening its natural fruit positioning. These companies are not just offering “non-GMO” as a label — they are combining it with protein content, functional benefits, and convenience.
Drivers
Rising Consumer Shift Toward Clean and Transparent Food Choices
One of the biggest driving factors for the non-GMO food market is the growing consumer demand for clean, transparent, and naturally sourced food. Over the past few years, people have become more aware of what goes into their food, and this has directly influenced buying habits. In 2025, this shift became even more visible as consumers actively looked for labels such as “non-GMO,” “organic,” and “free from artificial ingredients.” According to the Organic Trade Association, U.S. organic product sales reached $76.6 billion in 2025, growing at a faster pace than the overall food market, clearly showing that people are willing to spend more on food they trust
Government-backed labeling initiatives have also played an important role. For example, in the United States, the National Bioengineered Food Disclosure Standard requires food companies to clearly indicate bioengineered ingredients. This has increased transparency and indirectly supported the demand for non-GMO alternatives. Certification bodies such as the Non-GMO Project have also helped build trust by verifying products and making it easier for consumers to identify them on shelves. Overall, this growing focus on clean eating and label clarity continues to push the non-GMO food market forward in a steady and natural way.
Expansion of Organic and Sustainable Agriculture Supporting Non-GMO Demand
Non-GMO products are often closely linked with organic farming because organic standards do not allow genetically modified inputs. As organic farming grows, the demand for non-GMO ingredients naturally increases alongside it. According to USDA-supported data, U.S. organic food sales have shown strong long-term growth, increasing from $65.4 billion in 2024 (inflation-adjusted) and continuing upward into 2025, reflecting steady consumer demand for natural food systems
In 2025 and moving into 2026, this connection between sustainability and non-GMO food is becoming even stronger. Consumers are no longer just looking at health benefits—they are also thinking about environmental impact. This is pushing food companies to invest in traceable supply chains and responsibly sourced ingredients. As a result, non-GMO food is not just a niche preference anymore; it is becoming part of a broader movement toward sustainable and ethical food production, which is expected to keep driving the market in the coming years.
Restraints
High Production and Supply Chain Costs Limiting Wider Adoption
One of the major restraining factors for the non-GMO food market is the higher cost involved in production, certification, and supply chain management. Unlike conventional food systems, non-GMO production requires strict segregation of crops, identity preservation, and careful monitoring at every stage—from farming to processing and distribution. This adds extra operational complexity and cost for farmers and manufacturers. According to the Non-GMO Project, the base product verification fee was set at $115 starting August 2025, reflecting the growing infrastructure required to maintain certification standards.
Government regulations, while promoting transparency, also add to compliance costs. For example, the United States Department of Agriculture enforces the National Bioengineered Food Disclosure Standard, which requires food companies to manage labeling and documentation carefully. While this improves consumer awareness, it also increases administrative and operational burdens for producers. Overall, the cost factor remains a key limitation, slowing down the adoption of non-GMO products across mass-market segments despite growing interest.
Limited Scalability and Supply Constraints in Non-GMO Farming
Another important restraint is the limited scalability of non-GMO farming compared to conventional genetically modified agriculture. Large-scale food production today heavily relies on GMO crops due to their higher yield, pest resistance, and efficiency. According to the United States Department of Agriculture, in 2025 genetically engineered crops accounted for 96% of soybean acreage and around 92% of corn acreage in the U.S., showing how dominant GMO farming has become.
In 2025, This gap between supply and demand continues to affect pricing and availability. Food companies may struggle to maintain consistent supply chains, especially when demand rises quickly. While government and agricultural initiatives are encouraging diversification and sustainable practices, the transition takes time and investment. Until non-GMO farming becomes more scalable and economically competitive, supply constraints will continue to act as a key barrier for the overall growth of the non-GMO food market.
Opportunity
Expansion of Clean-Label and Premium Food Segments Creating New Opportunities
One of the strongest growth opportunities in the non-GMO food market is the rapid expansion of clean-label and premium food categories. Consumers today are not just looking for food—they are looking for trust, quality, and transparency. This shift is opening up new space for non-GMO products across snacks, beverages, baby food, and ready-to-eat meals. In 2025, the global non-GMO food market was valued at around USD 168.35 billion, showing how large this opportunity has already become and how fast it is expanding
Government-backed labeling rules have also supported this opportunity. For example, the United States Department of Agriculture requires clear disclosure of bioengineered ingredients, which has made non-GMO alternatives more visible and easier to identify. This has pushed retailers and brands to expand their non-GMO portfolios. As we move into 2026, the clean-label trend is expected to go even deeper, with more innovation in minimally processed foods. This creates a long-term opportunity for companies that can combine non-GMO sourcing with taste, convenience, and affordability.
Growing Demand for Sustainable and Traceable Food Systems
Another major opportunity lies in the rising focus on sustainability and traceability in the global food system. Consumers are no longer thinking only about personal health—they are also considering how food impacts the environment. Non-GMO food is often linked with traditional farming methods and reduced chemical use, which makes it attractive to environmentally conscious buyers. In 2025, the overall non-GMO food market continued to grow strongly, with projections showing expansion to nearly USD 184.04 billion in 2026, highlighting steady demand for such products
In addition, several governments are promoting sustainable agriculture through policies and awareness programs. These efforts are helping farmers transition toward non-GMO and organic practices, especially in regions where environmental concerns are rising. By 2026, this combination of sustainability, traceability, and transparency is expected to create strong opportunities for brands that can prove the origin and quality of their ingredients. As a result, non-GMO food is becoming part of a bigger movement toward responsible and ethical food production, giving the market a solid path for future growth.
Regional Insights
North America Non-GMO Food Market Dominating Region – 39.6%, USD 1.3 Bn
North America clearly stands as the dominating region in the non-GMO food market, accounting for approximately 39.6% market share, valued at around USD 1.3 billion, supported by strong consumer awareness, well-established certification systems, and advanced retail infrastructure. The region’s leadership is further validated by multiple industry sources, where North America held around 40.43% share in 2025, reflecting its consistent dominance in the global landscape.
Another key factor supporting North America’s dominance is its highly developed regulatory and certification ecosystem. The implementation of the National Bioengineered Food Disclosure Standard has increased labeling transparency, indirectly encouraging food manufacturers to adopt non-GMO positioning as a competitive advantage. In addition, organizations like the Non-GMO Project have significantly expanded product visibility, making certified products widely available across supermarkets, specialty stores, and e-commerce platforms.
Key Regions and Countries Insights
- North America
- US
- Canada
- Europe
- Germany
- France
- The UK
- Spain
- Italy
- Rest of Europe
- Asia Pacific
- China
- Japan
- South Korea
- India
- Australia
- Rest of APAC
- Latin America
- Brazil
- Mexico
- Rest of Latin America
- Middle East & Africa
- GCC
- South Africa
- Rest of MEA
Key Players Analysis
Amy’s Kitchen is a leading organic and non-GMO food company with a strong presence in North America. The company offers over 250 vegetarian and organic products, many of which are Non-GMO Project Verified. Amy’s operates in more than 25 countries and maintains a vertically integrated production model. It has over 2,700 employees supporting its operations. The brand benefits from growing organic demand, with the U.S. organic food market reaching USD 71.6 billion in 2024.
Blue Diamond Growers is one of the world’s largest almond processors, representing over 3,000 growers primarily in California. The company processes more than 80% of California’s almond crop, a key non-GMO ingredient segment. Its products are distributed in over 100 countries, with a strong focus on plant-based and non-GMO snacks. California alone produced about 2.6 billion pounds of almonds in 2023.
Chiquita Brands is a global leader in fresh produce, especially bananas, operating in over 70 countries. The company supplies approximately 100 billion bananas annually worldwide, making it a major contributor to natural and non-GMO fruit consumption. Bananas are naturally non-GMO, which aligns with clean-label trends. Global banana production reached about 125 million metric tons in 2023.
Top Key Players Outlook
- Amy’s Kitchen Inc.
- Blue Diamond Growers
- Clif Bar & Company
- Chiquita Brands International Sarl
- The Hain Celestial Group Inc.
- Nature’s Path Foods Inc.
- Now Health Group Inc.
- Organic Valley
- United Natural Foods Inc.
Recent Industry Developments
In 2025, Clif Bar & Company continued product innovation, launching new variants like Cookies & Crème bars with 11 g plant protein, targeting active consumers and fitness-focused buyers.
In 2025, Chiquita also focused on expanding production capacity, announcing a USD 30 million investment in Panama to restart operations and generate nearly 5,000 jobs by 2026, showing its long-term commitment to supply chain stability and growth.
Report Scope
Report Features Description Market Value (2025) USD 3.5 Bn Forecast Revenue (2035) USD 13.4 Bn CAGR (2026-2035) 14.4% Base Year for Estimation 2025 Historic Period 2020-2024 Forecast Period 2026-2035 Report Coverage Revenue Forecast, Market Dynamics, Competitive Landscape, Recent Developments Segments Covered By Product Type (Cereals and Grains, Liquor, Meat and Poultry, Bakery Products, Edible Oils, Others), By Application (Beverages, Meat Products, Fruits and Vegetables, Dairy Alternatives, Animal Feed, Others), By Distribution Channel (Food Service, Supermarkets and Hypermarkets, Convenience Stores, Online Stores, Others) Regional Analysis North America – US, Canada; Europe – Germany, France, The UK, Spain, Italy, Rest of Europe; Asia Pacific – China, Japan, South Korea, India, Australia, Singapore, Rest of APAC; Latin America – Brazil, Mexico, Rest of Latin America; Middle East & Africa – GCC, South Africa, Rest of MEA Competitive Landscape Amy’s Kitchen Inc., Blue Diamond Growers, Clif Bar & Company, Chiquita Brands International Sarl, The Hain Celestial Group Inc., Nature’s Path Foods Inc., Now Health Group Inc., Organic Valley, United Natural Foods Inc. Customization Scope Customization for segments, region/country-level will be provided. Moreover, additional customization can be done based on the requirements. Purchase Options We have three licenses to opt for: Single User License, Multi-User License (Up to 5 Users), Corporate Use License (Unlimited User and Printable PDF) 
-
-
- Amy's Kitchen Inc.
- Blue Diamond Growers
- Clif Bar & Company
- Chiquita Brands International Sarl
- The Hain Celestial Group Inc.
- Nature's Path Foods Inc.
- Now Health Group Inc.
- Organic Valley
- United Natural Foods Inc.
Our Clients
- 181490
- Mar 2026


