Report Overview
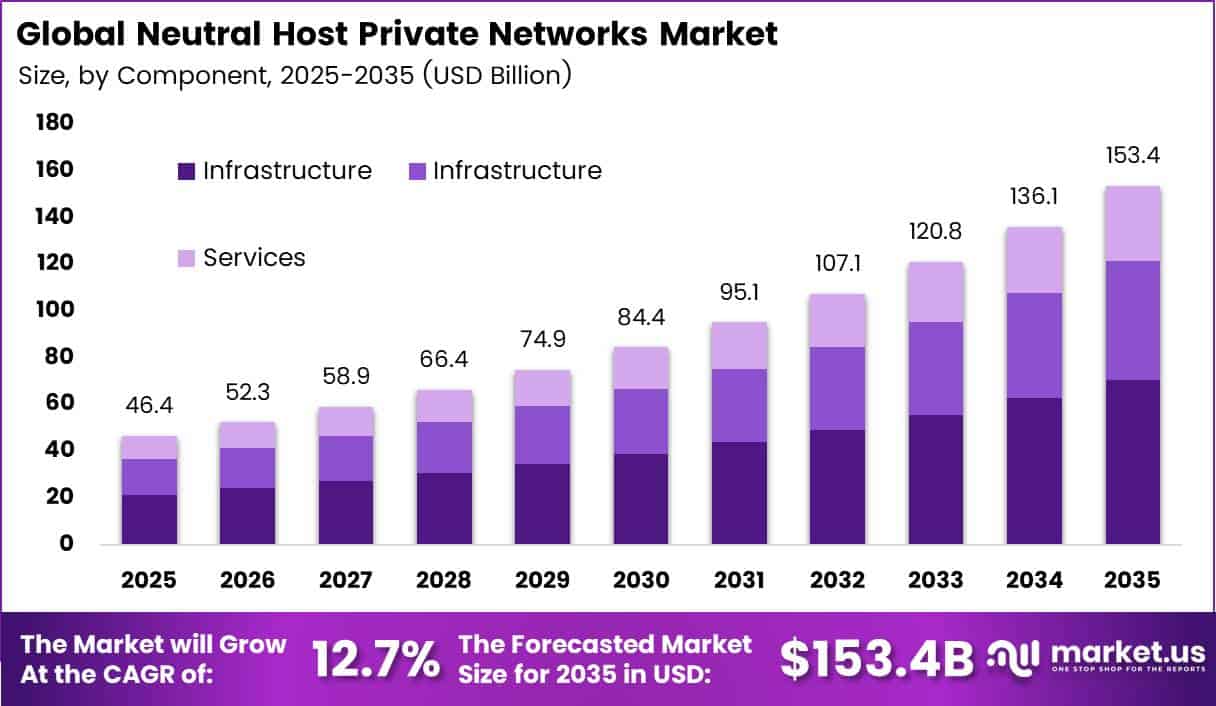
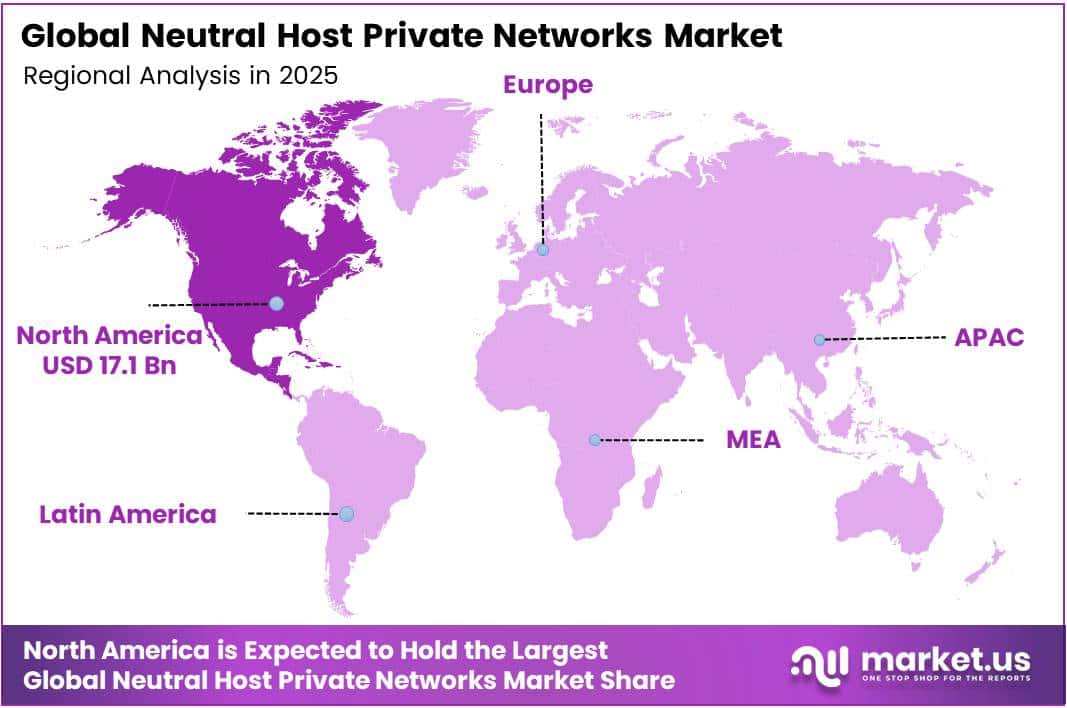
In 2025, the Global Neutral Host Private Networks Market was valued at USD 46.4 billion. The market is projected to grow at a CAGR of 12.7% during 2026–2035, reaching approximately USD 153.4 billion by 2035. North America dominated the global market in 2025, accounting for more than 36.8% of the total market share and generating approximately USD 17.1 billion in revenue.
Rising data use drives this growth. According to the ITU, about 6 billion people used the Internet in 2025, up from 5.8 billion in 2024. That means more than 240 million new users came online in a single year. The ITU also reported that 5G subscriptions reached about 3 billion, or one-third of all mobile broadband subscriptions.
5G networks now cover 55% of the world’s population. Dense 5G traffic needs many more radio points inside buildings, stadiums, and campuses. Venue owners now pay for one shared network that serves every carrier, so they don’t have to build a separate system for each operator. This shift pushes demand toward neutral host models.
The North America region’s high-income profile supports early adoption. The ITU reported that 5G reaches 84% of people in high-income countries but only 4% in low-income countries, an almost 20-fold gap. Strong 5G coverage creates heavy indoor traffic, which in turn creates demand for shared in-building systems. US tower and small cell owners also hold large asset bases and long-term carrier contracts.
Key Takeaways
- The Neutral Host Private Networks Market reached USD 46.4 billion in 2025 and will hit USD 153.4 billion by 2035. at a CAGR of 12.7% from 2026 to 2035.
- By Component, Infrastructure led with a 46.1% share.
- By Technology, Small Cells led with a 34.2% share.
- By Spectrum, Licensed Spectrum led with a 42.3% share.
- By Ownership Model, the Single-Operator Model led with a 62.5% share.
- By Deployment Mode, Indoor Networks led with a 46.2% share.
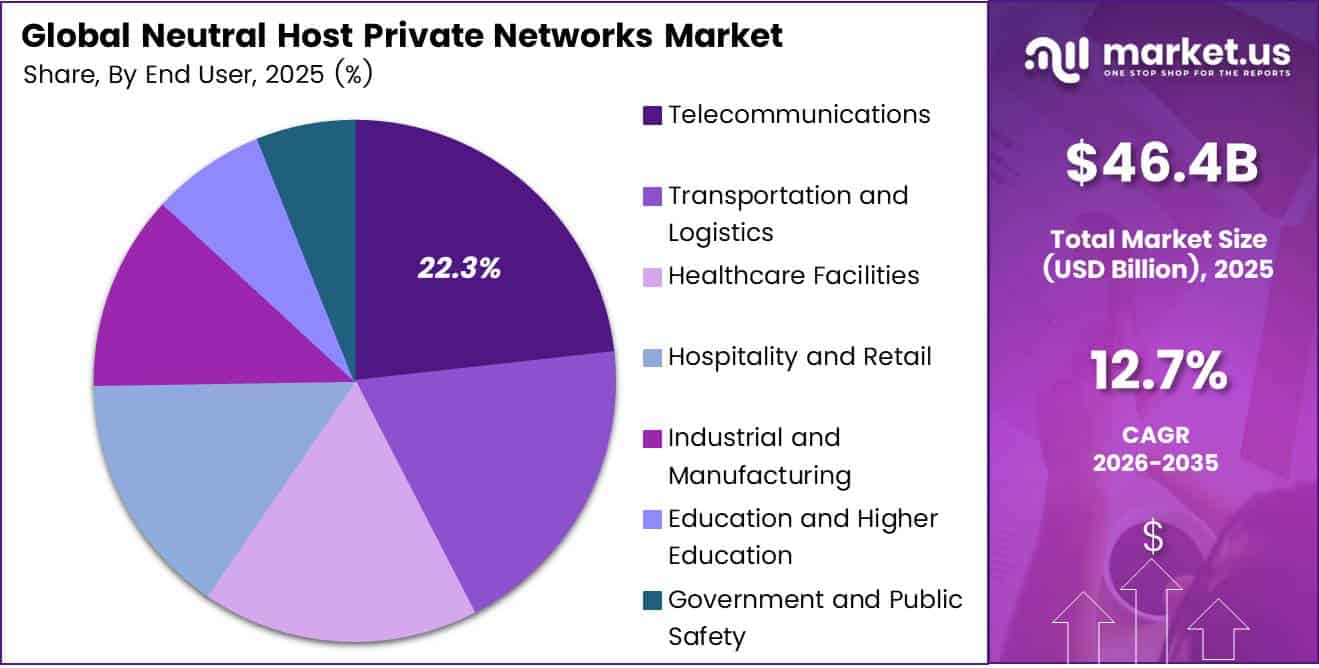
- By End User Industry, Telecommunications led with a 22.3% share.
- North America led with a 36.8% share and USD 17.1 billion in revenue.
By Component
Infrastructure dominates with 46.1% due to essential antenna and small cell hardware.
Infrastructure leads because every neutral host network starts with physical equipment. Venue owners must buy antennas, small cells, radios, and cabling before any service or software can run. The ITU reports that global 5G subscriptions reached 3 billion in 2025, which is about one-third of all mobile broadband connections.
The ITU also notes that 5G networks now cover 55% of the world’s population. As a result, many more sites will move from construction into daily operation, and each live site creates steady service demand. Providers like this model because support contracts bring regular, predictable revenue. Buyers like it because it turns a large upfront risk into a fixed monthly cost they can plan around.
By Technology
Small Cells dominate with 34.2% due to low-cost, dense indoor coverage capacity.
Small cells lead because they give strong coverage in crowded places at a lower cost than large towers or full antenna systems. Operators can mount them on ceilings, walls, and street poles, which helps them reach users quickly. An FCC advisory working group reported about 270,000 CBRS base stations in the United States, managed by six FCC-approved spectrum access systems.
Open Radio Access Network grows the fastest because it lets neutral hosts mix radios and software from different vendors. This breaks vendor lock-in, cuts equipment costs, and lets one shared network serve several carriers more easily. Buyers now treat open interfaces as a key factor in purchasing decisions.
By Spectrum
Licensed Spectrum dominates with 42.3% due to guaranteed interference-free carrier-grade service quality.
Licensed spectrum leads because mobile carriers still carry most public traffic, and they want neutral hosts to extend their own licensed bands into venues. Licensed bands give exclusive use, so users get clear calls, steady data speeds, and reliable emergency access. Large venues such as arenas and airports usually ask for licensed carrier signals first, since visitors expect their normal phone service to work everywhere.
Shared spectrum grows the fastest because it removes the high cost of buying exclusive licenses. In the United States, the CBRS band offers 150 MHz of spectrum in the 3.5 GHz range. The U.S. Navy and commercial users share it through an automated access system. Schools, cities, hospitals, and businesses can now run their own cellular networks at a local scale.
NCTA reports that more than 440,000 CBRS devices are now deployed nationwide, and about 75% of U.S. private networks run on CBRS. Most users rely on the General Authorized Access tier, which only requires FCC registration and charges no license fee. This low entry cost draws many new venue owners into neutral host projects.
By Ownership Model
Single-Operator Model dominates with 62.5% due to simpler contracts and faster rollout.
The single-operator model leads because a venue owner only has to deal with one carrier. Contracts are shorter, testing is simpler, and the network can go live faster. The OnGo Alliance reported 187 certified CBRS base station models and 496 certified end-user devices, so single-operator buyers have plenty of ready-made equipment to choose from.
Coverage gaps add more pressure to share. The ITU shows that 5G coverage reaches 86% of people in high-income countries but only 4% in low-income countries. Shared, multi-operator networks help carriers reach places that a single carrier could not afford to cover alone, especially new markets and rural sites.
By Deployment Mode
Indoor Networks dominate with 46.2% due to weak signal inside modern buildings.
Indoor networks lead because most mobile data use happens inside buildings, where thick walls and energy-saving glass block outdoor signals. Offices, malls, and hospitals need dedicated indoor systems to keep calls and data working. The ITU reports that mobile data use per subscription reaches 20 GB in high-income countries, about six times the 3.4 GB used in low-income countries.
Hybrid indoor-outdoor networks grow the fastest because large sites now cover both open spaces and enclosed spaces. Airports, ports, stadiums, and university campuses need one network that follows users from parking lots to terminals without dropping the connection. A single hybrid design also cuts the work and cost of running two separate systems.
Air travel shows how big this need is. The Bureau of Transportation Statistics reports that the top 20 U.S. airports handled 559.7 million of all 978.5 million passengers in 2025. Hubs at this scale need seamless coverage across curbs, gates, aprons, and cargo areas, which drives demand for hybrid neutral host builds.
By End User Industry
Telecommunications dominates with 22.3% due to carriers outsourcing costly network densification work.
Telecommunications leads because mobile carriers are the main buyers of neutral host capacity. Carriers must add many small sites to handle 5G traffic, but building each one alone costs too much. Neutral hosts let carriers rent shared capacity rather than own every antenna, which saves money and speeds up launches.
Transportation and logistics grow the fastest because airports, rail stations, and ports need reliable wireless for both passengers and operations. Staff use connected tools for baggage, cargo tracking, safety, and ground handling. The FAA serves more than 45,000 flights and 2.9 million airline passengers on an average day, and this level of activity puts heavy demand on coverage in terminals and airfields.
Healthcare adds steady demand alongside transport. The American Hospital Association counts 6,100 hospitals in the United States, and each one needs strong indoor signal for staff phones, patient devices, and medical equipment. Together, these sectors push providers toward shared, high-capacity networks.
Key Market Segments
By Component
- Infrastructure
- Distributed Antenna System Infrastructure
- Small Cell Infrastructure
- Wireless Network Hardware
- Cloud-Based Network Infrastructure
- In-Building Connectivity Infrastructure
- Services
- Network Deployment Services
- Managed Connectivity Services
- Network Design and Planning Services
- Integration and Installation Services
- Maintenance and Support Services
- Software
- Network Management Software
- Network Monitoring Software
- Security Management Software
- Cloud Network Orchestration Software
- Data Analytics and Optimization Software
By Technology
- Distributed Antenna System
- Small Cells
- Wireless Fidelity
- Open Radio Access Network
- Other
By Spectrum
- Licensed Spectrum
- Shared Spectrum
- Unlicensed Spectrum
By Ownership Model
- Single-Operator Model
- Multi-Operator Model
By Deployment Mode
- Indoor Networks
- Outdoor Networks
- Hybrid Indoor-Outdoor Networks
By End User Industry
- Telecommunications
- Transportation and Logistics
- Healthcare Facilities
- Hospitality and Retail
- Industrial and Manufacturing
- Education and Higher Education
- Government and Public Safety
- Commercial Real Estate and Offices
Geopolitical Impact Analysis
US and China trade tensions directly raise the cost of radios, antennas, and small cell hardware. In April 2025, US reciprocal tariffs on Chinese goods climbed to 125%, on top of an existing 20% duty on all Chinese imports. China answered with a 125% tariff on US goods. The US exempted semiconductor devices from the reciprocal tariffs. However, many finished antenna and enclosure parts did not get the same relief.
These tariffs hit neutral host builders hard because Chinese plants supply a large share of radio units, fiber cables, and power modules. A small cell kit that pays a 145% combined duty can more than double in landed cost. As a result, US integrators now shift orders to suppliers in Finland, Sweden, and South Korea. Huawei faces the steepest limits in Western bids, which hands share to Nokia and Ericsson.
Shipping disruption adds delays and cost. UNCTAD reported that Suez Canal tonnage stayed 70% below its 2023 average through May 2025. Cape of Good Hope arrivals rose 89% by mid-2024. UNCTAD notes that ships that once crossed the Red Sea in days now sail for weeks around Africa. This longer route slows Asian antenna and cable shipments to European venue projects.
Rerouting also distorts trade volumes. UNCTAD found that ton-miles grew a record 6% in 2024, nearly three times faster than the 2.2% growth in seaborne trade volumes. Freight rates now swing sharply from month to month. Neutral host firms respond by keeping more stock of distributed antenna system parts and buying closer to project sites.
Regional Analysis
North America dominates the Neutral Host Private Networks Market, holding a 36.8% share and generating USD 17.1 billion in revenue. The US drives most of this value. Its carriers, tower firms, and venue owners all invest heavily in shared indoor and outdoor networks. Urban demand is the main growth engine.
The ITU reported that in high-income countries, 5G covers 89% of urban residents but only 59% of rural residents. Dense cities create heavy traffic inside offices, transit hubs, and arenas. Outdoor macro towers can’t serve these spaces well, so venue owners turn to small cells and distributed antenna systems. Small cell assets show the scale of the region’s base.
Asia Pacific is the fastest-growing region in the Neutral Host Private Networks Market. China, Japan, and South Korea lead 5G rollouts, and India adds fast subscriber growth. The ITU reported that 5G coverage in Asia Pacific rose from 70% of the population in 2025 to 73% in its latest update. That wide coverage creates large indoor traffic loads in malls, metro systems, and factories.
Europe holds a strong position, backed by the highest 5G coverage of any region. The ITU reported that 5G coverage in Europe grew from 74% to 78% of the population. Germany, France, the UK, Spain, and Italy lead in industrial private networks and shared tower assets. Spain hosts Cellnex, which operates a pan-European neutral host portfolio.
Key Regions and Countries
North America
- US
- Canada
Europe
- Germany
- France
- The UK
- Spain
- Italy
- Rest of Europe
Asia Pacific
- China
- Japan
- South Korea
- India
- Australia
- Rest of APAC
Latin America
- Brazil
- Mexico
- Rest of Latin America
Middle East and Africa
- GCC
- South Africa
- Rest of MEA
Market Dynamics
Drivers
| Driver | (~) % Impact on CAGR Forecast | Geographic Relevance | Impact Timeline |
|---|---|---|---|
| Shared Mid-Band Spectrum Liberalization (CBRS, UK Shared Access) | +2.4% | North America, UK, Europe | Short term (2 years or less) |
| Indoor 5G Coverage Deficit in Enterprise Venues | +1.9% | Global | Short term (2 years or less) |
| MNO Capex Rationalization & Infrastructure Sharing | +1.6% | Europe, North America, APAC | Medium term (2 to 4 years) |
| MOCN-Capable Small Cell Commoditization | +1.2% | North America, Europe | Short term (2 years or less) |
| Industry 4.0 Private Wireless Adoption | +1.0% | Germany, Japan, US, China | Medium term (2 to 4 years) |
Shared Mid-Band Spectrum Liberalization (CBRS, UK Shared Access)
The root cause is regulators changing how they license spectrum. Per FCC CBRS rules, the GAA tier opens 150 MHz in the 3550-3700 MHz band, and the CBRS 2.0 Dynamic Protection Area updates introduced in 2024 reduced exclusion zones and stretched SAS heartbeat intervals from minutes to hours, which makes dense indoor deployments practical.
In its December 2024 Shared Access statement, Ofcom removed the Terminal Registration Requirement for Low Power use in the 3.8-4.2 GHz band and made Medium Power access easier in the 1800 MHz and 3.8-4.2 GHz bands. Ofcom explicitly cited new neutral host deployment opportunities.
The quantitative mechanism is that spectrum is no longer an exclusive-licence cost that only carriers can carry. Per industry deployment tracking, more than 100 CBRS MOCN neutral host networks are now running across hotels, hospitals, campuses and warehouses. Meta’s corporate in-building network alone uses 1,500 small cells.
Restraints
| Restraint | (~) % Impact on CAGR Forecast | Geographic Relevance | Impact Timeline |
|---|---|---|---|
| MNO Reluctance on Roaming/MOCN Agreements | -1.8% | North America, Europe, India | Short term (2 years or less) |
| Elevated Cost of Capital for Venue Owners | -1.3% | Global | Short term (2 years or less) |
| Absence of Shared Spectrum Regimes | -1.1% | India, Southeast Asia, Middle East, LATAM | Medium term (2 to 4 years) |
| High-Rip Vendor Restrictions on Equipment | -0.6% | US, UK, EU | Short term (2 years or less) |
| Legacy DAS Contract Lock-In | -0.5% | North America, Western Europe | Medium term (2 to 4 years) |
MNO Reluctance on Roaming/MOCN Agreements
The root cause is the gatekeeper position mobile operators hold. A neutral host only carries public subscribers if the operator’s PLMN ID is on the network’s broadcast whitelist, and that whitelist depends on a signed commercial agreement with each MNO.
Per FCC and Ofcom licensing structures, neither regulator forces operators to interconnect with third-party hosts. A venue with deals covering only 1 or 2 of 3 national carriers therefore leaves roughly 30-60% of visitors uncovered.
The strategic impact is a direct stop on contracted sales. Hosts carry stranded radio CapEx and a 10-15% drop in blended utilization, which compresses wholesale gross margins by an estimated 4-6 percentage points. Operator CapEx guidance in annual reports shows that carriers prefer to protect their own macro-network revenue.
Challenges
| Challenge | (~) % CAGR Friction Drag | Geographic Relevance | Mitigation Horizon |
|---|---|---|---|
| Multi-Vendor Core Interoperability Gaps | -1.2% | Global | Medium term (2 to 4 years) |
| RF Integration Talent Shortage | -0.9% | North America, Europe, India | Long term (4 years or more) |
| Shared Spectrum Interference Management | -0.6% | US, UK | Medium term (2 to 4 years) |
| Cybersecurity & Lawful Intercept Compliance | -0.5% | US, EU, India | Medium term (2 to 4 years) |
| Vendor Consolidation & Lock-In Risk | -0.4% | Global | Short term (2 years or less) |
Multi-Vendor Core Interoperability Gaps
The structural weakness is that neutral host deployments have to tunnel traffic securely to each operator’s separate mobile core while also running an on-site private core. Under 3GPP specifications, MOCN and NHN functionality exist on paper, but implementations differ by vendor.
The quantitative friction shows up at the radio level. Field measurements show that deployed indoor CBSDs support intra-CBSD carrier aggregation across 2 × 20 MHz but not inter-CBSD aggregation, which caps per-site throughput. Integration testing for each additional core vendor plausibly adds 8-12 weeks and 15-20% to professional-services cost, according to the types of figures disclosed in vendor investor presentations.
The long-term corporate response will need three things: participation in GSMA and 3GPP conformance work, investment in pre-certified reference architectures, and deployment frameworks such as Ericsson’s 5-stage indoor neutral host guidebook to standardize integration steps.
Opportunities
| Opportunity | (~) % Potential CAGR Upside | Geographic Relevance | Execution Window |
|---|---|---|---|
| Neutral-Host-as-a-Service for Mid-Size Buildings | +2.0% | North America, UK, Europe | Medium term (2 to 4 years) |
| Emerging Market Shared Spectrum Entry | +1.5% | India, Southeast Asia, Middle East | Long term (4 years or more) |
| Outdoor Campus & Rural Medium-Power Coverage | +1.1% | UK, US, Nordics | Medium term (2 to 4 years) |
| Edge Compute & Network Slicing Monetization | +0.9% | Global | Long term (4 years or more) |
| Regional Integrator Roll-Up M&A | +0.7% | North America, Europe | Short term (2 years or less) |
Neutral-Host-as-a-Service for Mid-Size Buildings
This counts as untapped rather than a current driver because today’s deployments sit mostly in flagship venues and large corporate estates. Per FCC CBRS deployment records and industry tracking, operational neutral host networks number only in the low hundreds.
The new monetization model is a subscription offer: radio, core, and MNO agreements bundled together and billed per square foot or per access point each month. That replaces one-time capital sales. Based on cost benchmarks in Ofcom consultation filings, small cell-based models could cut cost per covered square foot by an estimated 40-60% versus DAS.
On unit economics, recurring contracts could lift gross margins from roughly 25-30% on hardware to 45-55% on managed services. Payback could shorten from 5-7 years to 3-4 years, consistent with the recurring-revenue ratios that tower and infrastructure-sharing companies report in their SEC filings.
Key Players Analysis
Tier 1 leaders combine global scale with deep balance sheets. Cellnex Telecom reported 2025 revenue of about EUR 4 billion, up 5.8% on an organic basis. Telecom towers alone brought in EUR 3,225 million, growing 5.5%. Adjusted EBITDA reached EUR 3.3 billion and operating profit rose to EUR 476 million, more than double the 2024 level. Cellnex now positions itself as a pure-play neutral host after selling its French data centre business.
Equipment leaders fund the radio layer that neutral hosts deploy. Ericsson reported 2025 net sales of SEK 236.7 billion and spent SEK 48.9 billion on R&D, about 20.6% of sales. Its adjusted EBITA margin reached 14.9%, and free cash flow before M&A came in at SEK 26.8 billion. Nokia, Huawei, Cisco, and CommScope compete for the same small cell and distributed antenna system contracts.
Crown Castle reshaped itself into a US tower pure-play in 2026. It now owns about 40,000 towers, backed by about USD 28 billion in contracted tenant receivables. American Tower and Verizon also hold large US positions in towers, fiber, and in-building coverage.
Tier 2 challengers win through niche focus. Boldyn Networks, majority-owned by Canada Pension Plan Investments, built more than 110 private network implementations through its Edzcom and Smart Mobile Labs deals. Edzcom alone brought more than 50 European implementations. Boingo, ExteNet, Celona, and Betacom target airports, campuses, and enterprise private 5G.
Top Key Players in the Market
- Boldyn Networks
- American Tower Corporation
- Crown Castle Inc.
- Cellnex Telecom, S.A.
- Verizon Communications Inc.
- Boingo Wireless, Inc.
- ExteNet Systems, Inc.
- CommScope Holding Company, Inc.
- Nokia Corporation
- Ericsson AB
- Huawei Investment & Holding Co., Ltd.
- Cisco Systems, Inc.
- Celona, Inc.
- Betacom Incorporated
Recent Developments
- In January 2026, Verizon Communications Inc. completed its acquisition of Frontier Communications in a deal valued at about USD 20 billion, which expanded its fiber reach for small cell and in-building backhaul.
- In March 2025, Crown Castle Inc. agreed to sell its fiber and small cell businesses to Zayo and EQT for a combined USD 8.5 billion, with Zayo paying about USD 4.25 billion for the fiber unit.
- In February 2025, Nokia Corporation closed its acquisition of Infinera at an enterprise value of USD 2.3 billion, or USD 6.65 per share, after the European Commission gave unconditional approval.
- In February 2025, Ireland’s Competition and Consumer Protection Commission approved the sale of 100% of Cellnex Telecom’s Irish business to Phoenix Tower International for EUR 970 million.
Report Scope
| Report Features | Description |
|---|---|
| Market Value (2025) | USD 46.4 Billion |
| Forecast Revenue (2035) | USD 153.4 Billion |
| CAGR (2026-2035) | 12.7% |
| Base Year for Estimation | 2025 |
| Historic Period | 2020-2024 |
| Forecast Period | 2026-2035 |
| Report Coverage | Revenue Forecast, Market Dynamics, Competitive Landscape, Recent Developments |
| Segments Covered | By Component (Infrastructure, Services, Software); By Technology (Distributed Antenna System, Small Cells, Wireless Fidelity, Open Radio Access Network, Other); By Spectrum (Licensed Spectrum, Shared Spectrum, Unlicensed Spectrum); By Ownership Model (Single-Operator Model, Multi-Operator Model); By Deployment Mode (Indoor Networks, Outdoor Networks, Hybrid Indoor-Outdoor Networks); By End User Industry (Telecommunications, Transportation and Logistics, Healthcare Facilities, Hospitality and Retail, Industrial and Manufacturing, Education and Higher Education, Government and Public Safety, Commercial Real Estate and Offices) |
| Regional Analysis | North America – US, Canada; Europe – Germany, France, The UK, Spain, Italy, Rest of Europe; Asia Pacific – China, Japan, South Korea, India, Australia, Singapore, Rest of APAC; Latin America – Brazil, Mexico, Rest of Latin America; Middle East & Africa – GCC, South Africa, Rest of MEA |
| Competitive Landscape | Boldyn Networks, American Tower Corporation, Crown Castle Inc., Cellnex Telecom, S.A., Verizon Communications Inc., Boingo Wireless, Inc., ExteNet Systems, Inc., CommScope Holding Company, Inc., Nokia Corporation, Ericsson AB, Huawei Investment & Holding Co., Ltd., Cisco Systems, Inc., Celona, Inc., Betacom Incorporated |
| Customization Scope | Customization for segments and region/country-level will be provided. Moreover, additional customization can be done based on the requirements. |
| Purchase Options | We have three licenses to opt for: Single User License, Multi-User License (Up to 5 Users), Corporate Use License (Unlimited Users and Printable PDF) |