


Report Overview
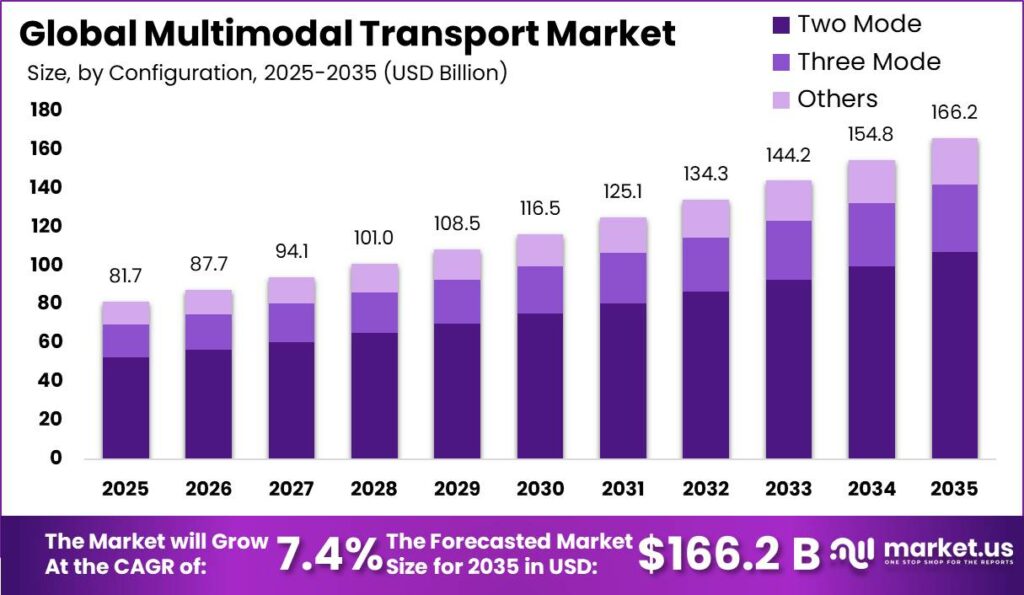
Global Multimodal Transport Market size is expected to be worth around USD 166.20 Billion by 2035 from USD 81.70 Billion in 2025, growing at a CAGR of 7.4% during the forecast period 2026 to 2035. The market moves cargo across two or more transport modes under a single contract. This structure lets shippers combine road, rail, air, and marine legs to cut cost and transit risk.
Therefore, the market rests on integrated carriers, freight forwarders, and terminal operators who coordinate each leg. Operators sell one liability contract instead of separate mode agreements. This design shifts complexity from the shipper to the provider. Companies that own or control rail sidings, port slots, and inland hubs hold the strongest structural grip because they command handoff points between modes.
Key Takeaways
- Global market size reaches USD 166.20 Billion by 2035, up from USD 81.70 Billion in 2025.
- The market grows at a CAGR of 7.4% across 2026 to 2035.
- Two Mode configuration leads with 64.56% share.
- International destination shipments hold 78.67% share.
- Road dominates individual mode with 43.56% share.
- Freight Forwarding leads service type with 47.89% share.
- Manufacturing and Automotive leads end use with 37.88% share.
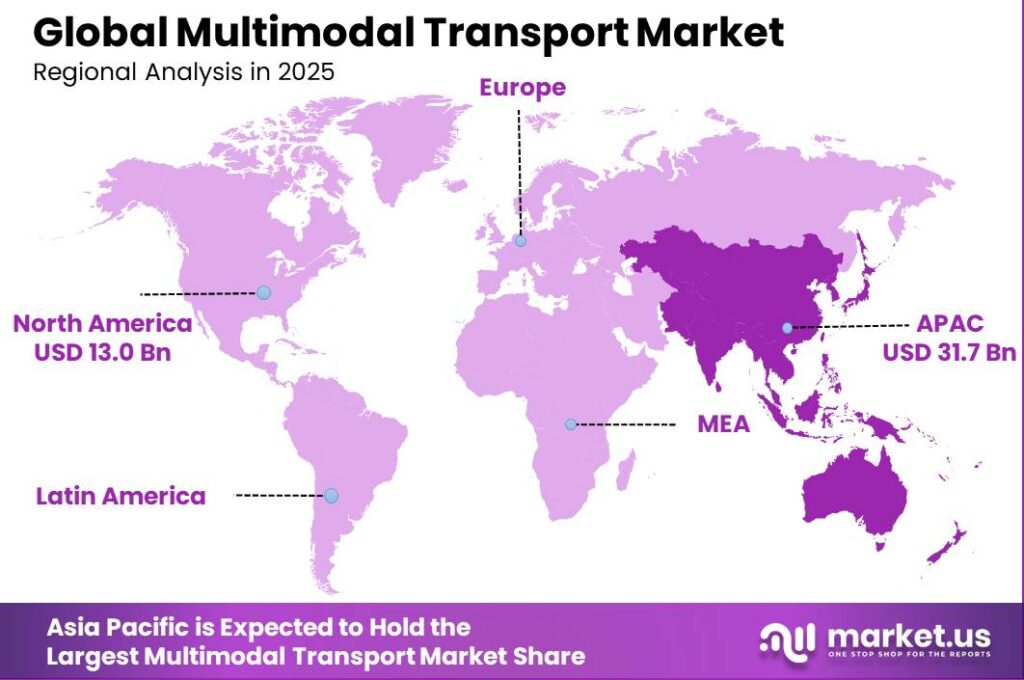
- Asia-Pacific dominates with 38.90% share, valued at USD 31.78 Billion.
Government capital programs now anchor multimodal growth. As reported by the World Bank, investment in Türkiye’s rail logistics system reduced logistics costs by as much as USD 58 Million and generated roughly 9 Million employment days. This proves public rail spending lowers unit freight cost. As a result, operators gain access to cheaper inland corridors that raise margin on long haul multimodal legs.
Port throughput growth pulls multimodal demand upward. According to Infrastructure Today, India’s major ports processed 855 Million tonnes of cargo in FY2024 to 2025, up 4.3% from 819 Million tonnes the prior year. Rising port volume feeds inland rail and road legs. This means forwarders serving Indian gateways can scale connected corridor services and lock in recurring container flows ahead of slower rivals.
Configuration Analysis
Two Mode dominates with 64.56% due to simple road plus rail pairing.
In 2025, Two Mode held a dominant market position in the By Configuration segment of Multimodal Transport Market, with a 64.56% share. Data from the Association of American Railroads shows U.S. railroads originated 3.54 Million intermodal containers and trailers in Q1 2025. This pairing of rail with road handles most inland flows. This means operators can standardize two mode lanes and win volume before adding costlier third legs.
Three Mode configuration serves complex long distance routes needing air or marine links. Figures from the Intermodal Association of North America show North American intermodal volume rose 6.3% year over year in Q1 2025. Adding a third mode raises coordination cost but expands reach. This creates premium pricing room for forwarders who master multi leg handoffs across borders.
Others configuration covers niche mixes such as inland waterway combinations. As reported by UNCTAD, containerized trade volume grew by 3.5% in its latest maritime outlook. Waterway linked mixes fit bulk and low urgency cargo. This signals a low cost entry lane for operators serving river connected industrial zones.
Transportation Destination Analysis
International dominates with 78.67% due to cross border containerized trade scale.
In 2025, International held a dominant market position in the By Transportation Destination segment of Multimodal Transport Market, with a 78.67% share. According to Kuehne + Nagel trade data, global container volumes grew by 10.7 Million TEU in 2024 versus 2023. Cross border cargo drives most multimodal spend. This means forwarders with global port coverage capture the largest revenue pool.
Domestic destination shipments move goods within one country using linked road and rail. Figures from the Intermodal Association of North America show domestic containers increased 2.6% year over year in Q2 2025. Domestic lanes offer steadier, lower risk volume. This creates a defensive base for operators exposed to volatile ocean rates.
Individual Mode Analysis
Road dominates with 43.6% due to flexible first and last mile reach.
In 2025, Road held a dominant market position in the By Individual Mode segment of Multimodal Transport Market, with a 43.6% share. Data from the Intermodal Association of North America shows trailer traffic decreased 25.4% year over year in Q2 2025. Road still connects nearly every origin and destination point. This means road capacity remains the pricing anchor across every multimodal chain.
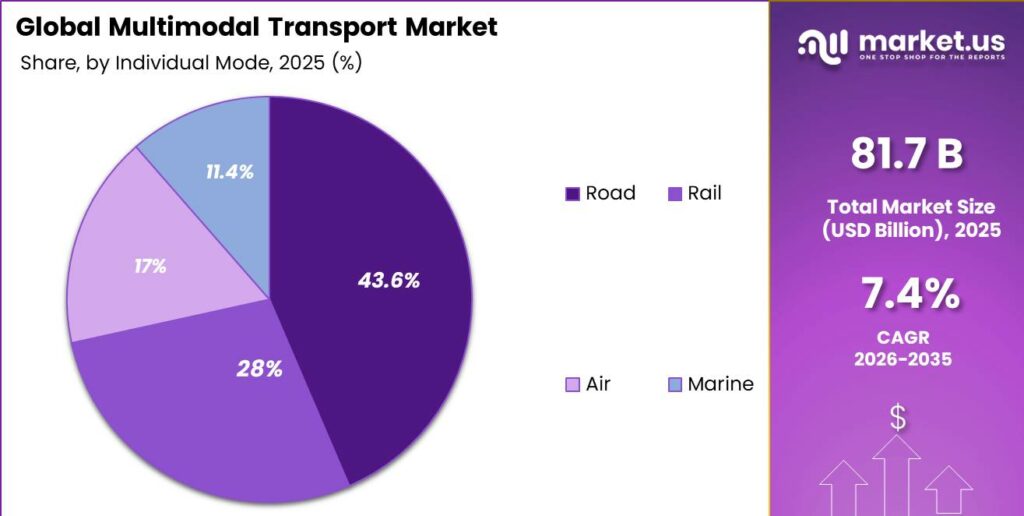
Rail carries heavy long distance volume between terminals at lower cost per tonne. The World Bank found that Türkiye rail logistics investment generated roughly 9 Million employment days. Rail cuts fuel and emissions on trunk legs. This creates savings that operators can pass to shippers to win contract renewals.
Air is the fastest growing individual mode as urgent cargo shifts to combined road air links. As reported by IATA, e Air Waybill adoption crossed roughly 80% of eligible air cargo volume by 2025. Faster document flow speeds air handoffs. This means forwarders can sell premium express multimodal products at higher margin.
Marine anchors intercontinental bulk and container movement feeding inland modes. Based on UNCTAD data, global maritime trade volume expanded at about 2% annually. Ocean legs remain the cost backbone of long haul chains. Rail and inland waterway links hold the remaining share collectively, extending reach into landlocked markets.
Service Type Analysis
Freight Forwarding dominates with 47.89% due to single contract coordination value.
In 2025, Freight Forwarding held a dominant market position in the By Service Type segment of Multimodal Transport Market, with a 47.89% share. Figures from GMInsights show global freight forwarding revenue reached USD 162.4 Billion in 2024. Forwarders bundle modes under one liability contract. This means asset light players can scale fast without owning fleets.
Freight Transportation covers the physical carrier movement of goods across each mode. According to container port statistics, ports lifted 183.2 Million TEUs in 2024. Carriers depend on high utilization to protect margin. This creates volume pressure that favors operators with dense network coverage.
Warehousing and Distribution handles storage and inventory staging between transport legs. Data from Infrastructure Today shows Indian ports moved 855 Million tonnes in FY2024 to 2025. Rising throughput lifts demand for buffer storage near gateways. This signals a growth lane for hub operators at busy ports.
Supply Chain Management is the fastest growing service as shippers seek end to end visibility. UNCTAD indicates containerized trade grew 3.5% in its latest count. Integrated management raises switching costs for clients. This creates recurring revenue for providers who embed data platforms into shipper operations.
End User Industry Analysis
Manufacturing and Automotive dominates with 37.88% due to heavy component movement volume.
In 2025, Manufacturing and Automotive held a dominant market position in the By End User Industry segment of Multimodal Transport Market, with a 37.88% share. Data from the Association of American Railroads shows railroads originated 3.54 Million intermodal units in Q1 2025, up 8.3%. Auto plants rely on scheduled multimodal parts flow. This means reliability sells better than price in this segment.
Retail and E-commerce is the fastest growing end user as online orders cross borders daily. Based on HSG Capital data, worldwide online retail sales are projected to grow from USD 6.4 Trillion in 2025 to USD 7.8 Trillion by 2027. Parcel volume surges strain single mode networks. This creates demand for combined road air express multimodal products.
Pharmaceuticals and Healthcare needs temperature controlled multimodal chains with strict timing. As reported by IATA, e Air Waybill use passed 80% of eligible volume by 2025. Faster documents protect cold chain integrity. This means compliant operators can charge premiums for verified pharma corridors.
Perishable Goods depends on fast marine and air links to limit spoilage. Figures from UNCTAD show maritime trade grew about 2% yearly. Speed and cold storage decide margin in this category. This signals opportunity for operators who combine reefer capacity with rapid inland transfer.
Key Market Segments
By Configuration
- Two Mode
- Three Mode
- Others
By Transportation Destination
- International
- Domestics
By Individual Mode
- Road
- Rail
- Air
- Marine
By Service Type
- Freight Transportation
- Freight Forwarding
- Warehousing & Distribution
- Supply Chain Management
By End User Industry
- Retail and E-commerce
- Manufacturing and Automotive
- Pharmaceuticals and Healthcare
- Perishable Goods
Regional Analysis
Asia-Pacific Dominates the Multimodal Transport Market with a Market Share of 38.90%, Valued at USD 31.78 Billion
Asia-Pacific leads with a 38.90% share, valued at USD 31.78 Billion. Dense port networks and rising trade anchor this lead. As reported by Infrastructure Today, India’s major ports processed 855 Million tonnes in FY2024 to 2025. Strong port throughput feeds inland rail and road legs. This means regional forwarders gain steady container flow to build scaled corridor products.
Retail and e-commerce demand makes the region the fastest growing zone. Based on HSG Capital data, worldwide online retail sales climb from USD 6.4 Trillion in 2025 toward USD 7.8 Trillion by 2027. Cross border parcel growth drives multimodal express services. Mitsubishi Logistics established Mitsubishi Logistics India Private Limited in September 2025 to add freight forwarding and land transport capacity here.
North America and Europe hold the next largest shares on strong intermodal volume. Figures from the Association of American Railroads show U.S. railroads originated 3.54 Million intermodal units in Q1 2025, up 8.3%. Mature rail networks support reliable inland moves. This creates a stable base for high value manufacturing and automotive multimodal flows.
Key Regions and Countries
North America
- US
- Canada
Europe
- Germany
- France
- The UK
- Spain
- Italy
- Rest of Europe
Asia Pacific
- China
- Japan
- South Korea
- India
- Australia
- Rest of APAC
Latin America
- Brazil
- Mexico
- Rest of Latin America
Middle East and Africa
- GCC
- South Africa
- Rest of MEA
Market Dynamics
Market Opportunity Analysis - Underserved modes, service tiers, and regions open clear entry points for new players
The Others configuration segment stays underexploited because most operators concentrate on Two Mode road rail pairings holding 64.56% share. Inland waterway and mixed mode combinations serve river connected industrial zones with little competition. New entrants can build low cost niche lanes here. This means first movers can lock in bulk shippers before larger carriers notice the gap.
The Domestic destination segment remains open while rivals chase the 78.67% International pool. Domestic linked road and rail lanes offer steadier volume and lower ocean rate exposure. Regional players can dominate home markets that global forwarders overlook. Consequently, focused operators build defensible density before expanding into cross border trade.
Supply Chain Management as a service is underserved next to Freight Forwarding at 47.89% share. Shippers increasingly want end to end visibility rather than point moves. Providers who embed data platforms raise client switching costs. This creates recurring revenue that pure transport players cannot easily match.
Latin America and Middle East and Africa stay thin next to Asia-Pacific at 38.90% share. These regions lack integrated multimodal operators despite rising trade. Early entrants can secure corridor rights and terminal access cheaply. Therefore, patient investors can capture structural share before infrastructure matures and valuations rise.
Technology and Innovation Landscape - Digital documents, scheduled rail services, and low emission routing reshape competitive edges
Electronic shipping documents now cut border friction across multimodal corridors. As reported by the IRU, digital technologies could save international freight operators up to 4 days at border crossings along the Middle Corridor in 2025. Faster clearance lowers working capital tied in transit. This means digital first operators move cargo cheaper and win price sensitive contracts.
Scheduled multimodal rail services connect inland networks to ports with fixed reliability. DP World’s EXIM rail service, launched December 2025, runs twice weekly between Powarkheda and Nhava Sheva. Predictable schedules let manufacturers plan tighter inventory. This creates loyalty among industrial shippers who value certainty over spot flexibility.
Low emission modal shift technology cuts carbon while holding delivery reliability. A 2025 intermodal case study reported a 65% reduction in carbon emissions per shipment while maintaining a 98% on time delivery rate. Green performance now doubles as a sales tool. This means operators can win sustainability mandated freight without sacrificing service quality.
Rail linked container movement delivers steep emission cuts versus road. DP World reported in December 2025 that its new Powarkheda to Nhava Sheva rail service could reduce transport emissions by nearly 70% compared with road. Lower emissions reduce future compliance exposure. This signals that rail investment protects margin as carbon rules tighten.
Drivers
The shift from paper bills of lading toward electronic bills and single window customs platforms is reshaping carrier and forwarder economics today. The World Customs Organization and UNCTAD both record faster national rollout between 2024 and 2026. IATA data shows e Air Waybill adoption crossing roughly 80% of eligible air cargo volume by 2025. This compresses shipment processing time and cuts administrative cost per leg.
Faster documents let asset light forwarders shift from one time brokerage fees toward recurring platform and data subscription revenue. International Chamber of Commerce tracking shows processing time falling by an estimated 25% to 40% per multimodal leg. This means early adopters expand operating margins. Paper bound incumbents still absorb manual reconciliation costs of up to 3% to 5% of freight value.
| Driver | (~) % Impact on CAGR Forecast | Geographic Relevance | Impact Timeline |
|---|---|---|---|
| Digitalized Freight Documentation Adoption | +2.1% | Global | Short term (2 years or less) |
| Rising Containerized Cross Border E commerce | +1.8% | Asia Pacific, North America | Short term (2 years or less) |
| Port Rail Road Corridor Capital Programs | +1.4% | India, EU, China | Medium term (2 to 4 years) |
| Post Disruption Resilience Routing Shift | +1.0% | Europe, Middle East | Short term (2 years or less) |
| Single Contract Liability Consolidation | +0.7% | Global | Medium term (2 to 4 years) |
Restraints
Persistently high borrowing costs are the root cause behind a documented pullback in multimodal terminal and rolling stock spending. World Bank and IMF tracking show effective corporate borrowing costs for logistics infrastructure staying above 7% through 2025 and 2026 in several emerging economies. OECD surveys link this level to intermodal terminal payback stretching from 6 to 8 years to over 10 years. This defers announced rail siding and dry port expansions.
This financing bottleneck pushes several rail siding and dry port projects into deferral, per national development bank records. It compresses operator margins by an estimated 150 to 250 basis points where bridge financing carries penalty spreads. This means carriers delay fleet electrification and terminal automation. As a result, volume growth stays capped below its potential trajectory.
| Restraint | (~) % Impact on CAGR Forecast | Geographic Relevance | Impact Timeline |
|---|---|---|---|
| Elevated Fleet and Terminal Financing Rates | -1.2% | Global, acute in emerging markets | Short term (2 years or less) |
| Red Sea Corridor Route Freezes | -1.0% | Middle East, Europe, East Africa | Short term (2 years or less) |
| Urban Low Emission Zone Diesel Bans | -0.9% | EU, China urban cores | Short term (2 years or less) |
| Cold Chain Asset Capital Scarcity | -0.8% | Latin America, Sub Saharan Africa | Short term (2 years or less) |
| Non Digital Cross Border Customs Barriers | -0.6% | South Asia, Africa | Short term (2 years or less) |
Challenges
The IMO Net Zero Framework approved at MEPC 83 in April 2025 enters force in 2027 and creates a structural planning burden. Its fuel intensity schedule requires vessels above 5,000 gross tonnage, about 85% of international shipping emissions, to cut greenhouse gas fuel intensity or buy remedial units. This forces carriers into continuous compliance planning rather than a one time fix.
Classification societies and the International Chamber of Shipping report that compliant fuel pathways stay undefined beyond a 19 gram CO2e per megajoule threshold through 2035. Carriers must run parallel fuel procurement and bunkering contingency strategies. This hedging adds 2% to 4% to voyage operating cost uncertainty. This means multimodal operators must commit to multi fuel bunkering well ahead of confirmed pricing.
| Challenge | (~) % CAGR Friction Drag | Geographic Relevance | Mitigation Horizon |
|---|---|---|---|
| IMO Net Zero Compliance Cost Uncertainty | -0.9% | Global, ocean carriers | Medium term (2 to 4 years) |
| Skilled Logistics Planner Shortage | -0.7% | North America, Europe | Medium term (2 to 4 years) |
| Chronic Port Congestion and Equipment Imbalance | -0.8% | Asia Pacific, Europe | Medium term (2 to 4 years) |
| Cross Regional Rail Gauge Interoperability Gaps | -0.5% | Eurasia, South Asia | Long term (4 years or more) |
| Freight Digitization Cybersecurity Exposure | -0.4% | Global | Medium term (2 to 4 years) |
Opportunities
Certified green corridor premium services remain untapped white space because no scaled mechanism yet monetizes verified low carbon multimodal routing. The IMO Net Zero Fund plans reward payments of an estimated 10 Billion dollars per year, and the EU FuelEU Maritime reward factor is being finalized. Operators who build certified corridor products ahead of the 2027 entry into force can capture sustainability conscious shippers.
Classification society and IEA analysis suggest achievable premium pricing of 5% to 8% above standard freight rates. Early movers could gain gross margin expansion of 300 to 500 basis points by locking in surplus units before compliance costs price into the market. This unit economic shift stays unrealized today. This means it sits outside the current baseline forecast, offering pure upside to fast movers.
| Opportunity | (~) % Potential CAGR Upside | Geographic Relevance | Execution Window |
|---|---|---|---|
| Certified Green Corridor Premium Services | +1.3% | Global, EU and East Asia priority | Medium term (2 to 4 years) |
| AI Driven Dynamic Routing Monetization | +1.1% | Global | Medium term (2 to 4 years) |
| Urban Last Mile Consolidation Hub Integration | +1.0% | North America, Europe | Medium term (2 to 4 years) |
| Regional Forwarder Roll Up Consolidation | +0.9% | Southeast Asia, Latin America | Long term (4 years or more) |
| Emerging Inland Waterway and Rail Corridor Expansion | +0.8% | Africa, Southeast Asia | Long term (4 years or more) |
Key Company Insights
Deutsche Post DHL holds a structural edge through its integrated road, air, and ocean network across global lanes. The company launched TRUCKAIR in January 2026, a multimodal road air freight service for large and bulky cargo between China and Europe. This move targets high value cross border flows where speed beats price. However, heavy fixed network cost creates margin risk if volume softens.
DP World controls handoff points by linking ports, rail, and inland terminals under one operator. The company committed USD 2.5 Billion in logistics infrastructure investment for 2025, including USD 1 Billion for the London Gateway expansion. Its December 2025 EXIM rail service runs twice weekly between Powarkheda and Nhava Sheva. This vertical control secures corridor pricing power and defends against asset light challengers.
Key Players
- BDP International
- CH Robinson Worldwide
- Crowley Maritime
- Deutsche Post DHL
- Kuehne + Nagel International
- MARUBENI LOGISTICS
- Mitsubishi Logistics
- DSV A/S
- Bison Trasport Inc.
- Geodis SA
- DP World
Recent Developments
- April 2025: DSV A/S completed its EUR 14.3 Billion acquisition of Schenker, expanding its global freight forwarding, transport and contract logistics network.
- June 2025: Crowley Maritime launched its first direct ocean shipping route between the U.S. Northeast and Central America using LNG powered Avance Class vessels.
- September 2025: C.H. Robinson Worldwide launched a cross border freight consolidation service combining less than truckload consolidation, customs brokerage and bonded warehousing between Mexico and the U.S.
- December 2025: Geodis SA agreed to acquire Malherbe to strengthen its full truckload and less than truckload road freight network in France.
- February 2026: Kuehne + Nagel International agreed to acquire the road logistics activities of Germany based Lohmöller Group, covering groupage, less than truckload and full truckload transportation.
Geopolitical Impact Analysis
Red Sea disruption forces carriers to reroute around the Cape of Good Hope, adding cost and delay to multimodal chains. According to UNCTAD, Suez Canal transits fell by more than 50% during the disruption, while the longer route adds roughly 10 extra days per voyage. Longer ocean legs raise fuel burn on multimodal marine segments. This means forwarders shift more cargo onto rail corridors to protect transit reliability.
Tariff escalation between major economies reshapes multimodal routing and sourcing. As reported by the WTO, average applied tariffs on affected goods climbed above 20% on several trade lanes, while merchandise trade growth slowed to around 2%. Higher duties push shippers toward nearshoring and regional corridors. This creates demand for Mexico to U.S. and intra Asia multimodal services that bypass tariff heavy long haul lanes.
Report Scope
| Report Features | Description |
|---|---|
| Market Value (2025) | USD 81.70 Billion |
| Forecast Revenue (2035) | USD 166.20 Billion |
| CAGR (2026-2035) | 7.4% |
| Base Year for Estimation | 2025 |
| Historic Period | 2020-2024 |
| Forecast Period | 2026-2035 |
| Report Coverage | Revenue Forecast, Market Dynamics, Market Opportunity Analysis, Technology and Innovation Landscape, Competitive Landscape, Recent Developments |
| Segments Covered | By Configuration (Two Mode, Three Mode, Others), By Transportation Destination (International, Domestics), By Individual Mode (Road, Rail, Air, Marine), By Service Type (Freight Transportation, Freight Forwarding, Warehousing & Distribution, Supply Chain Management), By End User Industry (Retail and E-commerce, Manufacturing and Automotive, Pharmaceuticals and Healthcare, Perishable Goods) |
| Regional Analysis | North America (US and Canada), Europe (Germany, France, The UK, Spain, Italy, and Rest of Europe), Asia Pacific (China, Japan, South Korea, India, Australia, and Rest of APAC), Latin America (Brazil, Mexico, and Rest of Latin America), Middle East and Africa (GCC, South Africa, and Rest of MEA) |
| Competitive Landscape | BDP International, CH Robinson Worldwide, Crowley Maritime, Deutsche Post DHL, Kuehne + Nagel International, MARUBENI LOGISTICS, Mitsubishi Logistics, DSV A/S, Bison Trasport Inc., Geodis SA, DP World |
| Customization Scope | Customization for segments, region / country-level will be provided. Additional customization can be done based on requirements. |
| Purchase Options | We have three licenses to opt for: Single User License | Multi-User License (Up to 5 Users) | Corporate Use License (Unlimited User and Printable PDF) |





































