Report Overview
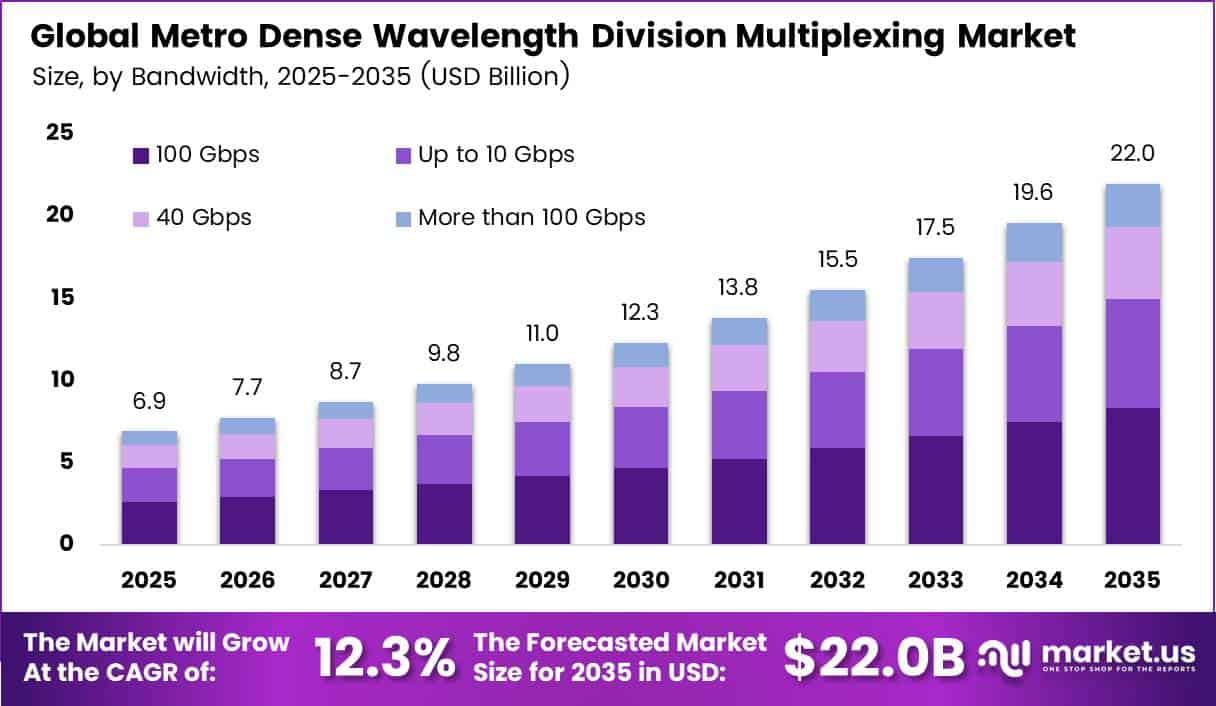
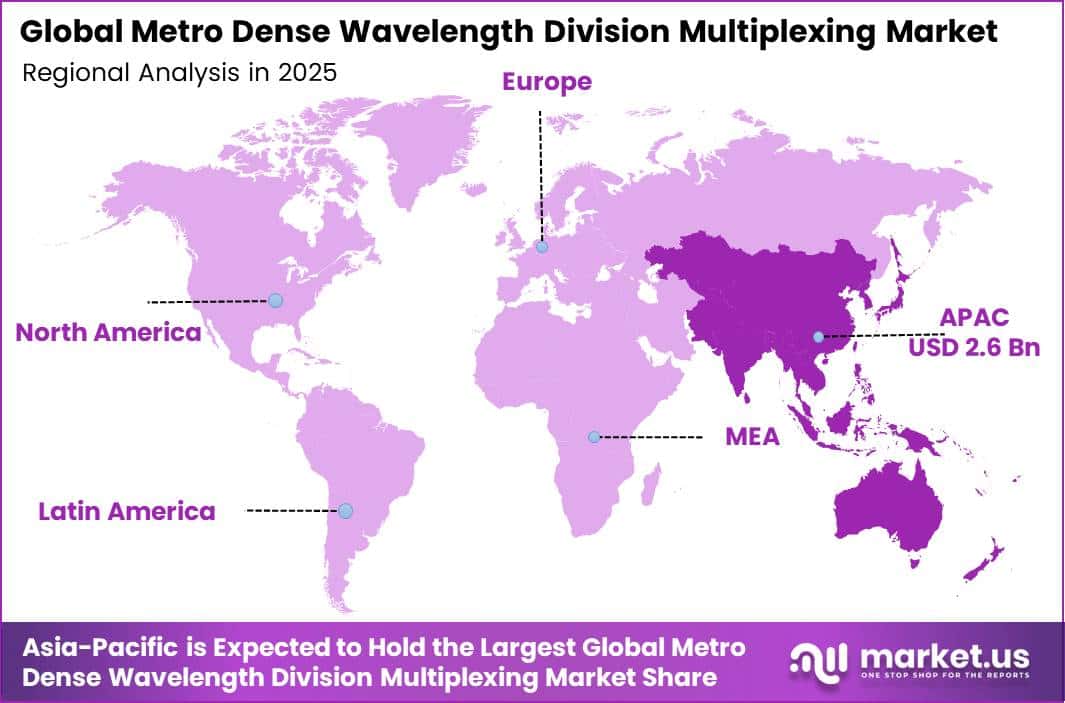
In 2025, the Global Metro Dense Wavelength Division Multiplexing Market was valued at USD 6.9 billion. The market is projected to grow at a CAGR of 12.3% during 2026–2035, reaching approximately USD 22.0 billion by 2035. Asia-Pacific dominated the global market in 2025, accounting for more than 37.6% of the total market share and generating approximately USD 2.6 billion in revenue.
Rising data traffic in cities drives this growth. According to the ITU, about 6 billion people used the Internet in 2025, up from 5.8 billion in 2024. The online population grew by more than 240 million people in a single year. Internet use climbed from 71% to 74% of the world’s population, and yearly user growth rose to 3.3% from 2.9%.
Each new user adds video, cloud, and payment traffic to metro fiber rings. Telecom operators and data center firms respond by adding more wavelengths per fiber. Metro DWDM lets them carry many signals on one fiber pair, so they avoid costly new fiber builds.
The Asia-Pacific region has the world’s largest base of new Internet users. The ITU reports that Internet use in Asia-Pacific reached 77% in 2025, up from 50% in 2019. That jump of 27 percentage points beats every other ITU region over the same period. Large markets such as China and India keep adding mobile and fiber users. Operators must link thousands of 5G sites and new data centers inside dense cities.
Key Takeaways
- The Metro Dense Wavelength Division Multiplexing Market stood at USD 6.9 billion in 2025 and will reach USD 22.0 billion by 2035. at a CAGR of 12.3% during 2026 to 2035.
- By bandwidth, 100 Gbps leads the market with a 34.7% share.
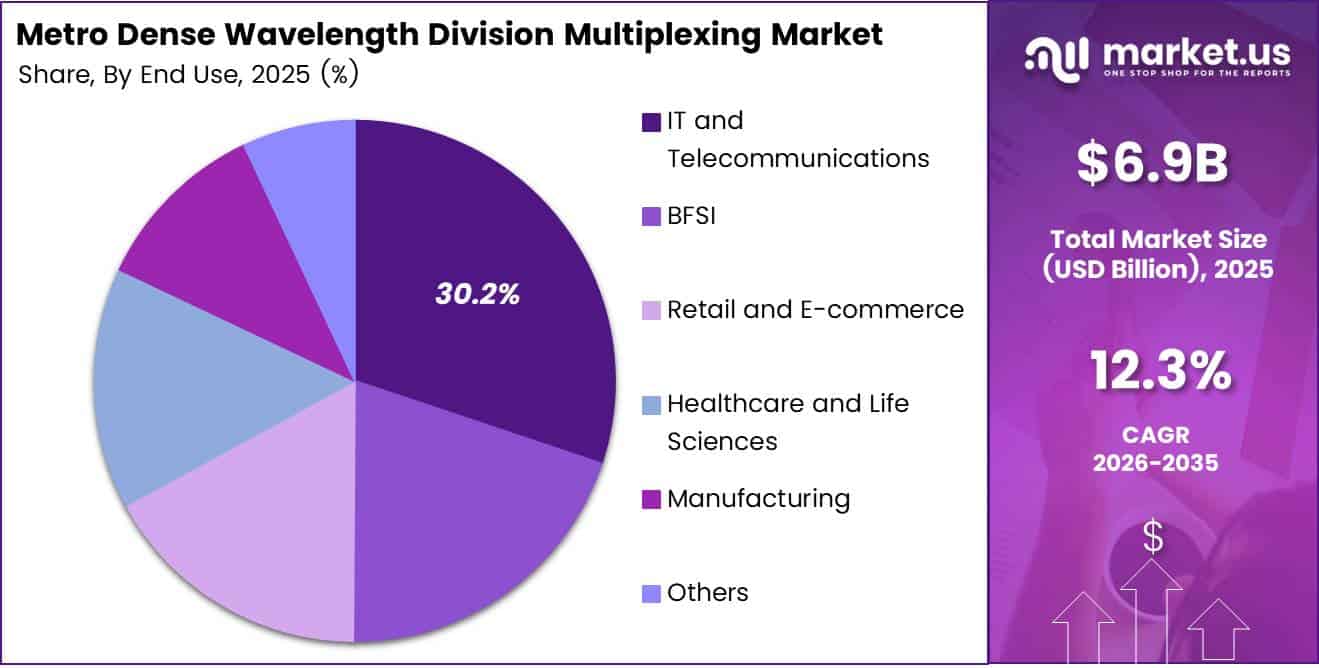
- By end use, IT and Telecommunications lead the market with a 30.2% share.
- Asia-Pacific dominates the market with a 37.9% share and USD 2.6 billion in revenue.
By Bandwidth
100 Gbps dominates with 34.7% due to low cost per bit metro links.
The 100 Gbps segment leads because it gives metro operators the best mix of speed, cost, and reach. City networks now carry far more data as more people go online. ITU estimates that 6.3 billion people, or 76% of the world’s population, use the Internet in 2026. This load pushes carriers to replace old 10 Gbps and 40 Gbps links with 100 Gbps wavelengths that run on the fiber they already own.
The same segment also grows the fastest, and supplier results show how quickly demand is building. Ciena, a top optical vendor, grew revenue 19% to $4.8 billion in fiscal 2025, and its new orders ran well above that revenue. Cloud firms and carriers bought more optical gear to link data centers, towers, and exchanges inside major cities.
Small pluggable optics now cut power use and rack space, so regional operators can upgrade without buying new chassis. Lower-speed tiers still serve rural and enterprise links, while systems above 100 Gbps win mainly on long, heavy core routes. For most metro buyers, 100 Gbps remains the safest and most affordable upgrade path through 2030.
By End Use
IT and Telecommunications dominate with 30.2% due to heavy carrier and cloud traffic loads.
IT and Telecommunications holds the top share because carriers, cloud providers, and data center operators run the busiest metro fiber routes. Ciena’s revenue reached $1.67 billion in its fiscal third quarter of 2026, up from $1.22 billion a year earlier, as service providers and cloud players added network capacity.
Healthcare and Life Sciences grows the fastest as hospitals move imaging, patient records, and research data onto shared networks. U.S. health spending rose 7.2% to $5.3 trillion in 2024, equal to 18.0% of GDP and $15,474 per person, according to CMS. That money funds telehealth, cloud records, and genome studies, and all of them need secure, low-delay links between campuses.
Key Market Segments
By Bandwidth
- Up to 10 Gbps
- 40 Gbps
- 100 Gbps
- More than 100 Gbps
By End Use
- IT and Telecommunications
- BFSI
- Retail and E-commerce
- Healthcare and Life Sciences
- Manufacturing
- Others
Geopolitical Impact Analysis
Trade barriers now touch a large share of the parts that go into metro DWDM gear. The WTO found that new tariffs and import measures affected USD 2,640 billion of global imports between mid-October 2024 and mid-October 2025. That equals 11.1% of all imports and is more than 4 times the USD 611 billion of the year before.
US and China tensions add direct pressure. China placed new export controls on rare earth metals used in technology products. The US answered with new duties of 100% on Chinese imports. Rare earths feed optical amplifiers and laser parts. Vendors with Chinese plants now face higher landed costs on US orders.
Shipping problems also slow deliveries. UNCTAD reports that rerouting ships around Africa adds about 12 days on the Shanghai to Rotterdam route. This acts like a 30% rise in transit time. Ship tonnage entering the Red Sea fell by more than 70%. Asian factories that ship DWDM chassis and modules to Europe must carry more stock to cover these delays.
Trade growth is cooling as well. WTO economists put world goods trade growth at 2.4% in 2025, helped by strong demand for AI products and early buying ahead of tariffs. They cut the 2026 forecast to 0.5% from 1.8%. Early buying in 2025 pulled some optical gear orders forward. Buyers may now stretch out new metro projects in 2026 to manage cost risk.
Regional Analysis
Asia-Pacific dominates the Metro Dense Wavelength Division Multiplexing Market, holding a 37.9% share and generating USD 2.6 billion in revenue. The region holds the world’s largest user base and some of the densest cities. World Bank data shows that Internet use in East Asia and the Pacific reached 88% of the population in 2025.
The ITU finds that 85% of urban dwellers worldwide use the Internet, compared with 58% of rural people. Asia-Pacific’s fast urban growth pushes more users into the high-use group each year. That shift multiplies traffic in city cores. Australia and Southeast Asian markets add subsea landing stations and data center hubs, and these feed metro DWDM rings.
North America is the fastest-growing region in the Metro Dense Wavelength Division Multiplexing Market. Strong public funding and fast data center growth drive its demand. Through the BEAD Program, the NTIA manages USD 42.45 billion in federal broadband grants. Congress set aside this sum within USD 65 billion for broadband under the IIJA.
Europe holds a mature but steady position in the market. The ITU reports that 92% of Europeans used the Internet in 2025, up from 82% in 2019. High use means most growth comes from upgrades, not new users. Operators in Germany, France, the UK, Spain, and Italy are replacing older 10 Gbps systems with 100 Gbps and faster waves.
Key Regions and Countries
North America
- US
- Canada
Europe
- Germany
- France
- The UK
- Spain
- Italy
- Rest of Europe
Asia Pacific
- China
- Japan
- South Korea
- India
- Australia
- Rest of APAC
Latin America
- Brazil
- Mexico
- Rest of Latin America
Middle East and Africa
- GCC
- South Africa
- Rest of MEA
Market Dynamics
Drivers
| Driver | (~) % Impact on CAGR Forecast | Geographic Relevance | Impact Timeline |
|---|---|---|---|
| AI Data Center Interconnect Traffic Surge | +2.4% | North America, Asia Pacific | Short term (2 years or less) |
| 400ZR/ZR+ Coherent Pluggable Adoption | +1.8% | Global | Short term (2 years or less) |
| 5G Fronthaul and Backhaul Densification | +1.3% | Asia Pacific, Europe | Medium term (2 to 4 years) |
| FTTH Aggregation Layer Upgrades | +1.0% | Europe, North America | Medium term (2 to 4 years) |
| Enterprise Cloud Migration Bandwidth Demand | +0.8% | Global | Short term (2 years or less) |
| Government Broadband Stimulus Disbursement | +0.7% | North America, India | Medium term (2 to 4 years) |
AI Data Center Interconnect Traffic Surge
The root cause is the move of hyperscale AI training and inference clusters into multi-building metro campuses. These campuses have to be stitched together over distances of 10–120 km with very high capacity, which makes metro DWDM part of the compute fabric rather than just carrier transport.
Hyperscaler capital expenditure, as disclosed in SEC 10-K and 10-Q filings, rose by more than 50% year on year through 2025, with AI infrastructure taking the largest share. Optical systems vendors reported in earnings calls that cloud and ICP customers made up more than 40% of optical revenue in some quarters of 2025.
On the protocol side, OIF implementation agreements finalized 800ZR interoperability in 2024, which allowed per-wavelength rates of 800 Gb/s at roughly 30–40% lower cost per bit than 400G transponder generations. The commercial result is a shift in buying behavior: hyperscalers now buy disaggregated open line systems directly instead of turnkey carrier platforms.
Per vendor investor presentations, this compresses chassis hardware margins by an estimated 3–5 percentage points. Vendors are offsetting that loss through higher unit volumes and through software-defined line-system management priced on a subscription basis.
Restraints
| Restraint | (~) % Impact on CAGR Forecast | Geographic Relevance | Impact Timeline |
|---|---|---|---|
| Telecom Carrier CapEx Contraction | -1.6% | Europe, North America | Short term (2 years or less) |
| High-Vendor Equipment Bans and Rip-and-Replace Mandates | -1.1% | Europe, North America | Short term (2 years or less) |
| Elevated Interest Rates on Network Financing | -0.9% | Global | Short term (2 years or less) |
| Tariffs on Optical Components | -0.8% | North America, China | Medium term (2 to 4 years) |
| Customer Inventory Digestion Cycles | -0.6% | Global | Short term (2 years or less) |
Telecom Carrier CapEx Contraction
The root cause is that tier-one telecom operators are earning flat-to-declining returns. Revenue growth sits below 2% annually, according to GSMA Intelligence operator financial tracking, while debt loaded on during 5G spectrum auctions remains on the balance sheet.
Operators therefore cut capital intensity from about 17% toward 14–15% of revenue, a trend visible in operator annual reports and in ETNO investment surveys of European carriers. The bottleneck shows up as new metro DWDM purchase orders from carriers falling by an estimated 15–20% through 2024.
Optical vendors reported this in earnings calls as service provider revenue declines and order backlogs stretched out by 2–3 quarters. Strategically, metro ring upgrades get deferred, existing lines are run longer, and spectrum is reused on legacy 100G grids. That squeezes vendor gross margins by 2–4 percentage points as competitive tenders turn more price-led.
Challenges
| Challenge | (~) % CAGR Friction Drag | Geographic Relevance | Mitigation Horizon |
|---|---|---|---|
| Indium Phosphide Laser Supply | -1.2% | Global | Medium term (2 to 4 years) |
| Optical Engineering Talent Shortage | -0.7% | North America, Europe | Long term (4 years or more) |
| Multi-Vendor Interoperability Complexity | -0.6% | Global | Medium term (2 to 4 years) |
| Pluggable Power and Thermal Limits | -0.5% | Global | Medium term (2 to 4 years) |
| Metro Fiber Right-of-Way Delays | -0.4% | India, Europe | Long term (4 years or more) |
Indium Phosphide Laser Supply
The structural weakness is that only a small number of companies can produce indium phosphide epitaxial wafers and tunable laser dies. On the materials side, USGS mineral commodity summaries show global refined indium output concentrated above 50% in China, and the Chinese Ministry of Commerce export controls on gallium and germanium, introduced in 2023.
In practice, component makers told investors in earnings calls that lead times for tunable lasers and coherent DSP modules stretched to 26–40 weeks during 2025, and that wafer yields at 6-inch InP lines trail silicon by a wide margin.
Over the long term, vendors are adjusting in three ways: dual-sourcing lasers, moving to vertically integrated fabs funded in part by U.S. Department of Commerce CHIPS Act grants, and adopting silicon photonics integration. These steps are expected to cut laser die content per module by 20–30%.
Opportunities
| Opportunity | (~) % Potential CAGR Upside | Geographic Relevance | Execution Window |
|---|---|---|---|
| Edge AI Inference Metro Fabrics | +1.7% | North America, Asia Pacific | Medium term (2 to 4 years) |
| Tier-2 City Expansion in Emerging Markets | +1.2% | India, Southeast Asia, Africa | Long term (4 years or more) |
| Optical Network-as-a-Service Models | +0.9% | Global | Medium term (2 to 4 years) |
| Quantum Key Distribution Overlay | +0.5% | Europe, China | Long term (4 years or more) |
| Utility and Smart Grid Private Optical Networks | +0.4% | North America, Europe | Medium term (2 to 4 years) |
Edge AI Inference Metro Fabrics
This is still untapped because current DWDM demand comes mainly from linking centralized training campuses. Distributed inference nodes inside the metro, at colocation sites, cable landing hubs, and central office conversions, have not yet been cabled at scale.
The white space is a new layer of metro edge sites placed within 1–5 ms latency of end users. Uptime Institute facility surveys and colocation operator investor decks show edge site counts growing, but most of these sites are not yet connected with coherent optics.
Inference workloads are projected to exceed 60% of AI compute by the end of the decade, according to IEA data center energy tracking. Vendors that offer compact 1–2RU open line systems with 800G ZR+ pluggables could lower cost per bit per kilometre by an estimated 35–45% compared with chassis-based transponders.
Combining hardware with automation software, on the model of operator NaaS frameworks defined by the MEF industry association, could raise blended gross margins by 4–6 percentage points through recurring software revenue.
Key Players Analysis
Tier 1 leaders include Cisco Systems, Ciena, Huawei Technologies, and Nokia, which now owns Infinera. Cisco reported fiscal 2025 revenue of USD 56.7 billion, up 5%. It spent USD 9.3 billion on R&D, or 16.4% of revenue, up 16% from the prior year. This scale lets Cisco bundle optical transport with routing for metro operators.
Ciena is the largest pure optical player. It posted fiscal 2025 revenue of USD 4.77 billion, up from USD 4.01 billion. Ciena spent USD 848.3 million on R&D, about 17.8% of revenue. It also agreed to buy Nubis Communications for USD 270 million in cash to grow its data center interconnect business.
Nokia changed the market structure when it closed its Infinera deal. The total purchase price came to EUR 2,496 million, including EUR 1,066 million in cash. From late February to December 2025, Infinera added EUR 1,258 million in net sales. Nokia also recorded goodwill of EUR 833 million and targets more than EUR 200 million in operating profit synergies by 2027.
Tier 2 challengers include Lumentum, Fujitsu, ZTE, Adtran, Alcatel-Lucent, and Tejas Networks. Lumentum grew fiscal 2025 revenue 21% to USD 1,645.0 million. Its Cloud and Networking unit generated USD 424.1 million in the fourth quarter, or 88.2% of sales. Tejas Networks reported an order book of Rs. 2,315 crore for DWDM and access products in India.
Top Key Players in the Market
- Adtran, Inc.
- Alcatel-Lucent
- Lumentum Operations LLC
- Ciena Corporation
- Cisco Systems, Inc.
- Fujitsu Limited
- Huawei Technologies
- Infinera Corporation
- ZTE Corporation
- Tejas Networks
Recent Developments
- In February 2025, Nokia completed its acquisition of Infinera Corporation at USD 6.65 per share, issuing 127,434,986 Nokia shares as part of the payment.
- In June 2026, Ciena Corporation reported quarterly revenue of USD 1.67 billion, up 37% year over year, and raised its fiscal 2026 revenue outlook to USD 6.42 billion.
- In November 2026, Lumentum reported fiscal first quarter revenue of USD 1,262.6 million, up 136.5% year over year, and secured a co-packaged optics win valued at USD 5 billion.
Report Scope
| Report Features | Description |
|---|---|
| Market Value (2025) | USD 6.9 Billion |
| Forecast Revenue (2035) | USD 22.0 Billion |
| CAGR (2026-2035) | 12.3% |
| Base Year for Estimation | 2025 |
| Historic Period | 2020-2024 |
| Forecast Period | 2026-2035 |
| Report Coverage | Revenue Forecast, Market Dynamics, Competitive Landscape, Recent Developments |
| Segments Covered | By Bandwidth (Up to 10 Gbps, 40 Gbps, 100 Gbps, More than 100 Gbps); By End Use (IT and Telecommunications, BFSI, Retail and E-commerce, Healthcare and Life Sciences, Manufacturing, Others) |
| Regional Analysis | North America – US, Canada; Europe – Germany, France, The UK, Spain, Italy, Rest of Europe; Asia Pacific – China, Japan, South Korea, India, Australia, Singapore, Rest of APAC; Latin America – Brazil, Mexico, Rest of Latin America; Middle East & Africa – GCC, South Africa, Rest of MEA |
| Competitive Landscape | Adtran, Inc., Alcatel-Lucent, Lumentum Operations LLC, Ciena Corporation, Cisco Systems, Inc., Fujitsu Limited, Huawei Technologies, Infinera Corporation, ZTE Corporation, Tejas Networks |
| Customization Scope | Customization for segments, region/country-level will be provided. Moreover, additional customization can be done based on the requirements. |
| Purchase Options | We have three licenses to opt for: Single User License, Multi-User License (Up to 5 Users), Corporate Use License (Unlimited Users and Printable PDF) |