


Key Findings at a Glance
- Japan’s children’s entertainment centers market is estimated at USD 1.19 Billion in 2026 and is projected to reach USD 2.33 Billion by 2035, a CAGR of 7.8%.
- Teenagers (12–18) are the largest visitor group, with a 43.0% share, and arcade studios are the largest activity area, at 34.3%.
- Japan’s child population fell to a record low of 13.29 million in April 2026, and births fell to 671,236 in 2025.
- Despite fewer children, Bandai Namco’s existing amusement stores in Japan grew sales 7.0% in the year to March 2026.
- AR and VR gaming zones (11.2% CAGR) and the Kansai region (9.1% CAGR) are the fastest-growing activity area and region.
Market Overview
The Japan Children’s Entertainment Centers Market is estimated at USD 1.19 Billion in 2026 and is projected to reach USD 2.33 Billion by 2035, growing at a CAGR of 7.8% over the forecast period.
The market is growing even though Japan has fewer children each year. After the pandemic, families shifted spending away from goods and towards supervised, social out-of-home experiences. Large operators report strong demand. In the year to March 2026, Bandai Namco’s existing amusement stores in Japan grew sales 7.0%, and Round One’s revenue rose 7.1% to a record ¥189.5 billion. Operators are earning more per visitor through IP-themed attractions, prize games, food and merchandise, which makes up for fewer young visitors.
The market covers ticketed and pay-per-play venues that earn money from entry fees, food and drink, merchandise, arcade play and attractions based on licensed characters (IP). Venues sit in train stations, shopping centres, airports and standalone parks. The market does not include home gaming, streaming or other digital-only entertainment.
Japan’s gaming culture and dense, rail-connected cities create unusual demand conditions. Arcade and AR/VR investment runs ahead of similar venues in Southeast Asia or Europe. Japan’s rich ecosystem of anime and gaming IP also supports higher spending per visit than in markets where venues are spread across suburbs.
Analyst insight: “Japan’s age pyramid shows the real challenge for this market. As of April 2026, there were 3.09 million children aged 12–14 but only 2.13 million aged 0–2, which is 31% fewer. Teenagers are the market’s largest group today, at 43.0% of revenue. But by 2035, the 12–14 age group will be made up of today’s 3–5-year-olds, who number only 2.43 million, 21% fewer than today’s 12–14s. Operators can’t rely on teen volume growth. Growth will have to come from higher spending per visit and from adult and multigenerational visitors. That’s why we expect Adults (24+) to grow fastest, at a 9.6% CAGR.”
— Market.us

Market Definition
This report measures annual spending at children’s and family entertainment centers in Japan. It includes:
- Children, teens and family groups at amusement facilities: Spending by visitors under 18, and by family groups (adults visiting with children), at arcades and multi-activity centers.
- Dedicated kids’ play and edutainment venues: Indoor play parks, kids’ clubs, and learning-through-play venues such as KidZania and LEGOLAND Discovery Center.
- Small and mid-sized family attraction parks: The family-visitor share of revenue at these parks.
The market excludes:
- Major destination theme parks: Tokyo Disney Resort and Universal Studios Japan
- Spending by adults visiting without children
- Home gaming hardware
- Streaming and other digital-only entertainment
Key Takeaways
- The market is valued at USD 1.19 Billion in 2026 and is expected to reach USD 2.33 Billion by 2035, at a CAGR of 7.8%.
- By Visitor Demographics: Teenagers (12–18) led with a 43.0% share in 2026.
- By Facility Size: 1 to 10 Acres led with a 31.4% share in 2026.
- By Revenue Source: Entry Fees and Ticket Sales led with a 42.1% share in 2026.
- By Activity Area: Arcade Studios led with a 34.3% share in 2026.
- By Region: Kanto led with a 38.9% share in 2026.
- Fastest-growing categories: Adults 24+ (9.6% CAGR), Up to 5,000 Sq. Ft venues (9.4%), Food and Beverages (9.2%), AR and VR Gaming Zones (11.2%) and Kansai (9.1%).
- Top key players: Bandai Namco Holdings Inc., GENDA GiGO Entertainment Inc. (formerly SEGA Entertainment), Round One Corporation, KidZania and Merlin Entertainments Limited (LEGOLAND Discovery Center).
Key Market Statistics
| Indicator | Value | Source |
|---|---|---|
| Children under 15 (1 April 2026) | 13.29 million (10.8% of population) | Ministry of Internal Affairs and Communications |
| Change in child population vs 2025 | −350,000 (45th straight annual fall) | Ministry of Internal Affairs and Communications |
| Births to Japanese residents, 2025 | 671,236 (record low) | Ministry of Health, Labour and Welfare |
| Total fertility rate, 2025 | 1.14 (record low) | Ministry of Health, Labour and Welfare |
| Total population (1 Oct 2025) | 122.9 million (−2.5% vs 2020) | 2025 Census |
| Share aged 65 and over, 2025 | 29.4% | 2025 Census |
| Japan amusement industry size, FY2023 | About ¥720 billion | JAIA |
| Bandai Namco Amusement segment sales, FY to Mar 2026 | ¥152.7 billion | Bandai Namco |
| Bandai Namco existing-store sales growth, Japan | +7.0% | Bandai Namco |
| Round One revenue, FY to Mar 2026 | ¥189.5 billion (+7.1%) | Round One |
| GENDA GiGO arcades (July 2026) | 429 stores | GENDA |
| Average exchange rate, 2026 | ¥156.44 per USD | Market exchange rate data |
Research Methodology
How the Market Size Was Built
| Component (2026) | Basis | Value (¥ billion) | Value (USD Bn) |
|---|---|---|---|
| Spending by under-18s and family groups at amusement facilities | Share of amusement facility operating revenue (JAIA data, operator reports) | 128.0 (est.) | 0.82 |
| Dedicated kids’ play and edutainment venues | Venue counts × average revenue per venue | 38.0 (est.) | 0.24 |
| Family share of small and mid-sized attraction parks | Attendance × family share × average spend | 20.2 (est.) | 0.13 |
| Total | 186.2 | 1.19 |
USD values use the 2026 average exchange rate of ¥156.44 per USD. For context, Japan’s whole amusement industry was about ¥720 billion in FY2023 (JAIA), so this market is a focused subset of that total.
Forecast Approach
The 7.8% USD CAGR for 2026–2035 combines two drivers:
- Nominal growth in yen (about 5.5% a year): Higher spending per visit outweighs the falling number of children. Spending is rising through price increases, IP-themed attractions, prize games, food and merchandise. Recent evidence supports this: Bandai Namco’s existing stores grew 7.0% and Round One grew 7.1% in the year to March 2026, while the child population fell 2.6%.
- Yen recovery (about 2.2% a year): The forecast assumes the yen gradually strengthens from ¥156 per USD in 2026. At a constant exchange rate, the CAGR would be about 5.5%.
Data and Validation
- Top-down: Japan’s amusement industry size (JAIA) and demographic data from government ministries were used to size the child and family share of the market.
- Bottom-up: Results from Bandai Namco, Round One and GENDA, plus venue-level information on pricing and openings, were used to check the totals.
- Modelled figures: Non-leading segment shares, regional shares other than Kanto, and all 2035 values and CAGRs are Market.us estimates. They are labelled as estimates throughout.
- Primary and expert validation: For this 2026 edition, findings were checked against first-hand statements from market participants published between November 2025 and August 2026. Analysts reviewed results for the fiscal year ended March 2026 from Bandai Namco Holdings and Round One Corporation, and GENDA’s results for the fiscal year ended January 2026. This included management guidance on existing-store growth, pricing and new openings. Analysts also reviewed 7 developments announced between February and August 2026, involving The Pokémon Company, Narita International Airport, Bandai Namco, Round One, GENDA and Universal Studios Japan. Demographic assumptions were checked against the Ministry of Internal Affairs and Communications child population release (May 2026), the Ministry of Health, Labour and Welfare’s 2025 vital statistics (June 2026), and the final 2025 census results (29 September 2026).
How this report was produced: Market.us analysts collected and checked data from government statistics, industry associations and company filings. AI tools assisted with drafting and formatting. All figures, analysis and conclusions were reviewed and approved by Market.us Research team before publication.
| Segment | Category | 2026 Share | 2026 Value (USD Mn) | 2035 Value (USD Mn) | CAGR 2026–2035 |
|---|---|---|---|---|---|
| Visitor Demographics | Families with Children (0–9) | 17.2% | 204.7 | 351.7 | 6.20% |
| Visitor Demographics | Families with Children (9–12) | 14.6% | 173.7 | 308.8 | 6.60% |
| Visitor Demographics | Teenagers (12–18) | 43.0% | 511.7 | 1,014.8 | 7.91% |
| Visitor Demographics | Young Adults (18–24) | 13.8% | 164.2 | 345.1 | 8.60% |
| Visitor Demographics | Adults (24+) | 11.4% | 135.7 | 309.6 | 9.60% |
| Facility Size | Up to 5,000 Sq. Ft | 14.8% | 176.1 | 395.3 | 9.40% |
| Facility Size | 5,001–10,000 Sq. Ft | 13.6% | 161.8 | 323.5 | 8.00% |
| Facility Size | 10,001–20,000 Sq. Ft | 15.2% | 180.9 | 349.7 | 7.60% |
| Facility Size | 20,001–40,000 Sq. Ft | 14.1% | 167.8 | 316.3 | 7.30% |
| Facility Size | 1–10 Acres | 31.4% | 373.7 | 708.2 | 7.36% |
| Facility Size | 11–30 Acres | 6.9% | 82.1 | 151.0 | 7.00% |
| Facility Size | Over 30 Acres | 4.0% | 47.6 | 86.0 | 6.80% |
| Revenue Source | Entry Fees and Ticket Sales | 42.1% | 501.0 | 908.7 | 6.84% |
| Revenue Source | Food and Beverages | 21.6% | 257.0 | 567.6 | 9.20% |
| Revenue Source | Merchandising | 18.4% | 219.0 | 448.8 | 8.30% |
| Revenue Source | Advertising | 4.2% | 50.0 | 107.7 | 8.90% |
| Revenue Source | Others | 13.7% | 163.0 | 297.2 | 6.90% |
| Activity Area | Arcade Studios | 34.3% | 408.2 | 761.1 | 7.17% |
| Activity Area | AR and VR Gaming Zones | 15.8% | 188.0 | 488.8 | 11.20% |
| Activity Area | Physical Play Activities | 22.4% | 266.6 | 450.3 | 6.00% |
| Activity Area | Skill/Competition Games | 17.6% | 209.4 | 422.2 | 8.10% |
| Activity Area | Others | 9.9% | 117.8 | 207.6 | 6.50% |
Note: Leading shares come from the Market.us model. Other shares, all 2035 values and all CAGRs are Market.us estimates.
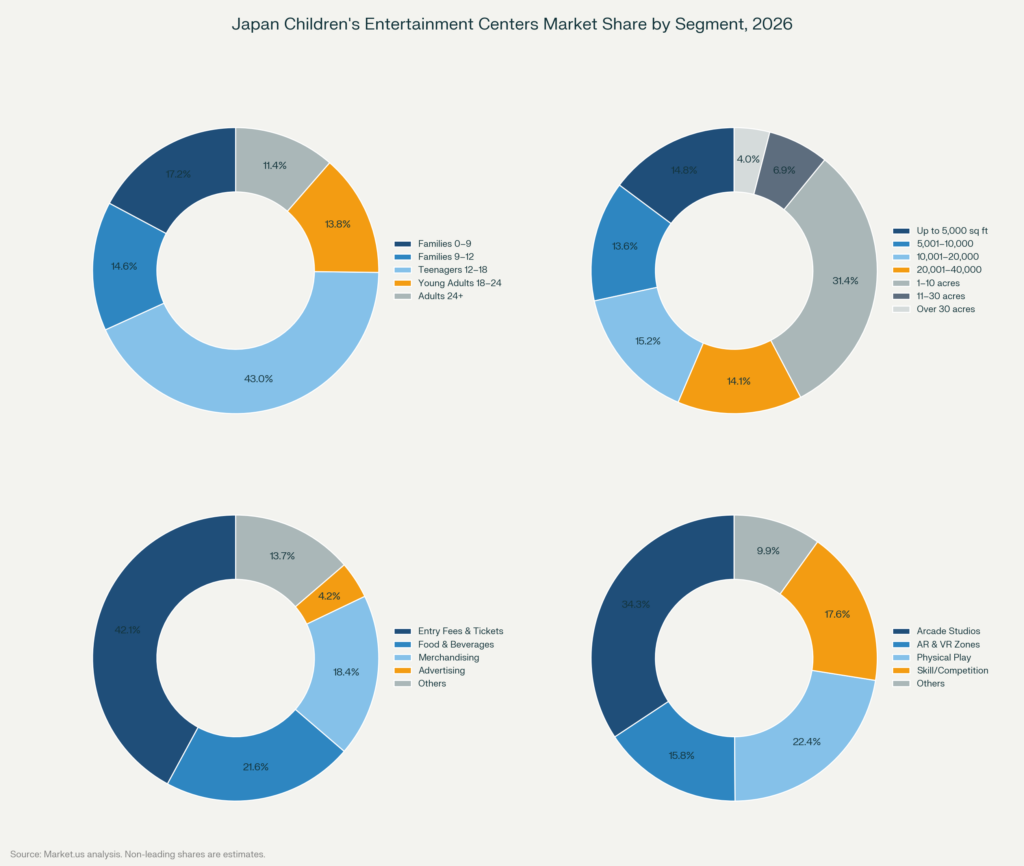
Visitor Demographics Analysis
Teenagers (12–18) accounted for 43.0% of visitor demographics demand in 2026, worth USD 511.7 Million, the highest of any category.
Teenagers are the most valuable visitor group in Japan’s children’s entertainment centers. They visit often, spend repeatedly on arcade credits and competitive gaming, and are closely tied to Japan’s gaming culture. Operators serving this group earn a large share of revenue from pay-per-play and skill-based games. Prize games (crane and claw machines) are especially popular. Round One reported steady crane game demand in the year to March 2026.
Families with children aged 0–9 and 9–12 drive daytime and weekend visits, with a combined 31.8% share. Young adults aged 18–24 and adults aged 24 and over form smaller but growing groups. Adults usually come with children or grandchildren, or visit arcades out of nostalgia.
Adults (24+) are the fastest-growing group, at an estimated 9.6% CAGR. Operators can raise revenue per group without needing more child visitors.
Facility Size Analysis
Venues of 1 to 10 acres led facility size with a 31.4% share in 2026, worth USD 373.7 Million.
Large venues of 1 to 10 acres lead because they can offer a full activity mix in one visit: arcade zones, physical play, food and drink, and IP-themed attractions. They attract the most visitors per day and earn the most per visitor. Multi-activity centers such as Round One stores, shopping centre anchor tenants and standalone family parks mostly fall in this size band.
Small formats up to 5,000 square feet are the fastest-growing size, at an estimated 9.4% CAGR. They serve train stations, airports and shopping centre corners, where visits are short and prices per minute are higher. GENDA alone runs about 13,000 “mini-locations” (game corners with 30 or fewer machines) across its business, alongside its larger arcades. Venues of 5,001 to 20,000 square feet serve dense neighbourhoods in Tokyo and Osaka. Venues over 30 acres are few, and this report counts only their family-visitor revenue.
Revenue Source Analysis
Entry Fees and Ticket Sales led the revenue source segment with a 42.1% share in 2026, worth USD 501.0 Million.
Entry fees lead because many operators charge for admission first. Japanese families are willing to pay upfront for organised, guaranteed-access experiences. Operators use admission revenue to cover fixed costs before visitors spend on extras. Prices are rising: PokéPark KANTO, which opened in February 2026, charges ¥7,900 for an adult Trainer’s Pass, and Narita Airport’s Kinder Platz charges ¥2,200 per child.
Food and beverages are the fastest-growing revenue source, at an estimated 9.2% CAGR, as operators add themed dining to attractions. Merchandise tied to anime and character IP turns fan interest into extra spending after the visit. Advertising is the smallest category, but it is growing as venues install more digital screens for brand promotions.
Some operators are moving away from entry fees for young children. In April 2026, Bandai Namco turned its paid “Asobi Park” at namco Aeon Mall Ogaki into a free play area, “Oogaki Kids”. This shows that free entry can bring families in to spend on arcades, food and merchandise.
Activity Area Analysis
Arcade Studios led the activity area segment with a 34.3% share in 2026, worth USD 408.2 Million.
Arcades lead because gaming is at the centre of teen and young adult leisure in Japan. Arcade zones have the highest repeat-visit rate of any activity type and keep earning outside holiday peaks thanks to loyal regulars. Operators that keep refreshing machines and running tournaments maintain pricing power. Bandai Namco’s updated Gundam series machines were among its most popular amusement products in the year to March 2026.
AR and VR gaming zones are the fastest-growing activity area, at an estimated 11.2% CAGR. New hardware and exclusive content turn first-time curiosity visits into repeat visits. Physical play activities serve children aged 0–12 and anchor family visits, while skill and competition games bridge teen and young adult audiences. Combining an arcade with an AR/VR zone widens the age range a single venue can attract.
Key Market Segments
By Visitor Demographics
- Families with Children (0–9)
- Families with Children (9–12)
- Teenagers (12–18)
- Young Adults (18–24)
- Adults (Ages 24+)
By Facility Size
- Up to 5,000 Sq. Ft
- 5,001 to 10,000 Sq. Ft
- 10,001 to 20,000 Sq. Ft
- 20,001 to 40,000 Sq. Ft
- 1 to 10 Acres
- 11 to 30 Acres
- Over 30 Acres
By Revenue Source
- Entry Fees and Ticket Sales
- Food and Beverages
- Merchandising
- Advertising
- Others
By Activity Area
- Arcade Studios
- AR and VR Gaming Zones
- Physical Play Activities
- Skill/Competition Games
- Others
Regional Analysis
| Region | 2026 Share | 2026 Value (USD Mn) | 2035 Value (USD Mn) | CAGR 2026–2035 |
|---|---|---|---|---|
| Kanto | 38.9% | 462.9 | 896.3 | 7.62% |
| Kansai/Kinki | 18.5% | 220.2 | 482.1 | 9.10% |
| Central/Chubu | 12.8% | 152.3 | 294.5 | 7.60% |
| Kyushu-Okinawa | 11.0% | 130.9 | 268.3 | 8.30% |
| Tohoku | 6.0% | 71.4 | 119.6 | 5.90% |
| Chugoku | 5.6% | 66.6 | 118.5 | 6.60% |
| Hokkaido | 4.2% | 50.0 | 93.4 | 7.20% |
| Shikoku | 3.0% | 35.7 | 57.3 | 5.40% |
| Total | 100% | 1,190.0 | 2,330.0 | 7.80% |
Note: Shares other than Kanto’s, and all CAGRs, are Market.us estimates. Central/Chubu includes Hokuriku and Shinetsu.

Kanto Region
Kanto led with a 38.9% share in 2026, worth USD 462.9 Million.
Kanto includes Japan’s largest cities: Tokyo, Yokohama and Saitama. Its dense rail network lets venues draw visitors from far beyond their own neighbourhood. Operators benefit from foreign tourists, high household incomes and the largest number of IP-licensed venues in the country. PokéPark KANTO, which opened at Yomiuriland in Tokyo in February 2026, added a major new family IP attraction to the region.
Kansai/Kinki Region
Kansai is the fastest-growing region, at an estimated 9.1% CAGR. Osaka’s entertainment infrastructure, the visitor base around Universal Studios Japan and the dense population of Osaka, Kyoto and Kobe support strong demand. Osaka is often called Japan’s leisure capital and draws both domestic families and a growing number of foreign visitors. In August 2026, Universal Studios Japan was reported to be preparing a ¥200–300 billion expansion. Universal has not confirmed this, but the report signals continued investment in the region.
Central/Chubu Region
Chubu centres on Nagoya, Japan’s fourth-largest city. Large venues serve Nagoya’s suburban families, and the region’s manufacturing economy supports above-average household incomes. Chubu has fewer venues than Kanto and Kansai but is attracting new investment from operators looking for lower rents than in Tokyo and Osaka.
Kyushu-Okinawa Region
Kyushu-Okinawa combines domestic tourism with resident families in Fukuoka, Nagasaki and Kumamoto. Fukuoka, one of Japan’s fastest-growing cities by population, draws entertainment investment. Okinawa’s demand comes mainly from tourists rather than residents. The region is expected to grow at an estimated 8.3% CAGR.
Tohoku Region
Tohoku is a smaller but stable market, serving families in Sendai and surrounding prefectures. Lower population density limits venue size, but Sendai’s role as a regional hub supports demand for mid-sized centers. Operators rely more on local repeat visitors than on tourists.
Chugoku Region
Chugoku, centred on Hiroshima and Okayama, has a modest venue base serving local families. Hiroshima attracts both residents and tourists, which gives venues two sources of visitors. Venues here are usually smaller than the national average.
Hokkaido Region
Sapporo accounts for most of Hokkaido’s entertainment venue demand. Ski and nature tourism brings extra visitors, but this doesn’t fully make up for the region’s low population density.
Shikoku Region
Shikoku has the smallest venue base of any major region. Few large cities and lower household incomes than in Kanto and Kansai limit venue economics. Operators here usually run smaller venues with fewer activities.
Macroeconomic Impact
According to the Ministry of Finance, Japan’s nominal GDP reached ¥642.4 trillion in fiscal 2024. Nominal GDP was projected to grow about 4.2% in fiscal 2025, with real GDP growth of about 1.1%, and real GDP is projected to grow about 1.3% in fiscal 2026. Moderate real growth keeps household incomes at levels that support spending on leisure outside the home.
Consumer prices were projected to rise about 2.6% in fiscal 2025. Inflation at this level squeezes operators’ margins through higher staff and energy costs, but it also lifts revenue per visit as admission and food prices rise. Venues with memberships or advance bookings are better protected than those that depend on walk-in ticket sales.
Market Dynamics
Driver: Urban Families Spend More on Supervised Out-of-Home Experiences
Families in Tokyo, Osaka and Nagoya are spending less on physical goods and more on venue-based experiences that combine fun, socialising and safe, supervised play. Operators that position their venues around making memories and learning can charge higher admission prices than those that offer only play.
Japan’s employment rate for women aged 15–64 reached 76.1% in 2024. Dual-income families with little time for unstructured outdoor play look for venues that combine child supervision with comfort for adults. Venues that invest in comfortable seating areas and good food benefit directly from this shift.
Restraint: A Shrinking Child Population Reduces the Core Audience
Japan’s child population fell to a record low of 13.29 million in April 2026, 350,000 fewer than a year earlier and the 45th straight annual fall. Births to Japanese residents fell to 671,236 in 2025, and the fertility rate dropped to a record low of 1.14. Operators cannot reverse this trend. They must adapt their business models to a smaller, but not disappearing, child audience, and competition for each family visit will grow every year.
People aged 65 and over made up a record 29.4% of the population in the 2025 census. Home gaming devices also compete for children’s leisure time, adding pressure on physical venues.
Opportunity: Adult Co-Play and IP Licensing Offset Demographic Decline
Japan’s employment rate for people aged 65 and over was 26.1% in 2024. Many active, working seniors visiting with grandchildren create a valuable non-child revenue stream. Venues designed for grandparents and grandchildren to play together can grow their audience without needing the birth rate to recover.
Anime, manga and character IP turns Japan’s world-leading content into repeat visits. PokéPark KANTO’s tickets were sold out for two months after it opened in February 2026, which shows how strongly major IP draws visitors. Memberships, birthday packages and school-holiday workshops increase how much each family spends over time.
Analyst insight: “Operators are already growing faster than their audience is shrinking. Japan’s child population fell 2.6% in the year to April 2026, but Bandai Namco’s existing amusement stores in Japan grew sales 7.0%, and Round One’s revenue rose 7.1%. That gap of nearly 10 percentage points comes from higher spending per visit: price increases, IP collaborations, prize games and food. We expect this gap to continue. It is the main reason the market can grow at a 7.8% CAGR while the number of children keeps falling.”
—Market.us

Porter’s Five Forces
| Force | Level | Explanation |
|---|---|---|
| Threat of new entrants | Low | High city rents, costly machine refreshes, IP licensing fees and safety rules keep out poorly funded entrants |
| Supplier power | High | A few IP rights holders and machine makers set terms for arcade hardware and character licences |
| Buyer power | Moderate | Families have few high-quality alternatives in dense cities, but home gaming gives them options |
| Threat of substitutes | High | Home gaming devices and digital entertainment compete for the same leisure time without travel or admission costs |
| Competitive rivalry | High in cities | Bandai Namco, GENDA GiGO and Round One compete for the same families and teens in Kanto and Kansai |
AI and Gen AI Impact
Artificial intelligence (AI) is changing Japan’s children’s entertainment centers most visibly in games and attractions. Bandai Namco sold 11.92 million units of new home-console game titles and 28.84 million units of older titles in the year to March 2025. With so much high-quality gaming available at home, arcade and VR operators must offer something better to attract visits. Operators using AI for adaptive game difficulty, personalised game recommendations and real-time crowd management create experiences that home devices cannot match.
Generative AI is starting to change venue marketing and character content. Operators use it to create personalised birthday content, custom avatars and AI-driven character interactions at lower cost than traditional production. Venues that don’t adopt these tools risk higher content costs per visitor than AI-enabled competitors. AI-powered interactions with licensed characters are the most valuable near-term use for Japanese operators.
Market Trends
IP-Driven Immersive Formats Replace Static Play
DRAGON BALL: Sparking! ZERO sold 5.4 million units in the year to March 2025, showing the pull of franchise IP across home and venue formats. Venues are replacing fixed, equipment-heavy layouts with IP-themed zones that change with active franchises. Bandai Namco reported strong performance from IP-themed venues such as THE JOJO★WORLD in the year to March 2026. Operators that time venue content with anime releases and game launches turn fan communities into frequent visitors.
Arcade Consolidation Through Acquisitions
The arcade sector is consolidating quickly. GENDA, which bought SEGA’s arcade business, more than doubled its GiGO store count, from 199 entertainment facilities in November 2020 to 429 stores in July 2026. In the fiscal year ended January 2026, GENDA acquired Harrows, which runs 53 amusement facilities, along with Ewing and Game Goose. Its consolidated sales rose 52.7% to ¥170.7 billion. Smaller operators are selling to larger groups that can afford machine refreshes and IP fees.
Free Entry to Drive Secondary Spending
Some operators are dropping entry fees for young children’s play areas to bring families in more often. Bandai Namco’s switch from a paid Asobi Park to the free “Oogaki Kids” area in April 2026 is an early example. The aim is to earn more from arcade play, food and merchandise than from admission.
Market Competition Overview
The market is moderately concentrated at the top. A few large, integrated operators control the premium segment, while many independent single-site venues make up most of the venue count. Large operators compete through IP licensing deals, their own arcade machines and national brand recognition, which lets them charge more than independents.
Bandai Namco’s Digital segment generated ¥455.6 billion in sales and its Toys and Hobby segment ¥596.9 billion in the year to March 2025. This shows how leading operators use income from related businesses to support venue investment and brand strength.
Independent operators struggle with machine refresh costs and IP fees, which large operators absorb more easily. As a result, many are being acquired. Challengers gaining share specialise in underserved formats, such as multigenerational play and anime-themed attractions, rather than competing head-on with incumbents on arcades alone.
Analyst insight: “Bandai Namco’s Amusement segment earned ¥10.1 billion of profit on ¥152.7 billion of sales in the year to March 2026, a margin of about 6.6%. Even the market leader earns thin margins on venues, because staff, rent, energy and machine costs are high. Bandai Namco’s move to make a kids’ play area free in April 2026 shows where profit comes from: not the entry ticket, but what families spend once inside. We expect this to make Food and Beverages (9.2% CAGR) and Merchandising (8.3%) grow faster than Entry Fees (6.84%).”
—Market.us
Competitive Benchmarking
| Company | Key Metric | Value | Growth | Data As Of |
|---|---|---|---|---|
| Bandai Namco Holdings | Amusement segment sales | ¥152.7 billion | +8.0% | FY ended 31 Mar 2026 |
| Bandai Namco Holdings | Amusement segment profit | ¥10.1 billion | +20.2% | FY ended 31 Mar 2026 |
| Bandai Namco Holdings | Existing-store sales, Japan | — | +7.0% | FY ended 31 Mar 2026 |
| Round One Corporation | Group revenue (Japan, US, China) | ¥189.5 billion | +7.1% | FY ended 31 Mar 2026 |
| Round One Corporation | Operating profit | ¥28.8 billion | +9.7% | FY ended 31 Mar 2026 |
| GENDA Inc. | Consolidated sales | ¥170.7 billion | +52.7% | FY ended 31 Jan 2026 |
| GENDA GiGO Entertainment | Arcade stores | 429 | — | July 2026 |
Company Profiles
Bandai Namco Holdings Inc.
Bandai Namco Holdings holds the strongest position in Japan’s children’s entertainment centers through its own arcade machines, world-famous IP and a nationwide network of venues. In the year to March 2026, consolidated net sales rose 8.6% to a record ¥1,348.2 billion, and operating profit rose 5.2% to ¥189.5 billion. The Amusement segment grew sales to ¥152.7 billion and profit to ¥10.1 billion, with existing-store sales in Japan up 7.0%. For the year to March 2027, it expects about 4% growth at existing Japanese facilities. Its ability to match venue content with its own IP release calendar is a strong advantage that pure venue operators cannot easily copy.
GENDA GiGO Entertainment Inc. (formerly SEGA Entertainment)
GENDA GiGO Entertainment runs one of Japan’s best-known arcade networks under the GiGO brand. It was formerly SEGA Entertainment, which GENDA acquired in stages between 2020 and 2022. The network grew from 199 entertainment facilities in November 2020 to 429 stores in July 2026, mostly through acquisitions. GiGO competes directly with Bandai Namco for teens and young adults through dense city locations, prize games and rhythm games. The main risk is that rapid acquisitions bring integration costs. The parent company’s operating profit was only ¥7.4 billion on ¥170.7 billion of sales in the fiscal year ended January 2026.
Round One Corporation
Round One Corporation operates large multi-activity entertainment centers combining bowling, arcade games, karaoke and “Spo-Cha” sports zones. In the year to March 2026, its revenue rose 7.1% to a record ¥189.5 billion and operating profit rose 9.7% to ¥28.8 billion, helped by collaboration campaigns, crane games and price increases. It plans to grow to 172 stores by March 2027. Its large venues fall mainly in the 1–10 acre category, which is the largest facility size segment.
Key Players
- Bandai Namco Holdings Inc.
- GENDA GiGO Entertainment Inc. (formerly SEGA Entertainment)
- GENDA Inc.
- Round One Corporation
- Cosmos Hotel Management Co., Ltd. (ANO-NE Kids Club)
- COSMOS INITIA Co., Ltd.
- Namco Funscape
- Sega Sammy Holdings
- KidZania
- Merlin Entertainments Limited (LEGOLAND Discovery Center)
- The Pokémon Company (PokéPark KANTO)
- The Walt Disney Company
- Toei Animation Co., Ltd.
- Toei Company Ltd.
- Shochiku Co., Ltd.
- Tohokushinsha Film Corp.
- Avex, Inc.
- IG Port, Inc.
- Tokyu Recreation Co., Ltd.
- Timezone Group
- Dave & Buster’s Entertainment, Inc.
- CEC Entertainment Concepts, L.P.
Pricing Analysis
Bandai Namco’s Amusement segment earned a profit margin of about 6.6% in the year to March 2026. That shows pricing power exists but is limited by operating costs. Market leaders price admission and play credits above cost, then rely on food, drink and merchandise to raise profit per visit. Challengers that match entry prices without matching this extra spending earn thinner margins.
Prices are rising across the market. Round One cited strategic price increases as a growth driver in the year to March 2026. New IP venues charge premium prices: PokéPark KANTO’s Trainer’s Pass costs ¥7,900 for adults and ¥4,700 for children, and its Elite Trainer’s Pass costs ¥14,000 for adults. Kinder Platz at Narita Airport charges ¥2,200 per child and ¥1,100 per adult.
Prices also vary by region. Kanto and Kansai operators charge premium prices thanks to higher incomes and tourists willing to pay more. Operators in Shikoku and Tohoku price below the national average to keep local families visiting often.
Supply Chain and Value Chain Analysis
The value chain runs from IP rights holders and machine makers, through venue operators, to visitors. Most value is created at the venue operator level, where admission, extra spending and memberships come together. IP rights holders, including anime studios and game publishers, earn licensing fees from operators for branded attractions. Makers of arcade machines, VR headsets and interactive equipment are a critical upstream dependency. Shortages of chips and display panels can delay machine refreshes and limit attraction quality.
Downstream, food and drink suppliers, merchandise makers and digital payment providers complete the chain. Bottlenecks concentrate at two points:
- IP licensing negotiations: These can delay themed zone openings by six to twelve months.
- Skilled technicians: Machine maintenance is limited by Japan’s tight labour market.
Operators with direct relationships with IP holders and in-house technical teams reduce both risks.
Regulatory Landscape
Arcade operators in Japan must follow the Act on Control and Improvement of Amusement Business (often called the Entertainment Business Act). It governs arcade operations, opening hours and age limits for some game types. Prize games must also follow industry guidelines, such as JAIA’s prize-provision guidelines, which set limits on prize value. Venues serving children must meet national child safety and fire safety standards, enforced by prefectures. Venues in major cities may also need local licences, which vary by municipality. These compliance costs weigh more heavily on small single-site operators than on large chains with dedicated compliance teams.
Venues serving foreign tourists must follow consumer protection and multilingual information rules, which the government has tightened as visitor numbers rise above pre-pandemic levels. No recent rule change has fundamentally altered venue economics. However, safety certification and energy-efficiency rules for large electrical equipment are likely to raise compliance costs over the forecast period.
Investment and White Space Analysis
Investment is concentrating in four areas:
- Large destination venues in Kanto and Kansai, such as PokéPark KANTO
- Airport and station kids’ parks, such as Kinder Platz at Narita
- AR/VR upgrades inside existing mid-sized venues
- Arcade acquisitions, led by GENDA
The white space with the best risk-adjusted return is adult co-play and multigenerational family venues. This format tackles the demographic challenge directly by widening the paying audience beyond school-age children. No dominant operator has fully committed to it at scale, which leaves room for a specialist or second-tier operator to lead the category.
Underserved regions include Tohoku, Shikoku and smaller Chugoku cities outside Hiroshima. Their low venue density relative to population means a well-funded mid-sized operator could win above-average share with little competition. Kansai remains the most attractive entry market, thanks to strong tourism and continued investment.
Analyst View
- The market can grow at 7.8% a year even with fewer children, because spending per visit is rising faster than the child population is falling.
- Japan’s age pyramid will reduce the number of teenagers by 2035, so operators must widen their audience to adults and multigenerational groups.
- AR/VR zones (11.2% CAGR) and food and beverages (9.2% CAGR) are the strongest growth areas within venues.
- Consolidation will continue as large groups such as GENDA acquire smaller arcade operators.
- Kansai (9.1% CAGR) is the most attractive region for new investment, supported by tourism and Universal Studios Japan’s reported expansion plans.
Report Scope
| Report Characteristics | Details |
|---|---|
| Market Value (2026) | USD 1.19 Billion |
| Forecast Revenue (2035) | USD 2.33 Billion |
| CAGR (2026 to 2035) | 7.8% |
| Base Year for Estimation | 2025 |
| Historic Period | 2020 to 2024 |
| Forecast Period | 2026 to 2035 |
| Report Coverage | Revenue Forecast, Market Dynamics, Competitive Landscape, Recent Developments |
| Segments Covered | By Visitor Demographics (Families with Children 0–9, Families with Children 9–12, Teenagers 12–18, Young Adults 18–24, Adults 24+), By Facility Size (Up to 5,000 Sq. Ft, 5,001–10,000 Sq. Ft, 10,001–20,000 Sq. Ft, 20,001–40,000 Sq. Ft, 1–10 Acres, 11–30 Acres, Over 30 Acres), By Revenue Source (Entry Fees and Ticket Sales, Food and Beverages, Merchandising, Advertising, Others), By Activity Area (Arcade Studios, AR and VR Gaming Zones, Physical Play Activities, Skill/Competition Games, Others) |
| Regions Covered | Kanto, Kansai/Kinki, Central/Chubu, Kyushu-Okinawa, Tohoku, Chugoku, Hokkaido, Shikoku |
| Competitive Landscape | Bandai Namco Holdings Inc., GENDA GiGO Entertainment Inc. (formerly SEGA Entertainment), GENDA Inc., Round One Corporation, Cosmos Hotel Management Co., Ltd. (ANO-NE Kids Club), COSMOS INITIA Co., Ltd., Namco Funscape, Sega Sammy Holdings, KidZania, Merlin Entertainments Limited (LEGOLAND Discovery Center), The Pokémon Company, The Walt Disney Company, Toei Animation Co., Ltd., Toei Company Ltd., Shochiku Co., Ltd., Tohokushinsha Film Corp., Avex Inc., IG Port Inc., Tokyu Recreation Co., Ltd., Timezone Group, Dave & Buster’s Entertainment Inc., CEC Entertainment Concepts L.P. |
| Customization Scope | Customization for segments and region or country level will be provided. Additional customization can be done based on requirements. |
| Purchase Options | Three license options: Single User License, Multi-User License (Up to 5 Users), Corporate Use License (Unlimited Users and Printable PDF) |
Recent Developments
- August 2026: Universal Studios Japan was reported to be preparing a ¥200–300 billion expansion on a 60,000-square-metre site next to the existing park, aiming to raise yearly attendance above 16 million. Universal Destinations & Experiences said it had not confirmed the plan.
- 13 May 2026: Bandai Namco Holdings reported Amusement segment sales of ¥152.7 billion for the year to March 2026, with existing-store sales in Japan up 7.0%.
- 13 May 2026: Round One Corporation reported record revenue of ¥189.5 billion (+7.1%) for the year to March 2026 and plans to reach 172 stores by March 2027.
- 27 April 2026: Bandai Namco turned its paid “Asobi Park” at namco Aeon Mall Ogaki into a free indoor play area, “Oogaki Kids”.
- April 2026: Narita International Airport completed a ¥2.5 billion renovation of Terminal 1’s fifth floor, covering about 5,000 square metres indoors and 3,000 square metres of observation deck. It added Kinder Platz, a paid children’s park for ages 6 months to 12 years, priced at ¥2,200 per child and ¥1,100 per adult including tax. The area also includes 130 seats, three footbaths and a digital bamboo-grove artwork.
- March 2026: GENDA reported consolidated sales of ¥170.7 billion (+52.7%) for the year to January 2026, after acquiring arcade operators Harrows, Ewing and Game Goose.
- 5 February 2026: The Pokémon Company opened PokéPark KANTO, the world’s first permanent outdoor Pokémon attraction, on 26,000 square metres at Yomiuriland in Tokyo. Tickets sold out for the first two months.





































