
Global Marine Power Market Size, Share Analysis Report By Type (Wave Energy, Tidal Energy, Ocean Thermal Energy Conversion (OTEC), Salinity Gradient Power (SGP)), By Application (Power Generation, Desalination, Hydrogen Production, Others) , By Region and Companies - Industry Segment Outlook, Market Assessment, Competition Scenario, Trends and Forecast 2025-2034
- Published date: Nov 2025
- Report ID: 164714
- Number of Pages: 242
- Format:
-
keyboard_arrow_up
Quick Navigation
Report Overview
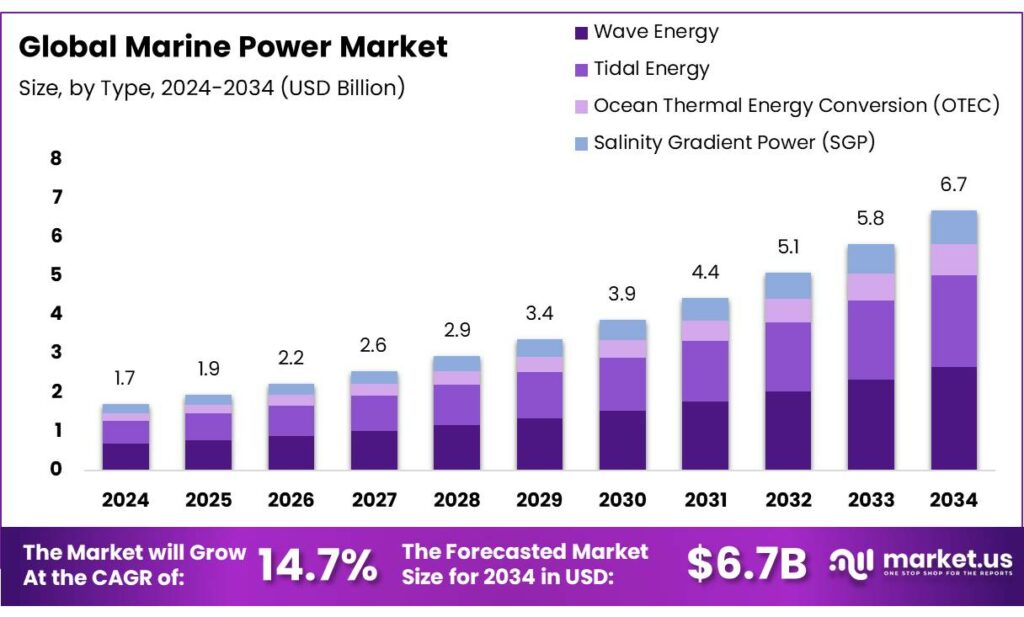
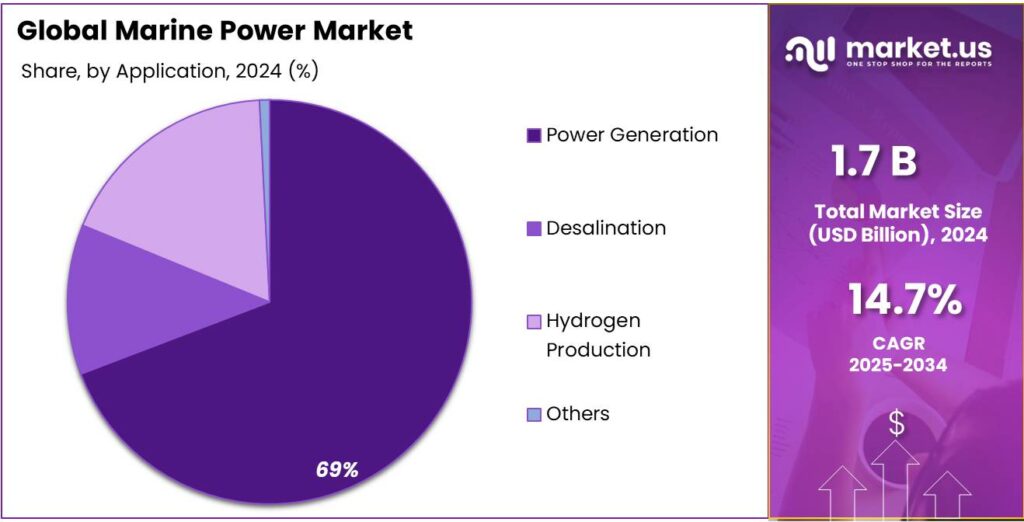
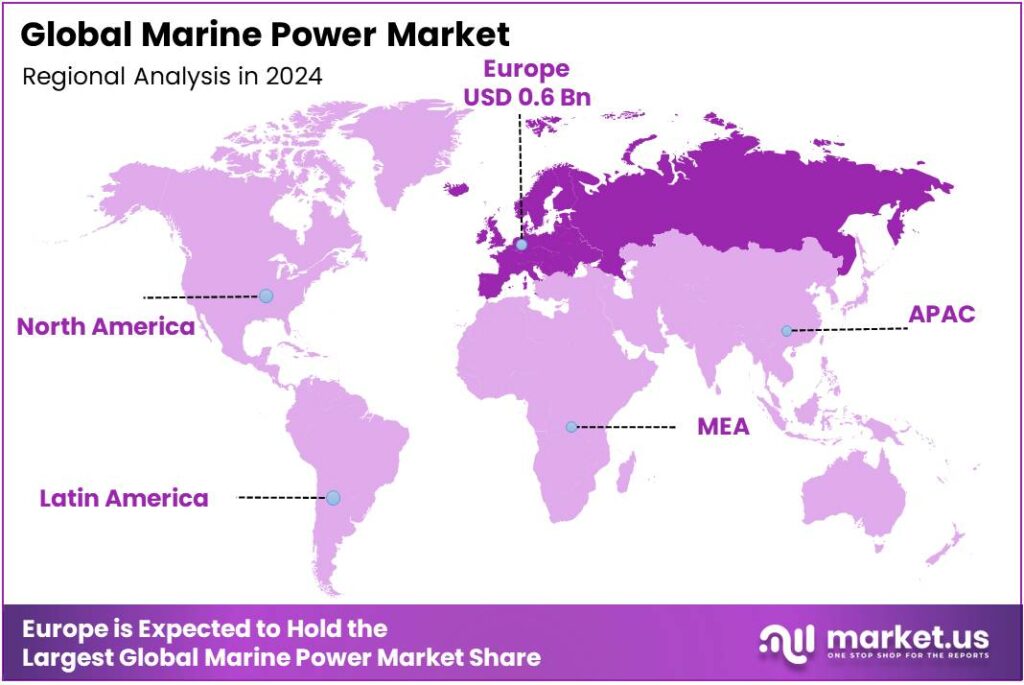
The Global Marine Power Market size is expected to be worth around USD 6.7 Billion by 2034, from USD 1.7 Billion in 2024, growing at a CAGR of 14.7% during the forecast period from 2025 to 2034. In 2024 Europe held a dominant market position, capturing more than a 38.8% share, holding USD 0.6 Billion in revenue.
Marine power—covering tidal range, tidal stream, wave, and ocean thermal technologies—is a tiny but strategic slice of the global renewables mix. By end-2024, cumulative ocean-energy capacity reached an estimated 494 MW worldwide, dominated by early tidal-range schemes. The two flagship tidal-barrage plants—Sihwa Lake in South Korea and La Rance in France alone account for ~96% of 2023’s installed base, underscoring how the industry is still transitioning from demonstrators to bankable arrays.
- The EU’s offshore strategy targets 86–89 GW of offshore renewables by 2030 and 355–366 GW by 2050, signalling long-run grid integration and transmission build-out in the North and Baltic Seas, Atlantic and Mediterranean.
In September 2024, the UK’s Contracts for Difference (AR6) awarded multiple tidal-stream projects, including HydroWing and additional Scottish projects such as MeyGen, Seastar, Magallanes and Ocean Star, signalling an investable route to market. At the EU level, the Offshore Renewable Energy Strategy sets indicative goals of 1 GW of ocean energy by 2030 and 40 GW by 2050, framing a long-term demand signal for European supply chains.
Resource potential is the sector’s central driver. The United States alone has an estimated theoretical wave-energy potential of up to 2.64 trillion kWh per year—equivalent to about 63% of 2023 U.S. utility-scale generation—highlighting the scale that could be unlocked as technologies mature and costs fall. Globally, IRENA and Ocean Energy Europe estimate ocean energy could reach 350 GW by 2050, reflecting strong long-run technical potential once learning curves and deployment volumes materialize.
Government initiatives are accelerating commercialization. Beyond the UK CfD pathway, the European Commission approved an Italian scheme supporting up to 4.6 GW of innovative renewables—including tidal and wave—through 2028, widening the funding base for pre-commercial technologies. The EU’s broader renewable framework, with a legally binding target of at least 42.5% renewables in final energy by 2030, is pushing member states to diversify beyond wind/solar—creating policy space for marine pilots and hybrids at ports, islands, and remote grids.
Policy and funding momentum is strong. Public investment in ocean energy reached USD 710 million in 2023, supporting demonstration arrays and test sites. In the United States, DOE’s Water Power Technologies Office set a USD 141 million FY-2024 budget for marine energy R&D—including facility upgrades—marking a program high that underwrites device testing, environmental monitoring and grid integration studies.
- For offshore wind in deep waters, the U.S. Floating Offshore Wind Shot targets a >70% cost reduction to USD 45/MWh by 2035 and 15 GW of floating capacity by 2035, catalysing supply chains for moorings, dynamic cables and floating substructures.
Key Takeaways
- Marine Power Market size is expected to be worth around USD 6.7 Billion by 2034, from USD 1.7 Billion in 2024, growing at a CAGR of 14.7%.
- Wave energy segment secured a dominant position with 39.9% of the overall marine power market.
- Power Generation held a dominant market position, capturing more than a 69.2% share.
- Europe retained a leading position in the marine power market, accounting for 38.8% of regional share and an estimated market value of USD 0.6 billion.
By Type Analysis
Wave Energy leads with 39.9% share in 2024 due to its strong coastal potential and growing device deployment.
In 2024, the wave energy segment secured a dominant position with 39.9% of the overall marine power market by type. This was driven by its viability in numerous coastal regions that allow for consistent energy extraction from sea-surface waves. The segment benefitted from recent improvements in converter technology and accelerating interest from utility and industrial customers seeking diversified renewables.
Year-by-year, the wave energy segment showed steady positioning. In 2023 it was estimated to hold around 40% of the market by type. In 2024 it held 39.9%, maintaining its leadership. Looking ahead to 2025 and beyond, the share is projected to increase modestly as cost curves improve and more commercial-scale projects come online.
By Application Analysis
Power generation dominates with 69.2% owing to its central role in grid decarbonisation.
In 2024, Power Generation held a dominant market position, capturing more than a 69.2% share. This leadership can be attributed to the segment’s direct alignment with national decarbonisation targets and the suitability of marine technologies for providing predictable baseload and complementing intermittent renewables. Deployment choices were influenced by project economics that favour electricity output streams, the availability of grid-connection points in coastal regions, and targeted public investments that prioritised utility-scale generation. The 2024 share of 69.2% therefore reflects the concentration of developer focus on electricity production rather than ancillary or niche uses.
The Power Generation application retained a stable pre-eminence through 2024, supported by incremental capacity additions and demonstration projects designed to validate long-duration, grid-compatible output. For 2025, the application is expected to remain the primary demand driver as commercialisation pathways mature and regulatory frameworks continue to favour firm low-carbon generation; s zuch conditions are likely to sustain high allocation of industry resources toward electricity delivery rather than non-generation uses.
Key Market Segments
By Type
- Wave Energy
- Tidal Energy
- Ocean Thermal Energy Conversion (OTEC)
- Salinity Gradient Power (SGP)
By Application
- Power Generation
- Desalination
- Hydrogen Production
- Others
Emerging Trends
Blue-Food, Blue-Energy Hubs at Working Waterfronts
A striking new trend is the pairing of marine power with the fast-growing blue-food economy—electrifying fishing harbors, aquaculture parks, and seafood cold chains with offshore wind, tidal, and wave energy landing directly at ports. The pull factor is scale: the UN Food and Agriculture Organization (FAO) reports global fisheries and aquaculture output hit a record 223.2 million tonnes in 2022, while apparent per-capita fish consumption reached 20.7 kg—demand that concentrates power-hungry freezers, ice plants, and processing lines at the water’s edge.
Policy is now catching up and explicitly linking food-system resilience to clean energy at sea. In Europe, the Commission’s package on the energy transition in fisheries and aquaculture lays out 27 actions and a pathway toward a climate-neutral sector by 2050, including electrifying harbors, deploying renewables near working waterfronts, and modernizing vessels and shoreside infrastructure—clear signals for landing offshore power where seafood value chains need it most.
The broader EU blue economy is substantial enough to anchor bankable offtake: it generated about €263 billion in gross value added and 4.9 million jobs in 2023, underscoring the demand base for shore-power berths, chilled-storage parks, and seawater-source heating/cooling fed by marine renewables.
On the technology-readiness side, governments are directing fresh capital to close the last-mile gap from prototypes to commercial arrays located near ports. In the United States, the Department of Energy opened an opportunity of up to USD 112.5 million for open-water wave-energy testing and validation—funding designed to accelerate devices that can interconnect with coastal microgrids serving aquaculture and cold storage.
Drivers
Decarbonising Seafood Cold Chains & Aquaculture Hubs
A powerful—often overlooked—driver for marine power is the rising energy demand from seafood cold chains and fast-growing aquaculture clusters along coasts and islands. The UN Food and Agriculture Organization (FAO) reports global fisheries and aquaculture production hit 223.2 million tonnes in 2022, the highest on record and up 4.4% from 2020, underscoring surging throughput that must be chilled, processed, and moved reliably.
For the first time in history, aquaculture became the main source of aquatic animals: FAO’s SOFIA 2024 shows aquaculture provided 51% of aquatic animal output in 2022, tipping the sector decisively toward farmed fish that rely on grid-connected hatcheries, recirculating systems, feed mills, ice plants, and processing lines.
Energy intensity peaks at the processing stage. FAO technical work finds that in fish-processing facilities freezing accounts for ~45% of energy use, with cold storage (~12%) and ice making (~11%) also significant—operations that map perfectly to predictable, near-shore renewable supply from tidal and wave devices and to high-capacity offshore wind interconnections.
Where cold chains are weak, losses rise. FAO’s value-chain analysis notes discard rates of 9–15% of marine catches in industrialized regions and 6–8% in developing countries at the primary production stage, and it highlights quality deterioration during cold storage as a major cause of waste—both pointing to the need for reliable, low-carbon power at ports and landing sites.
Restraints
Sea-space Conflicts with Fisheries and Working Waterfronts
A central brake on marine power is the hard reality that coastal waters are already crowded with people who make their living at sea. The UN Food and Agriculture Organization (FAO) estimates 61.8 million people worked in the primary fisheries and aquaculture sector in 2022—a vast constituency with daily operational needs and limited tolerance for closures, rerouting, or seasonal exclusion zones around turbines, cables, and construction vessels. That social and economic footprint is carried by an equally large fleet: FAO counts ~3.3 million fishing vessels worldwide in 2022, underscoring how many boats may be affected when new offshore wind or wave arrays are mapped onto traditional grounds.
These pressures intensify in regions with dense fishing activity and formal management plans. In the European Union, about 157,000 people were employed in the primary fisheries industry in 2022, with aquaculture accounting for roughly a third—meaning both capture and farm operators have a direct stake in how sea space is allocated and how transit is maintained around new energy assets. EU fleets landed ~3.4 million tonnes in 2022, a scale that depends on predictable access to productive grounds and unhindered routes to port—both of which may be disrupted by poorly coordinated construction schedules or blanket safety buffers.
The conflict also touches food security and loss. FAO calculates that ~8% of fish caught is discarded at sea—about 7.5 million tonnes per year, valued at roughly USD 22.5 billion at first-sale prices. During construction peaks, temporary displacement or congestion near landings can aggravate handling times and chilling logistics, risking additional quality loss unless mitigation is in place.
A credible path forward blends marine spatial planning, shared data portals for gear-safe transit, and co-designed monitoring that reflects local fleet structures. The employment base—61.8 million people globally—explains why social license is a gating item, not a box-tick. When regulators incorporate EU-level employment and catch data into impact assessments and compensation protocols, opposition tends to ease, but timelines still lengthen versus greenfield onshore projects.
Opportunity
Powering Low-Carbon Seafood Hubs with Marine Energy
There is a clear growth lane for marine power in serving the fast-expanding seafood economy—especially aquaculture parks, fish-handling quays, and cold-chain clusters along coasts and islands. Global fisheries and aquaculture production reached a record 223.2 million tonnes in 2022, while apparent per-capita consumption climbed to 20.7 kg—a sustained demand signal for reliable, affordable energy at the water’s edge.
For the first time in history, aquaculture became the main source of aquatic animals; FAO data show aquaculture contributed 130.9 million tonnes and 51% of aquatic animal output in 2022—concentrated in Asia’s coastal belts where grid access is tight and diesel remains common.
Cutting losses is not only a climate and affordability win; it is an economic imperative. FAO estimates around 8% of fish caught is discarded at sea—about 7.5 million tonnes annually—worth roughly USD 22.5 billion at first-sale prices; better siting of marine energy near ports can stabilize handling and chilling so more catch becomes saleable product.
Government policy now openly links food-system resilience with clean energy at sea—another tailwind for project pipelines. In Europe, the Commission’s Energy Transition in EU Fisheries and Aquaculture action plan sets a vision for climate-neutral fisheries by 2050 with 27 actions spanning finance, skills, and innovation—creating a framework for electrifying harbors, integrating renewables, and piloting battery-hybrid fleets.
Public investment is accelerating technology readiness on the energy side as well. In the United States, the Department of Energy opened a funding call of up to USD 112.5 million to move wave-energy devices through open-water testing and validation—support that directly benefits coastal demonstration sites near working waterfronts.
Regional Insights
Europe leads with a 38.8% share and a €0.6 billion market value.
In 2024, Europe retained a leading position in the marine power market, accounting for 38.8% of regional share and an estimated market value of €0.6 billion, reflecting concentrated deployment and sustained public support.
The region’s progress has been evidenced by cumulative electricity production reaching 106 GWh by 2024, which underlines improving technology reliability and the transition from pilots to larger demonstrations. Public funding and targeted grants have been decisive: European public support rose substantially in recent years with headline programmes and national allocations combining to create an accelerated pipeline and lower technology risk.
Key Regions and Countries Insights
- North America
- US
- Canada
- Europe
- Germany
- France
- The UK
- Spain
- Italy
- Rest of Europe
- Asia Pacific
- China
- Japan
- South Korea
- India
- Australia
- Rest of APAC
- Latin America
- Brazil
- Mexico
- Rest of Latin America
- Middle East & Africa
- GCC
- South Africa
- Rest of MEA
Key Players Analysis
Ocean Power Technologies (OPT): Founded in 1984 and headquartered in New Jersey, OPT develops its flagship PowerBuoy® system which harnesses ocean waves (and increasingly integrates solar/wind) to produce low-carbon power and provide remote maritime infrastructure support. In May 2024 the company reported approaching 15 MWh of cumulative renewable energy production via PowerBuoys in multiple seas.
CorPower Ocean: Swedish company founded in 2012 that uses a heart-inspired pumping principle for its wave energy converters (WECs). Its “CorPack” clusters (10-30 MW scale) are intended as building blocks for utility-scale wave farms. It currently has three major wave farm projects and has secured more than €115 million funding.
Seabased AB: Swedish wave energy firm with a pipeline exceeding €500 million (≈214 MW) and over 300 patents worldwide. Its wave power parks are designed to operate in harmony with marine ecosystems and to deliver continuous grid-stable electricity.
Top Key Players Outlook
- Ocean Power Technologies
- Minesto AB
- Carnegie Clean Energy
- CorPower Ocean
- Ocean Renewable Power Company
- Seabased
- BioPower Systems
- Magallanes Renovables
- Orbital Marine Power
- Oscilla Power, Inc.
Recent Industry Developments
In 2024 Minesto AB, reported total operating income of SEK 33,035 thousand, net sales of SEK 75 thousand, and a net loss of SEK –36,104 thousand.
In 2024 Seabased AB, signed memoranda of understanding (MOUs) for projects of 10+ MW in Barbados, 40 MW in Bermuda and 50 MW in Martinique.
Report Scope
Report Features Description Market Value (2024) USD 1.7 Bn Forecast Revenue (2034) USD 6.7 Bn CAGR (2025-2034) 14.7% Base Year for Estimation 2024 Historic Period 2020-2023 Forecast Period 2025-2034 Report Coverage Revenue Forecast, Market Dynamics, Competitive Landscape, Recent Developments Segments Covered By Type (Wave Energy, Tidal Energy, Ocean Thermal Energy Conversion (OTEC), Salinity Gradient Power (SGP)), By Application (Power Generation, Desalination, Hydrogen Production, Others) Regional Analysis North America – US, Canada; Europe – Germany, France, The UK, Spain, Italy, Rest of Europe; Asia Pacific – China, Japan, South Korea, India, Australia, Singapore, Rest of APAC; Latin America – Brazil, Mexico, Rest of Latin America; Middle East & Africa – GCC, South Africa, Rest of MEA Competitive Landscape Ocean Power Technologies, Minesto AB, Carnegie Clean Energy, CorPower Ocean, Ocean Renewable Power Company, Seabased, BioPower Systems, Magallanes Renovables, Orbital Marine Power, Oscilla Power, Inc. Customization Scope Customization for segments, region/country-level will be provided. Moreover, additional customization can be done based on the requirements. Purchase Options We have three licenses to opt for: Single User License, Multi-User License (Up to 5 Users), Corporate Use License (Unlimited User and Printable PDF) 
-
-
- Ocean Power Technologies
- Minesto AB
- Carnegie Clean Energy
- CorPower Ocean
- Ocean Renewable Power Company
- Seabased
- BioPower Systems
- Magallanes Renovables
- Orbital Marine Power
- Oscilla Power, Inc.
Our Clients
- 164714
- Nov 2025


