


Report Overview
Global High Performance Truck Market size is expected to be worth around USD 235.54 Billion by 2035 from USD 115.94 Billion in 2025, growing at a CAGR of 7.33% during the forecast period 2026 to 2035.
The high performance truck market covers heavy duty, medium duty, light duty and pickup trucks engineered for elevated power output, towing capacity and payload demands. This means the market spans propulsion types, power bands and application categories that serve freight, construction and consumer off-road use cases. Buyers select vehicles based on horsepower, torque and drivetrain configuration rather than price alone, which keeps engineering investment concentrated at the top of each vehicle class.
Key Takeaways
- Global High Performance Truck Market size is valued at USD 115.94 Billion in 2025 and is projected to reach USD 235.54 Billion by 2035, growing at a CAGR of 7.33%.
- Heavy Duty Trucks lead the Vehicle Type segment with a 49.00% share, while Pickup Trucks post the fastest growth.
- Internal Combustion Engine trucks dominate the Propulsion segment with a 75.20% share, while Battery Electric trucks are the fastest growing propulsion type.
- The 250 to 400 HP band leads the Power Output segment with a 44.50% share, while trucks above 400 HP grow fastest.
- Long Haul Freight leads the Application segment with a 39.00% share, while Refrigeration is the fastest growing application.
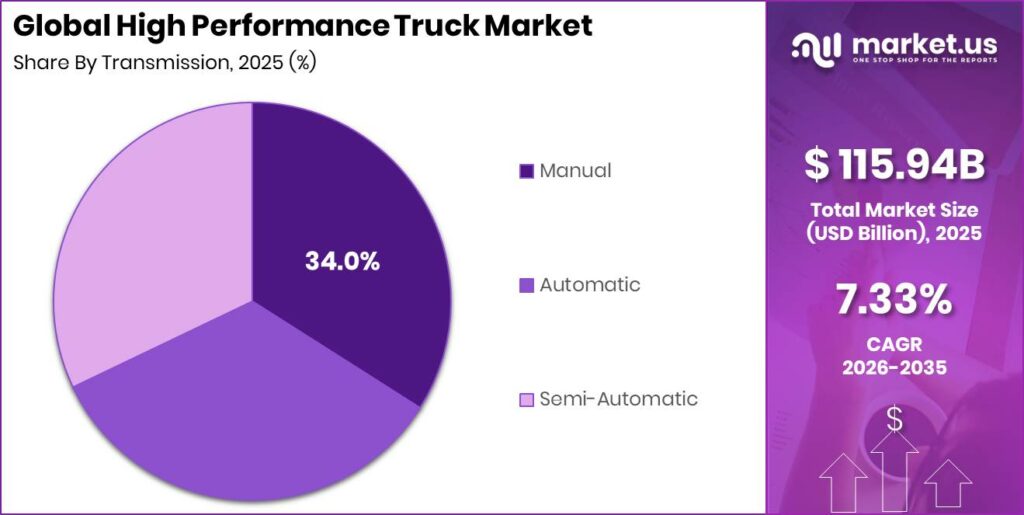
- Manual transmissions lead the Transmission segment with a 34.00% share, while Automatic transmissions grow fastest.
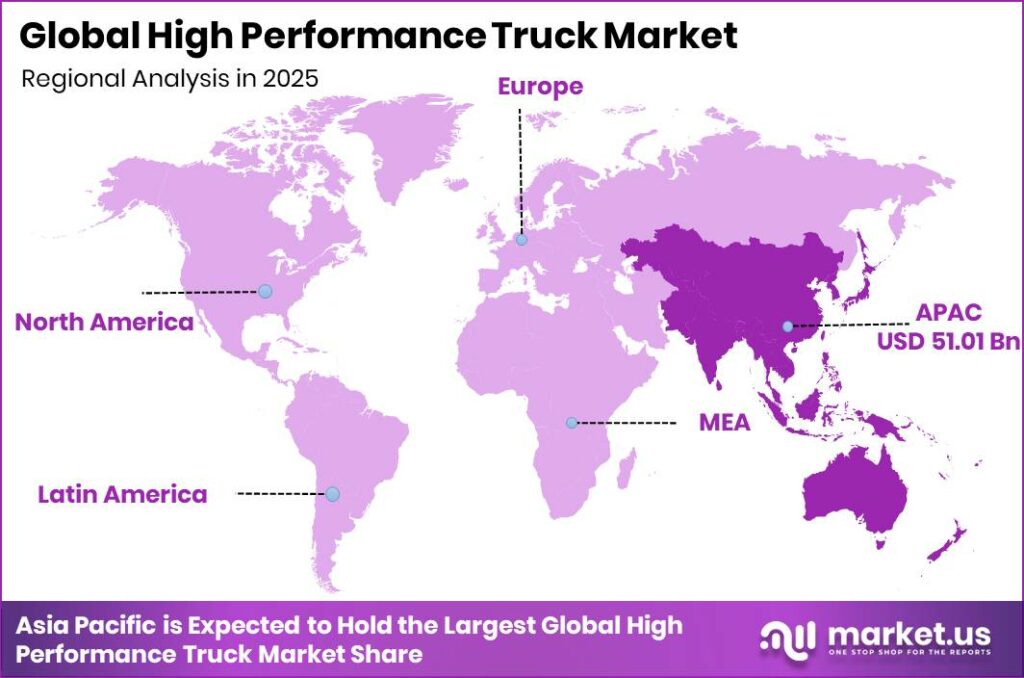
- Asia Pacific dominates the regional landscape with a 44.00% share, valued at USD 51.01 Billion.
Regulatory bodies are reshaping product design cycles across this market. Governments in North America and Europe are tightening emissions rules while incentivizing zero-emission adoption, which pushes manufacturers to redesign powertrains faster than typical model cycles allow. Consequently, end-use freight and construction demand growth is translating directly into orders for higher output engines and reinforced drivetrains across every truck class.
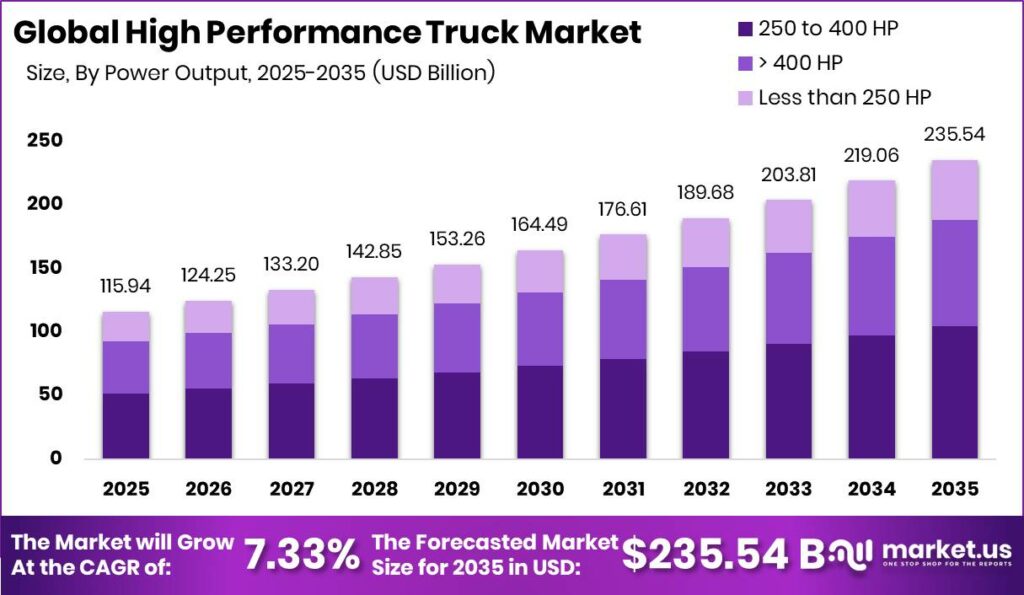
In a 2025 Commercial Motor test cited by Volvo, the Volvo FH Aero achieved 11.25 mpg at a 44 tonne gross combination weight, nearly 15% better than its prior result. This efficiency gain lowers total cost of ownership for fleet buyers and pressures rival OEMs to match fuel performance or lose long haul contracts. This reflects a broader shift toward warranty backed reliability, as select 2026 Ram trucks now carry a 10 year or 100,000 mile powertrain warranty, meaning buyers increasingly weigh coverage length alongside horsepower when comparing platforms.
Vehicle Type Analysis
Heavy Duty Trucks dominates with 49.00% due to concentrated long haul freight ownership.
In 2025, Heavy Duty Trucks held a dominant market position in the By Vehicle Type segment of High Performance Truck Market, with a 49.00% share. As reported by Ford’s technical specification sheet, the 2025 Ford Ranger Raptor carries a 6,790 lb gross vehicle weight rating and 5,510 lb towing capacity, a configuration class also used across heavy duty freight builds. Fleet operators favor this class for hauling density. Manufacturers investing in heavy duty platforms secure the largest addressable procurement pool across freight corridors.
Pickup Trucks serve consumer and light commercial buyers seeking off-road capability alongside daily usability. Ford’s 2025 Ranger Raptor uses a twin-turbocharged 3.0 litre V6 producing 405 hp per Ford’s published technical specifications. This means pickup buyers now expect performance parity with dedicated heavy duty units. Rising performance expectations push OEMs to invest in pickup-specific engineering that trims development budgets from other vehicle classes.
Medium Duty Trucks bridge urban distribution and regional haul work where maneuverability outweighs raw payload. These trucks typically carry lower gross combination weight ratings than heavy duty units, which limits their use in long haul freight. Fleet buyers in this class prioritize turning radius and fuel economy over towing capacity, shaping a distinct purchasing pattern from heavy duty operators seeking maximum trailer capacity.
Light Duty Trucks round out the segment, serving last mile delivery and small business applications. Tesla began high volume production of the Class 8 electric Tesla Semi at its Nevada facility in April 2026, signaling that electrification pressure extends beyond heavy duty into lighter classes. Light duty buyers increasingly weigh electrification alongside traditional payload metrics when selecting platforms, narrowing the gap with combustion incumbents.
Propulsion Analysis
Internal Combustion Engine (ICE) dominates with 75.20% due to established fueling and service infrastructure.
In 2025, Internal Combustion Engine (ICE) held a dominant market position in the By Propulsion segment of High Performance Truck Market, with a 75.20% share. Toyota’s 2025 Tacoma non-hybrid engine produces up to 278 hp, illustrating continued ICE investment even in mixed powertrain lineups. Established refueling networks keep ICE the default choice for long haul operators. This dominance gives OEMs a durable revenue base while electrification scales gradually across other propulsion types.
Battery Electric trucks represent the fastest growing propulsion type as regulatory pressure mounts. The 2026 Chevrolet Silverado EV delivers up to 478 miles of estimated range per Chevrolet’s published specifications. This range figure narrows the gap with ICE trucks on long routes. Fleet operators evaluating electrification now face a smaller efficiency penalty, accelerating pilot programs among cost sensitive buyers weighing total cost of ownership.
Hybrid Electric trucks offer a transitional option for buyers unwilling to commit fully to battery power. Toyota’s 2025 Tacoma i-FORCE MAX hybrid generates 326 hp and achieves an EPA estimated 24 mpg combined. This combination allows manufacturers to market performance and efficiency simultaneously. Buyers gain a lower risk entry point into electrified powertrains without range anxiety concerns limiting adoption elsewhere.
Plug-in Hybrid Electric, Hydrogen Fuel Cell Electric and Alternative Fuel platforms, including CNG, LNG and biofuels, collectively hold the remaining share of the propulsion segment as niche compliance requirements and regional fuel availability continue to shape their gradual adoption curve.
Power Output Analysis
250 to 400 HP dominates with 44.50% due to balanced towing and fuel efficiency needs.
In 2025, 250 to 400 HP held a dominant market position in the By Power Output segment of High Performance Truck Market, with a 44.50% share. Ford’s 2025 Ranger Raptor produces 405 hp and 430 lb-ft of torque with a 10.5:1 compression ratio. This band balances towing capability against fuel consumption. Manufacturers targeting this range capture the broadest buyer pool across commercial and consumer segments, keeping production runs efficient.
Above 400 HP trucks post the fastest growth as buyers demand higher towing and payload margins. Scania’s 500 P Super engine uses a 12.74 litre six cylinder Euro 6 block producing 500 hp and 2,650 Nm of torque between 900 and 1,320 rpm, per Scania’s newsroom specifications. This output level supports heavier trailer configurations. Fleet operators moving into this bracket gain routing flexibility, prompting OEMs to expand their high output engine lineups further.
Less than 250 HP trucks serve buyers prioritizing purchase price and operating cost over raw capability. These platforms typically pair smaller displacement engines with lighter chassis construction, which reduces fuel consumption per mile. Cost focused fleets and light commercial buyers anchor demand for this power band across regional and last mile distribution roles.
Application Analysis
Long-Haul Freight dominates with 39.00% due to concentrated interstate freight volume.
In 2025, Long-Haul Freight held a dominant market position in the By Application segment of High Performance Truck Market, with a 39.00% share. Scania’s Super powertrain delivers 8% fuel savings in heavy duty operations per Scania’s product documentation. Fuel efficiency directly affects margins on long distance routes. Fleet operators running interstate lanes prioritize this application above all others when specifying new trucks for their networks.
Refrigeration applications post the fastest growth as cold chain logistics expand across grocery and pharmaceutical distribution. This application demands sustained auxiliary power for temperature control units beyond standard drivetrain output. Rising cold chain volume increases demand for trucks with dedicated power take-off capacity, creating a distinct specification requirement from dry freight haulers competing for the same chassis platforms.
Dumping, Construction and Mining, and Distribution applications each serve buyers with load cycle and terrain requirements distinct from long haul freight. Construction and mining operators prioritize payload durability over fuel economy, while distribution fleets favor maneuverability for urban delivery routes, together forming a stable secondary demand base for OEMs.
Transmission Analysis
Manual dominates with 34.00% due to lower upfront cost and simpler maintenance.
In 2025, Manual held a dominant market position in the By Transmission segment of High Performance Truck Market, with a 34.00% share. Manual gearboxes remain popular among cost conscious operators in developing freight markets. Lower component complexity reduces repair costs over a truck’s service life. Fleets operating in regions with limited service networks favor manual systems for their mechanical simplicity and lower parts dependency.
Automatic transmissions post the fastest growth as driver comfort and reduced training requirements gain priority. Automated systems reduce driver fatigue on long haul routes, which supports retention amid persistent driver shortages. Fleet buyers increasingly specify automatic transmissions to widen their pool of eligible operators beyond those trained on manual systems, easing recruitment pressure across the industry.
Semi-Automatic transmissions occupy a middle position, offering manual style control with reduced clutch operation demands. This configuration appeals to operators transitioning fleets away from fully manual systems without committing to full automation costs, balancing driver preference against total fleet modernization budgets over multi-year replacement cycles.
Key Market Segments
By Vehicle Type
- Heavy-Duty Trucks
- Pickup Trucks
- Medium-Duty Trucks
- Light-Duty Trucks
By Propulsion
- Internal Combustion Engine (ICE)
- Battery Electric
- Hybrid Electric
- Plug-in Hybrid Electric
- Hydrogen Fuel Cell Electric
- Alternative Fuel (CNG, LNG, and Biofuels)
By Power Output
- 250 to 400 HP
- > 400 HP
- Less than 250 HP
By Application
- Long-Haul Freight
- Dumping
- Refrigeration
- Construction & Mining
- Distribution
By Transmission
- Manual
- Automatic
- Semi-Automatic
Regional Analysis
Asia Pacific Dominates the High Performance Truck Market with a Market Share of 44.00%, Valued at USD 51.01 Billion
Asia Pacific leads the global market with a 44.00% share, valued at USD 51.01 Billion in 2025. Concentrated freight volume and manufacturing capacity across the region support sustained truck procurement. This concentration gives regional OEMs pricing leverage over global competitors entering the market and reinforces localized supply chains for engines and drivetrains.
North America stands out as the fastest-recovering region. Volvo Group reported that North American order intake for Volvo trucks rose 78% and for Mack trucks rose 86% in the first quarter of 2026 compared with the same period a year earlier. This order surge signals renewed fleet confidence following prior freight softness. Therefore, North America’s rebounding order books position the region as an emerging growth contributor alongside Asia Pacific’s established manufacturing scale.
Europe and remaining regions continue contributing incremental share through regulatory-driven replacement cycles and infrastructure investment. This reflects steady baseline demand outside the two leading regions, even without additional disclosed percentage or valuation figures for these markets in the current dataset.
Key Regions and Countries
North America
- US
- Canada
Europe
- Germany
- France
- The UK
- Spain
- Italy
- Rest of Europe
Asia Pacific
- China
- Japan
- South Korea
- India
- Australia
- Rest of APAC
Latin America
- Brazil
- Mexico
- Rest of Latin America
Middle East and Africa
- GCC
- South Africa
- Rest of MEA
Market Dynamics
Market Opportunity Analysis - Underserved power bands, cold chain freight and secondary regions offer clear entry points
The Less than 250 HP power band remains underexploited relative to the dominant 44.50% share held by 250 to 400 HP trucks. This signals a gap for entrants targeting cost sensitive fleets. Instead of competing head on with premium output platforms, new players can build entry level engines that undercut established OEMs on purchase price while still meeting basic hauling needs.
Refrigeration applications, the fastest growing use case within the Application segment, remain smaller than Long-Haul Freight’s 39.00% share. This reflects room for specialized cold chain truck builders to establish themselves before larger OEMs commit dedicated production lines. Early movers in this application can capture brand loyalty among grocery and pharmaceutical logistics operators expanding distribution networks.
Semi-Automatic transmissions occupy the smallest disclosed share within the Transmission segment. This creates an opening for suppliers offering hybrid shift systems to fleets transitioning away from Manual’s 34.00% hold without full automatic conversion costs. Component makers targeting this middle tier can secure contracts before automatic transmissions fully displace manual demand across price sensitive fleets.
Regions outside Asia Pacific’s 44.00% lead remain comparatively underexploited despite North America’s order intake rebound. This means investors focused on secondary regional buildout can enter ahead of broader OEM expansion into these growing but currently smaller markets.
Technology and Innovation Landscape - Powertrain efficiency and range gains define competitive edges
Scania’s Super powertrain delivers 8% fuel savings in heavy duty operations, a direct efficiency gain that lowers fleet operating costs. This means manufacturers lacking comparable powertrain efficiency face pressure to match savings or lose long haul contracts to Scania equipped fleets. Fuel efficiency has become a primary purchase criterion alongside raw power output across freight operators.
The 2026 Chevrolet Silverado EV offers up to 478 miles of estimated range, narrowing the gap between electric and combustion trucks. Therefore, fleet buyers testing electrification face less range anxiety than earlier electric truck generations, accelerating pilot adoption among cost conscious operators exploring zero emission options for their networks.
Available 350 kilowatt DC fast charging lets the Silverado EV add an estimated 74 to 120 miles of range in just 10 minutes. This charging speed reduces downtime concerns that previously discouraged fleet electrification. Manufacturers without comparable fast charging support risk losing electrification minded buyers to Chevrolet’s growing electric lineup.
Scania’s 500 P Super engine produces 500 hp and 2,650 Nm of torque from a 12.74 litre six cylinder Euro 6 unit operating between 900 and 1,320 rpm. This output level supports heavier trailer loads without a full platform redesign. Manufacturers matching this displacement to power ratio gain a template for scaling output across their own heavy duty lineups.
Market Drivers
| Driver | (~) % Impact on CAGR Forecast | Geographic Relevance | Impact Timeline |
|---|---|---|---|
| Pre-Buy Ahead of 2027 NOx Standards | +2.4% | North America | Short term (2 years or less) |
| Zero-Emission Powertrain Adoption | +1.6% | Europe, China, North America | Medium term (2 to 4 years) |
| Aging Fleet Replacement Cycle | +1.3% | Global | Medium term (2 to 4 years) |
| Extended Useful-Life Warranty Mandates | +0.9% | North America | Medium term (2 to 4 years) |
| E-commerce Regional Freight Densification | +0.8% | Global | Short term (2 years or less) |
| Connected Telematics & Uptime Services | +0.6% | Global | Short term (2 years or less) |
Pre-Buy Ahead of 2027 NOx Standards
The US Environmental Protection Agency’s final rule issued on March 20, 2024 cut permissible nitrogen oxide output to 0.035 grams per horsepower-hour from model year 2027, an 82.5% reduction that adds an estimated $20,000 to $25,000 per unit in compliance content per EPA rulemaking documentation. This cost escalation is compressing procurement forward, converting deferred replacement demand into a concentrated pre-buy ahead of the statutory January 2027 effective date. The June 2025 Class 8 sales spike above 20,000 units, up 12.5% year-over-year per ACT Research shipment tracking, confirms the pre-buy mechanism is actively reshaping order patterns and front-loading original-equipment revenue across the supply chain.
Manufacturers are pivoting from one-time transactional sales toward bundled uptime and extended-service contracts to defend margins against the post-pre-buy demand hangover. EPA useful-life provisions extending emissions warranty obligations to 650,000 miles from 435,000 simultaneously transfer long-tail warranty liability onto builders, incentivizing accelerated capture of connected-service annuity streams to offset the demand air pocket that Federal Reserve capital-cost indices suggest will coincide with elevated financing rates after 2027. As per our research, this regulatory-driven pre-buy dynamic adds an estimated +2.4% to baseline momentum, making the EPA nitrogen oxide rule the single largest active demand catalyst in the current forecast period.
Market Restraints
| Restraint | (~) % Impact on CAGR Forecast | Geographic Relevance | Impact Timeline |
|---|---|---|---|
| Prolonged Freight Recession Downcycle | -2.6% | North America, Europe | Short term (2 years or less) |
| Elevated Interest Rates & Capital Scarcity | -1.8% | Global | Short term (2 years or less) |
| Depressed Spot Freight Rates | -1.2% | North America | Short term (2 years or less) |
| Tariff-Driven Input Cost Inflation | -0.9% | North America, Asia | Medium term (2 to 4 years) |
| Fleet CapEx Deferral & Policy Uncertainty | -0.7% | Global | Short term (2 years or less) |
Prolonged Freight Recession Downcycle
ACT Research market commentary identified the period exiting 2025 as one of the most prolonged Class 8 contractions in modern industry history, with global heavy truck sales falling an estimated 20% to 30% year-over-year across North America, Europe, and parts of Asia. The root cause is structural overcapacity built during the pandemic-era ordering surge colliding with freight tonnage that, per American Trucking Associations freight indices, sank to its lowest level since early 2023. Spot rates finished 2025 well below historical seasonal norms while contract rates grew only in the low single digits, gutting the free cash flow fleets require to trigger replacement orders and forcing OEMs into production-line rate cuts and dealer inventory markdowns.
This freight downcycle produces acute margin compression and capital expenditure deferral across the supply chain, as US Bureau of Economic Analysis private-investment data reflect firms pausing hard-to-reverse equipment commitments amid policy uncertainty. Carrier profitability erosion mechanically suppresses replacement order flow, removing the demand signal that OEM production schedules and tier-one supplier call-off volumes depend on for forward planning. As per our research, this structural overcapacity and tonnage collapse deducts an estimated -2.6% from baseline growth, making the prolonged freight downcycle the dominant restraint compressing market momentum through the near-term forecast period.
Market Challenges
| Challenge | (~) % CAGR Friction Drag | Geographic Relevance | Mitigation Horizon |
|---|---|---|---|
| Structural Driver Shortage Deficit | -1.5% | North America, Europe | Long term (4 years or more) |
| Charging & Hydrogen Infrastructure Gap | -1.3% | Global | Long term (4 years or more) |
| Semiconductor & Component Supply Drag | -0.9% | Global | Medium term (2 to 4 years) |
| Battery Residual Value Uncertainty | -0.7% | Europe, North America | Medium term (2 to 4 years) |
| Fragmented Autonomy Regulation | -0.6% | North America | Long term (4 years or more) |
Structural Driver Shortage Deficit
The American Trucking Associations workforce reporting identified the driver deficit at approximately 80,000 unfilled seats, representing roughly 7.4% of the total driver workforce, with forecasts projecting the shortfall to widen to 160,000 by 2028. Closing this gap requires more than 1.1 million new entrants over the coming decade to offset retirements and attrition from an aging demographic increasingly reluctant toward long-haul roles despite average pay near $69,687 per ATA labor data. US Bureau of Labor Statistics occupational projections confirm that freight demand is outpacing licensed-driver supply, meaning deliverable freight capacity rather than equipment availability caps the utilization economics that justify new-truck orders.
This structural constraint compounds across the forecast period because fleet operators cannot justify replacement purchases when driver availability limits asset utilization below the threshold required to generate acceptable returns on new equipment investment. The long-term corporate adjustment requires strategic capital reallocation toward automation-ready platforms, driver-retention pay escalation, and telematics-driven productivity gains. These mitigations raise per-unit content value but demand sustained research and development outlay while lengthening the payback horizon manufacturers must underwrite. As per our research, this persistent operator deficit imposes an estimated -1.5% drag on the market growth ceiling through the forecast period.
Market Opportunities
| Opportunity | (~) % Potential CAGR Upside | Geographic Relevance | Execution Window |
|---|---|---|---|
| Driver-Out Autonomous Freight Corridors | +2.1% | North America | Long term (4 years or more) |
| Software-Defined Uptime Monetization | +1.4% | Global | Medium term (2 to 4 years) |
| Battery Second-Life & Circular Revenue | +1.0% | Europe, North America | Long term (4 years or more) |
| Hydrogen Long-Haul White Space | +0.9% | Europe, Asia | Long term (4 years or more) |
| Dealer Aftermarket M&A Roll-Ups | +0.7% | North America | Medium term (2 to 4 years) |
Driver-Out Autonomous Freight Corridors
Fully driver-out autonomous linehaul remains untapped white space rather than an active demand driver, as 2025 deployments were still supervised or single-corridor pilots. Bot.auto operator disclosures described a Houston-to-San Antonio driver-out program running 5 to 10 trucks for at least 4 months, well short of scaled commercial revenue. Industry pilot telemetry cited in Transportation Research Board proceedings associates autonomous linehaul with transit-time reductions near 25% and operating-cost reductions approaching 30%, driven by eliminating the human operator and enabling continuous asset utilization beyond hours-of-service limits that constrain conventionally driven fleets.
The distinct monetization model combines a per-mile autonomy-as-a-service layer with premium redundant-hardware truck platforms, creating recurring high-margin revenue streams beyond one-time equipment sales. The execution gate is regulatory, as US Department of Transportation and NHTSA rulemaking, potentially unified by proposed federal measures including the America Drives Act, must replace the fragmented state licensing framework before OEMs can convert corridor pilot programs into scalable commercial deployments. As per our research, if corridor licensing scales and federal regulatory clarity is established, fully driver-out autonomous linehaul can add an estimated +2.1% upside above the baseline CAGR, representing the single largest untapped opportunity in the forecast period.
Key Company Insights
PACCAR Inc. anchored its market leadership in 2025 with net sales and revenues of 44.3 Billion dollars, while Kenworth and Peterbilt captured a 30% retail sales share of the US and Canada Class 8 market. This scale gives PACCAR pricing power across dealer networks and parts distribution. However, heavy reliance on the North American Class 8 cycle exposes PACCAR to sharper swings during freight downturns than more geographically diversified rivals.
AB Volvo delivered approximately 120,000 trucks in 2025 across assembly operations in 12 countries and 16 truck models, giving it broader manufacturing footprint diversity than single-region competitors. This geographic spread cushions Volvo against localized demand shocks. Yet operating across so many assembly sites raises fixed cost complexity compared to more centralized manufacturing rivals focused on fewer markets.
Key Players
- PACCAR Inc.
- Scania AB
- AB Volvo
- Tata Motors Ltd.
- Toyota Motor Corporation
- Daimler Truck AG
- MAN
- Ford Motor Company
- General Motors
- FCA
- Nissan
- Allison Transmission Inc.
- ZF Friedrichshafen AG
- Cummins Inc.
- Eaton
- American Axle & Manufacturing, Inc.
- Mahindra & Mahindra Ltd.
- GMC
- Isuzu Motors Ltd.
- Dongfeng Motor Corporation
- Hino Motors
Recent Developments
- January 2026: Daimler Truck presented the Mercedes-Benz NextGenH2 Truck, a hydrogen fuel cell heavy duty truck planned for small series production from the end of 2026, with 100 vehicles scheduled for customer operations.
- June 2025: Daimler Truck and Volvo Group launched Coretura AB, a joint venture developing a software defined vehicle platform for commercial trucks.
Geopolitical Impact Analysis
According to the World Trade Organization, tariff volatility on imported steel and aluminum inputs has raised component costs for truck chassis and body panels across North America and Asia. The World Shipping Council reports container transit delays averaging several days on key trans-Pacific routes in 2025 and 2026. This means manufacturers sourcing components across borders face both higher landed costs and longer lead times, compressing production schedules for high output truck platforms.
As reported by the International Energy Agency, diesel price volatility linked to regional supply disruptions continues to affect fuel cost planning for long haul freight operators. Data from the World Bank shows commodity price swings in base metals used in engine and drivetrain manufacturing. Consequently, OEMs face unpredictable input costs that squeeze margins on high performance engines, pushing some manufacturers to diversify sourcing away from single-region suppliers.
Report Scope
| Report Features | Description |
|---|---|
| Market Value (2025) | USD 115.94 Billion |
| Forecast Revenue (2035) | USD 235.54 Billion |
| CAGR (2026-2035) | 7.33% |
| Base Year for Estimation | 2025 |
| Historic Period | 2020-2024 |
| Forecast Period | 2026-2035 |
| Report Coverage | Revenue Forecast, Market Dynamics, Market Opportunity Analysis, Technology and Innovation Landscape, Competitive Landscape, Recent Developments |
| Segments Covered | By Vehicle Type (Heavy-Duty Trucks, Pickup Trucks, Medium-Duty Trucks, Light-Duty Trucks), By Propulsion (Internal Combustion Engine, Battery Electric, Hybrid Electric, Plug-in Hybrid Electric, Hydrogen Fuel Cell Electric, Alternative Fuel), By Power Output (250 to 400 HP, > 400 HP, Less than 250 HP), By Application (Long-Haul Freight, Dumping, Refrigeration, Construction & Mining, Distribution), By Transmission (Manual, Automatic, Semi-Automatic) |
| Regional Analysis | North America (US and Canada), Europe (Germany, France, The UK, Spain, Italy, and Rest of Europe), Asia Pacific (China, Japan, South Korea, India, Australia, and Rest of APAC), Latin America (Brazil, Mexico, and Rest of Latin America), Middle East and Africa (GCC, South Africa, and Rest of MEA) |
| Competitive Landscape | PACCAR Inc., Scania AB, AB Volvo, Tata Motors Ltd., Toyota Motor Corporation, Daimler Truck AG, MAN, Ford Motor Company, General Motors, FCA, Nissan, Allison Transmission Inc., ZF Friedrichshafen AG, Cummins Inc., Eaton, American Axle & Manufacturing Inc., Mahindra & Mahindra Ltd., GMC, Isuzu Motors Ltd., Dongfeng Motor Corporation, Hino Motors |
| Customization Scope | Customization for segments, region / country-level will be provided. Additional customization can be done based on requirements. |
| Purchase Options | We have three licenses to opt for: Single User License | Multi-User License (Up to 5 Users) | Corporate Use License (Unlimited User and Printable PDF) |





































