
Quick Navigation
Report Overview
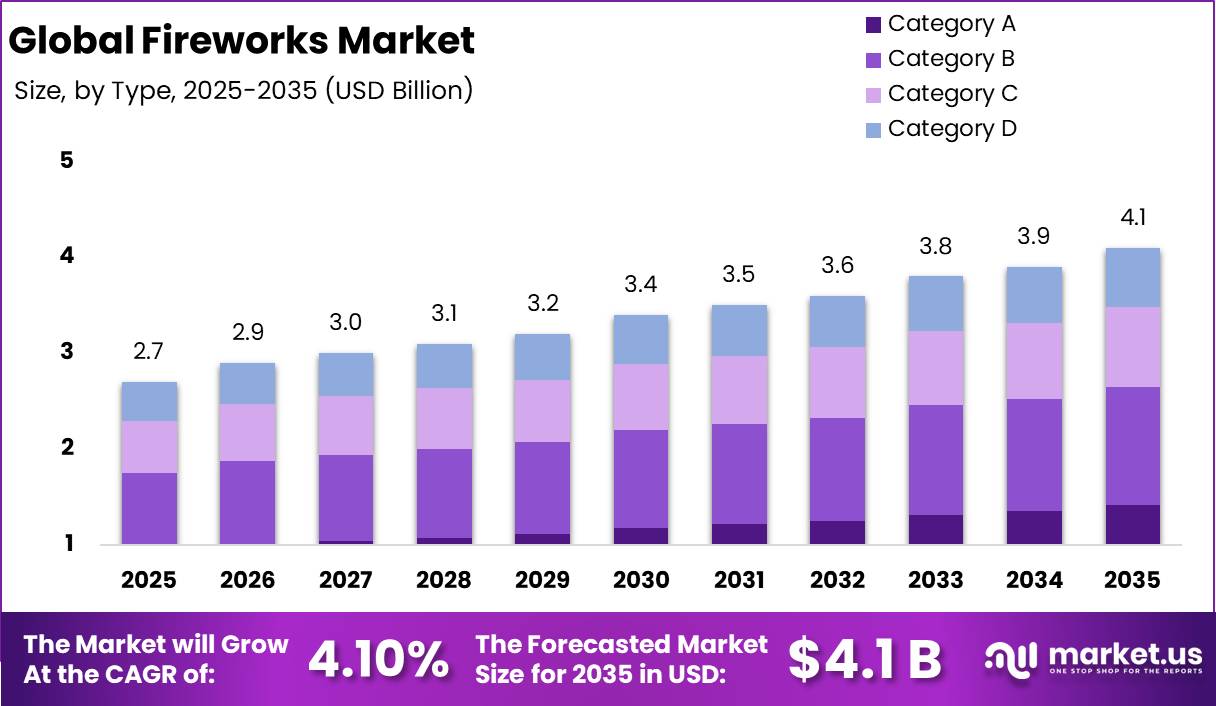
Global Fireworks Market size is expected to be worth around USD 4.1 Billion by 2035 from USD 2.7 Billion in 2025, growing at a CAGR of 4.10% during the forecast period 2026 to 2035.
The fireworks market covers manufactured pyrotechnic products used for visual and audio display during public, private, and commercial events. Buyers range from government bodies organizing national celebrations to individuals purchasing consumer grade products. This means the market spans large scale professional displays and small scale retail purchases within one demand structure.
Key Takeaways
- The global fireworks market is valued at USD 2.7 Billion in 2025 and is forecast to reach USD 4.1 Billion by 2035.
- The market is projected to grow at a CAGR of 4.10% between 2026 and 2035.
- Category A leads the By Type segment with a share of 34.60% in 2025.
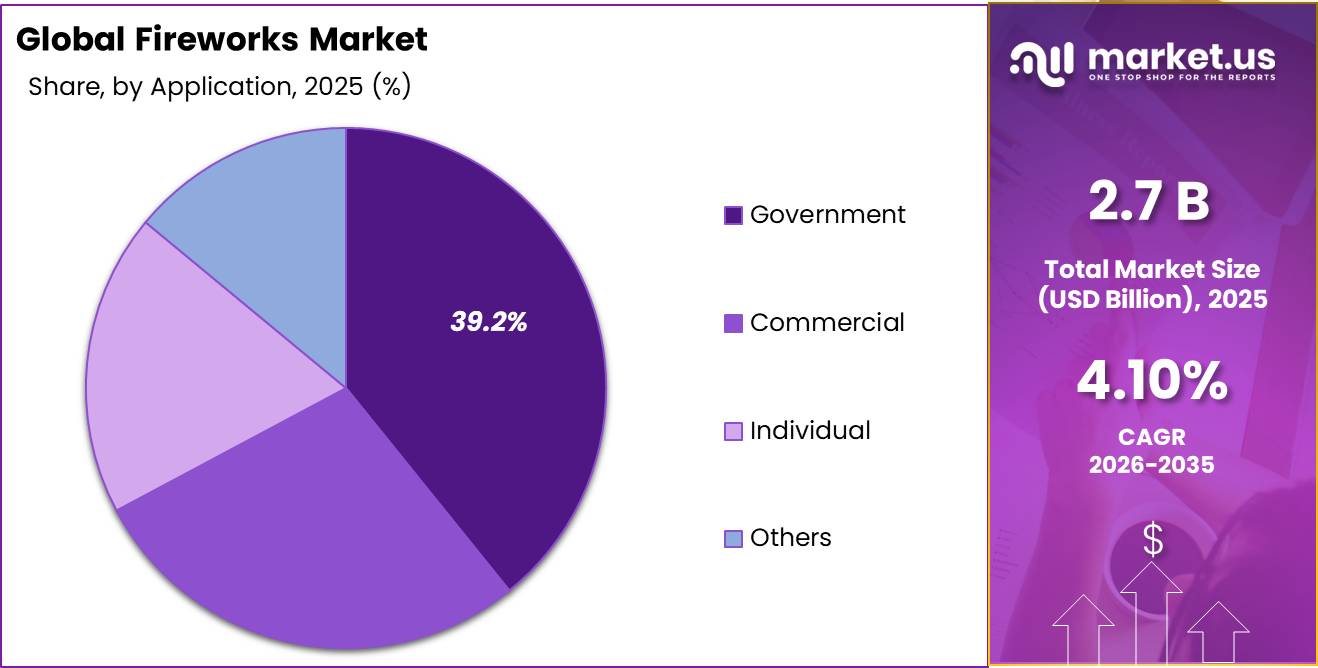
- The Government segment dominates the By Application category with a share of 39.20%.
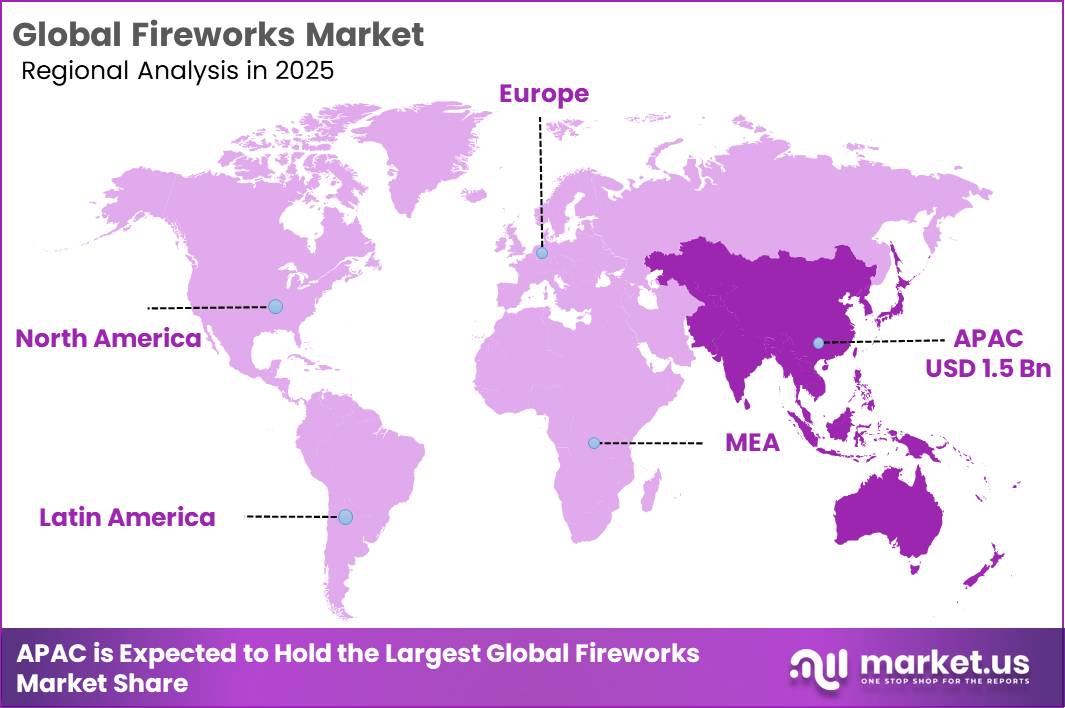
- Asia Pacific dominates the global fireworks market with a regional share of 58.70%.
Government bodies fund sanctioned displays through statutory municipal budget allocations tied to national holidays and city festivals. Expanding professional licensing frameworks now favor large scale commercial operators over consumer grade retail sellers. This shift channels public spending toward regulated, professionally managed pyrotechnic services.
Data from the US Consumer Product Safety Commission shows 14,700 people needed emergency treatment for fireworks injuries in 2024. Adults aged 25 to 44 accounted for 32% of these cases. This pattern signals rising liability exposure tied to unregulated consumer sales. Consequently, insurers and municipalities are steering buyers toward licensed professional display operators instead of retail products.
As reported by Wisconsin Department of Health Services, fireworks were linked to 32,302 reported fires across the United States in 2023. This figure includes structure fires, outside fires, and vehicle fires combined. Therefore, fire departments face higher seasonal response costs around major fireworks holidays. This creates added pressure on municipalities to fund stricter enforcement and licensing oversight.
Type Analysis
Category A dominates with 34.60% due to its leading consumption share in 2025.
In 2025, Category A held a dominant market position in the By Type segment of Fireworks Market, with a 34.60% share. The data block does not provide a named product description for this category beyond its share figure. This share confirms Category A as the largest single revenue contributor. As a result, manufacturers prioritizing this category capture the broadest base of unit demand.
Category B holds the second largest position in the By Type segment with a 30.00% share. This places it close behind the leading category in overall revenue contribution. However, the data block does not specify the functional distinction between Category A and Category B. This signals a need for further category level detail before precise positioning conclusions can be drawn.
Category C accounts for a 20.40% share of the By Type segment in 2025. This is a meaningfully smaller base than the top two categories combined. In September 2025, Pyro Planet unveiled 145 new pyrotechnic products at the NFA trade show ahead of the 2026 season. This signals active new product investment continuing across the type segment regardless of current share rank.
Category D rounds out the By Type segment with a 15.00% share, the smallest of the four groups. This positions it as a lower priority allocation for manufacturers focused on volume. By contrast, smaller categories often carry room for share gains as newer product formats enter the market.
Application Analysis
Government dominates with 39.20% due to statutory festival and holiday display budgets.
In 2025, Government held a dominant market position in the By Application segment of Fireworks Market, with a 39.20% share. Public sector buyers commit to recurring annual procurement cycles tied to fixed national holidays. This means government contracts offer manufacturers and display operators predictable, repeatable revenue compared to discretionary private spending.
Commercial applications hold the second largest position with a 28.00% share of the By Application segment. This category covers weddings, sports events, and tourism led celebrations that favor premiumized, choreographed shows. As a result, commercial buyers tend to pay higher margins per display than standard consumer purchases.
Individual applications account for an 18.80% share of the By Application segment in 2025. This reflects direct consumer purchases for personal and small scale private use. This segment carries the highest regulatory exposure given ongoing urban safety and consumer ban discussions in several markets.
Others make up the remaining 14.00% share of the By Application segment. This category captures uses outside the three primary buyer groups tracked in this report. This signals a smaller but present demand base that does not fit standard government, commercial, or individual classification.
Key Market Segments
By Type
- Category A
- Category B
- Category C
- Category D
By Application
- Government
- Commercial
- Individual
- Others
Drivers
UNESCO inscribed Diwali on its Representative List of the Intangible Cultural Heritage of Humanity in December 2025, becoming the 16th Indian element on the global list. This recognition raises Diwali’s international legitimacy and accelerates government hosted events across North America, the EU, and Southeast Asia. Diaspora growth in these regions translates directly into professional pyrotechnic purchasing.
Lunar New Year 2026 marked the start of the Year of the Fire Horse, a once in 60 years event across China, Vietnam, Taiwan, and Hong Kong. Chinese authorities projected a record 9.5 billion passenger trips during the 40 day Spring Festival window. With Diwali 2026 falling on November 8, manufacturers in Sivakasi and Liuyang face back to back peak demand cycles within the same fiscal year.
| Driver | (~) % Impact on CAGR Forecast | Geographic Relevance | Impact Timeline |
|---|---|---|---|
| Festival & Cultural Calendar Expansion — UNESCO inscription of Diwali (Dec 2025) + Fire Horse Lunar New Year 2026 amplifying pyrotechnic demand globally | +1.8% | South Asia (core), APAC, Southeast Asia, North America & EU diaspora corridors | Short term (≤ 2 years) |
| Eco-Friendly / Green Fireworks Regulatory Pivot — India Supreme Court Oct 2025 green cracker mandate; CSIR-NEERI/PESO certification framework reshaping product BoM and licensing | +1.5% | South Asia (India core), APAC tier-2 cities, EU regulatory spill-over | Medium term (2–4 years) |
| Live Events & Experiential Entertainment Surge — Post-2024 boom in concerts, sports finals, and tourism-driven pyrotechnic spectacles fuelling professional display segment | +1.2% | India, North America, EU, Southeast Asia (Vietnam, Thailand), Gulf (UAE) | Short to Medium term |
| US–China Trade Policy & Tariff Realignment — 145% tariff peak in early 2025, stabilized at ~30% post-May 2025 truce; supply chain restructuring toward India, Vietnam, ASEAN | +0.9% | North America (direct), South America & ASEAN as China re-routing corridors | Short term (≤ 2 years) |
| Consumer Fireworks Regulatory Tightening in Western Markets — Netherlands F2–F4 consumer ban effective 1 July 2026; shift to licensed professional display contracting | +0.7% | Netherlands (core), EU spill-over (Germany, Ireland, Nordics) | Medium term (2–4 years) |
| Hybrid Drone–Pyrotechnics Integration — Pyro-drone convergence (GPS-triggered pyro modules + timecode sync) creating premium display formats and expanding per-event spend | +0.6% | APAC (South Korea, China, Vietnam); scaling in North America and Gulf | Long term (≥ 4 years) |
Restraints
Drone light shows, laser projection, and AI orchestrated swarm displays are emerging as zero emission, regulatory compliant substitutes for traditional pyrotechnics. The Dutch fireworks ban explicitly positioned drone light shows as the sanctioned replacement format for public celebrations. Germany’s expanding fireworks free urban zones are commercially viable only because drone vendors now fill the entertainment void.
This substitution pressure targets the professional display segment, which generates the majority of total industry revenue by value. Drone show costs are falling as swarm hardware commoditizes, while traditional displays carry rising HazMat disposal, insurance, and permit costs. The structural shift is expected to erode professional display CAGR by approximately 1.0 percentage points through 2033.
| Restraint | (~) % Impact on CAGR Forecast | Geographic Relevance | Impact Timeline |
|---|---|---|---|
| US-China Trade Tariff Escalation | -1.5% | North America (core), Latin America corridors | Short term (≤ 2 years) |
| Tightening Environmental & Noise Bans | -1.2% | EU (Western & Northern), India NCR+, select APAC urban zones | Medium term (2–4 years) |
| Drone & Tech-Entertainment Substitution | -1.0% | North America, EU, APAC premium event segment | Long term (≥ 4 years) |
| Chemical Raw Material & Port Supply Fragility | -0.8% | China manufacturing core, global import-dependent markets | Short–Medium term |
| Workplace Safety Compliance Costs & Liability | -0.6% | South Asia (Sivakasi/Virudhunagar cluster), Southeast Asia, China | Medium term (2–4 years) |
| HazMat Logistics Complexity & Certification Burden | -0.5% | North America, EU, APAC trade lanes | Short–Medium term |
Challenges
China supplies an estimated 90% of global fireworks production and 80% of international trade volume. UN Comtrade data shows China exported over 360,000 metric tons worth approximately USD 1 billion in 2023, roughly matching the next five largest exporters combined. The United States sourced 98% of its imports from China, with China representing 96.3% of US import value in 2024.
This near total dependency means any disruption to Chinese export logistics or production scheduling propagates directly into US and EU supply chains. No alternative base, including India’s Sivakasi cluster, currently has the volume or certification depth to absorb meaningful capacity within a three to five year horizon. The American Pyrotechnics Association acknowledges this requires sustained multi year supplier development rather than near term substitution.
| Challenge | (~) % CAGR Friction Drag | Geographic Relevance | Mitigation Horizon |
|---|---|---|---|
| China Single-Source Supply Concentration | -1.2% | North America, EU import hubs, APAC re-exporters | Long term (≥ 4 years) |
| Tariff & Trade Policy Volatility | -0.9% | North America (US-core), EU secondary exposure | Medium term (2–4 years) |
| Tightening Environmental & Noise Regulations | -1.0% | South Asia (India), EU regulatory hubs, urban North America | Long term (≥ 4 years) |
| Pyrotechnic-Grade Chemical Input Cost Inflation | -0.8% | Global — China manufacturing corridor, US/EU importers | Medium term (2–4 years) |
| Pyrotechnician Talent Deficit & Licensing Friction | -0.7% | North America, Western Europe, ANZ markets | Medium term (2–4 years) |
| Drone & Digital Substitution Competitive Pressure | -0.6% | Global urban event markets — APAC, EU, North America | Long term (≥ 4 years) |
Opportunities
The dominant commercial model remains transactional, with municipalities and event operators buying discrete display packages per event with no recurring revenue. The strategic white space is converting this into Pyrotechnics as a Service, where clients sign annual contracts bundling staffing, choreography software, compliance, and insurance under one fee. Disney alone is estimated to spend USD 50 million annually on park pyrotechnics.
A municipality spending USD 80,000 to 250,000 per event could convert into a USD 300,000 to 750,000 annual contract. At a conservative 15% conversion rate across an estimated 12,000 plus annual professional shows, the incremental revenue pool approximates USD 400 to 600 million. This model could expand operator margins from 8 to 12% toward 22 to 28%.
| Opportunity | (~) % Potential CAGR Upside | Geographic Relevance | Execution Window |
|---|---|---|---|
| Pyrotechnics-as-a-Service (PaaS): Managed Display Outsourcing | +2.2% | North America, Western Europe, GCC | Short term (≤ 2 years) |
| Eco-Formulation & Green Fireworks Monetization | +1.8% | India, EU, East Asia | Short term (≤ 2 years) |
| Supply Chain Localization: China+1 Manufacturing Pivot | +2.5% | India, Vietnam, Southeast Asia (for US/EU export) | Medium term (2–4 years) |
| Drone-Fireworks Hybrid Display Integration | +1.5% | APAC, North America, Middle East & Africa | Medium term (2–4 years) |
| Adjacent Vertical Expansion: Film, Live Events & Proximate Pyrotechnics | +1.4% | North America, UK, South Korea, India | Medium term (2–4 years) |
| APAC & GCC Festival Economy White Space Penetration | +2.0% | Saudi Arabia, UAE, Southeast Asia, South Asia | Long term (≥ 4 years) |
Regional Analysis
Asia Pacific Dominates the Fireworks Market with a Market Share of 58.70%, Valued at USD 1.58 Billion
Asia Pacific leads the global fireworks market, anchored by China’s manufacturing base and recurring festival driven demand. China accounts for an estimated 90% of global production and 80% of international trade volume. Lunar New Year 2026 alone drove a record 9.5 billion projected passenger trips during China’s Spring Festival window. This concentration gives the region structural pricing power over global supply chains.
North America imports the majority of its fireworks supply from China, with China representing 96.3% of US import value in 2024. Longitudinal public health research from 2012 to 2022 shows fireworks related emergency department visits increased by more than 17% over the decade. This signals rising scrutiny on consumer fireworks even as professional display procurement continues. Therefore, regional growth increasingly depends on licensed commercial display contracts rather than retail sales.
Europe shows mixed regional dynamics, with the Netherlands set to ban F2 to F4 consumer fireworks from 1 July 2026. A UK consumer survey found that a majority of respondents enjoy fireworks, and almost half had attended a display within the past three years. This reflects continued public appetite even as regulation tightens. This creates a structural shift toward licensed professional display operators across Western Europe.
Key Regions and Countries
North America
- US
- Canada
Europe
- Germany
- France
- The UK
- Spain
- Italy
- Rest of Europe
Asia Pacific
- China
- Japan
- South Korea
- India
- Australia
- Rest of APAC
Latin America
- Brazil
- Mexico
- Rest of Latin America
Middle East and Africa
- GCC
- South Africa
- Rest of MEA
Competitive Analysis
Fireworks by Grucci appears in the key players list without accompanying strategic or operational detail in the data block. Broader industry activity shows consolidation trends, including Gladstone Investment Corporation’s completed acquisition of Pyrotek Special Effects in November 2024. This signals investor appetite for live entertainment pyrotechnics assets. This means the competitive field may see further acquisition activity beyond the named key players.
Key Players
- Brocks Fireworks
- Fireworks by Grucci
- Fantastic Fireworks
- Dominion Fireworks Inc.
- Star Fireworks
- Pyro Spectaculars by Souza
- Standard Fireworks (p) Ltd.
- Dancing Fireworks Group Co.
- Black Bull Fireworks
Recent Developments
- February 2025 – Gladstone Investment Corporation provided additional capital to support Pyrotek Special Effects’ acquisition of Unique Pyrotechnic, expanding live special effects and pyrotechnic capabilities across multiple regions.
- January 2026 – Brothers Pyrotechnics released its 2026 product catalogue, featuring new fireworks products including next generation cake assortments and artillery shells.
Report Scope
| Report Features | Description |
|---|---|
| Market Value (2025) | USD 2.7 Billion |
| Forecast Revenue (2035) | USD 4.1 Billion |
| CAGR (2026-2035) | 4.10% |
| Base Year for Estimation | 2025 |
| Historic Period | 2020-2024 |
| Forecast Period | 2026-2035 |
| Report Coverage | Revenue Forecast, Market Dynamics, Market Opportunity Analysis, Technology and Innovation Landscape, Competitive Landscape, Recent Developments |
| Segments Covered | By Type (Category A, Category B, Category C, Category D), By Application (Government, Commercial, Individual, Others) |
| Regional Analysis | North America (US and Canada), Europe (Germany, France, The UK, Spain, Italy, and Rest of Europe), Asia Pacific (China, Japan, South Korea, India, Australia, and Rest of APAC), Latin America (Brazil, Mexico, and Rest of Latin America), Middle East and Africa (GCC, South Africa, and Rest of MEA) |
| Competitive Landscape | Brocks Fireworks, Fireworks by Grucci, Fantastic Fireworks, Dominion Fireworks Inc., Star Fireworks, Pyro Spectaculars by Souza, Standard Fireworks (p) Ltd., Dancing Fireworks Group Co., Black Bull Fireworks |
| Customization Scope | Customization for segments, region/country-level will be provided. Additional customization can be done based on requirements. |
| Purchase Options | We have three licenses to opt for: Single User License, Multi-User License (Up to 5 Users), Corporate Use License (Unlimited User and Printable PDF) |


