
Global Fast Food QSR Market Size, Share Analysis Report By Type (Chain, Independent), By Cuisine (American, Chinese, Italian, Mexican, Japanese, Turkish And Lebanese, Others) , By Region and Companies - Industry Segment Outlook, Market Assessment, Competition Scenario, Trends and Forecast 2025-2034
- Published date: Oct 2025
- Report ID: 162990
- Number of Pages: 393
- Format:
-
keyboard_arrow_up
Quick Navigation
Report Overview
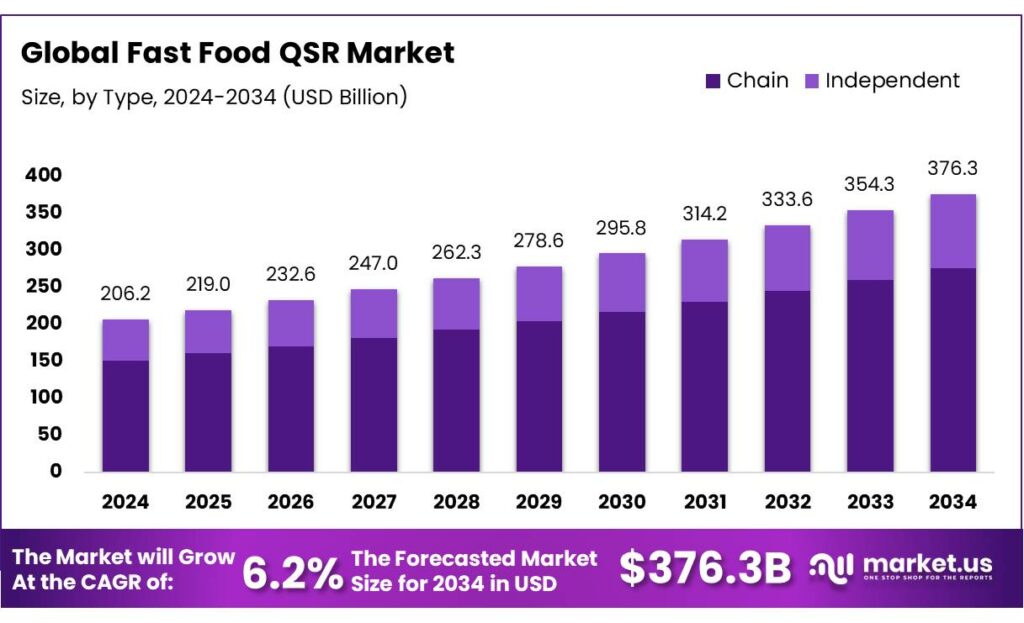
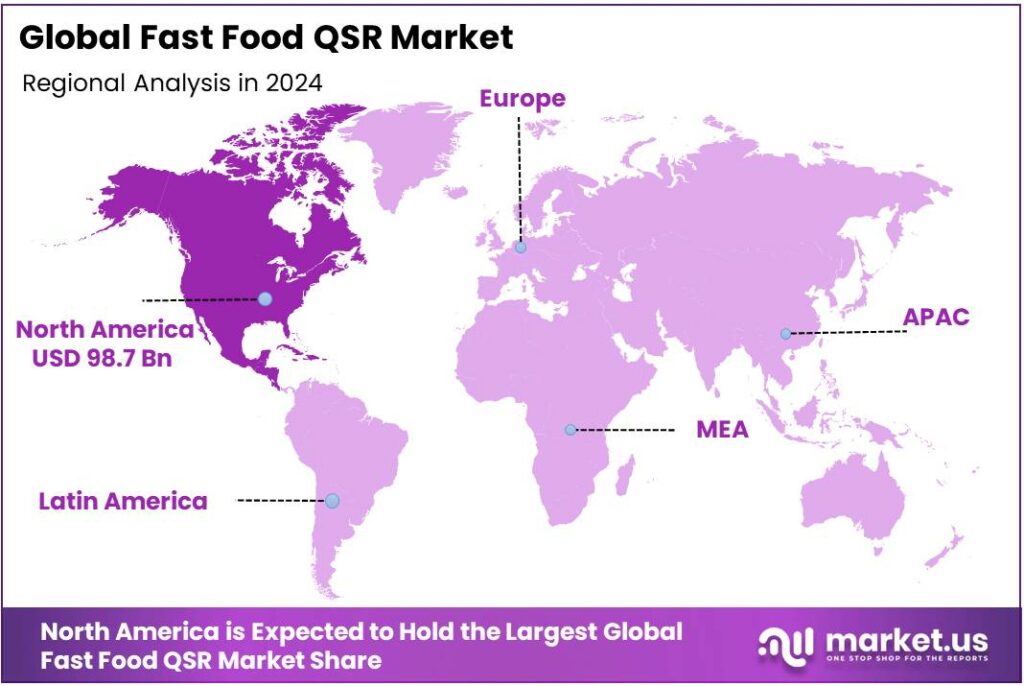
The Global Fast Food QSR Market size is expected to be worth around USD 376.3 Billion by 2034, from USD 206.2 Billion in 2024, growing at a CAGR of 6.2% during the forecast period from 2025 to 2034. In 2024 North America held a dominant market position, capturing more than a 47.9% share, holding USD 98.7 Billion in revenue.
Fast food/QSR is a scale-driven, thin-margin business that wins on speed, consistency, and footprint density—and that footprint is energy-hungry. In the United States, food-service buildings are among the most energy-intensive commercial spaces, with the U.S. Energy Information Administration (EIA) noting they are “nearly four times” more energy-intensive than the commercial average—driven by cooking loads, refrigeration, ventilation, and long operating hours.
Energy Star’s national medians quantify the gap: a fast-food restaurant posts a median site energy use intensity of 886.4 kBtu/ft²-yr, far above a typical restaurant/cafeteria at 573.7 kBtu/ft²-yr. EIA’s detailed CBECS tables show food-service buildings also have the highest natural-gas intensity at 147.6 ft³/ft², compared with 32.7 ft³/ft² for all commercial buildings.
This energy profile shapes the sector’s cost structure and capital priorities. The U.S. Department of Energy’s Better Buildings program estimates retail, food service, and grocery operators collectively spend over $41 billion on energy each year across 14.4 billion ft² of floor area—underscoring the headroom for savings via equipment upgrades, controls, and envelope improvements. Within restaurants, lighting averages ~13% of energy use, and ENERGY STAR–certified LEDs can cut lighting energy by ~90% versus traditional lamps, offering quick-payback retrofits suited to multi-unit rollouts.
Key driving factors include energy-smart kitchens and equipment upgrades. ENERGY STAR notes restaurants and commercial kitchens can average ~250,000 Btu/ft² (≈73 kWh/ft²), meaning even incremental efficiency gains compound across chain portfolios; targeted upgrades in cooking, HVAC and refrigeration deliver measurable utility savings and resilience. DOE’s Better Buildings platform and affiliated Food Service Technology Center provide technical playbooks to reduce these loads in real sites, accelerating paybacks for multi-unit operators.
Policy support is material to margins. In the U.S., the Section 179D commercial buildings deduction—expanded under the Inflation Reduction Act—allows owners who achieve ≥25% modeled energy-cost savings to claim a per-square-foot deduction, which scales with savings and is enhanced for prevailing-wage/apprenticeship compliance. This applies to HVAC, envelope and lighting retrofits common to QSR boxes.
- In the EU, Ecodesign and Energy Labelling rules for professional refrigerated storage cabinets (Regulations 2015/1095 and 2015/1094) push higher-efficiency back-of-house refrigeration, a persistent QSR load. In India, the Electric Mobility Promotion Scheme 2024 (EMPS 2024) provided ₹500 crore to accelerate e-2W/e-3W adoption—important for low-cost electric deliveries in dense urban catchments.
Key Takeaways
- Fast Food QSR Market size is expected to be worth around USD 376.3 Billion by 2034, from USD 206.2 Billion in 2024, growing at a CAGR of 6.2%.
- Chain QSRs held a dominant market position, capturing more than a 73.4% share of the global fast food market.
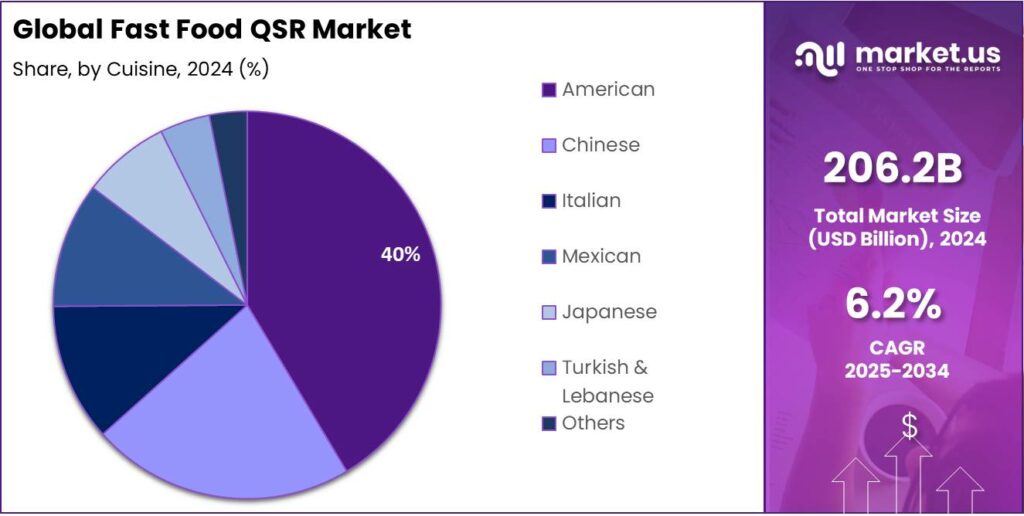
- American cuisine held a dominant market position, capturing more than a 39.6% share in the global fast food QSR market.
- North America held a dominant position in the global fast food QSR market, accounting for 47.9% of total revenue, valued at USD 98.7 billion.
By Type Analysis
Chain QSRs dominate with 73.4% share due to their strong brand presence and operational efficiency
In 2024, Chain QSRs held a dominant market position, capturing more than a 73.4% share of the global fast food market. The segment’s leadership can be attributed to the widespread reach of international and regional brands that continue to expand aggressively through franchising and standardized operations. Chains have benefited from their ability to maintain consistent quality, speed of service, and digital connectivity across locations, which have reinforced customer trust and repeat purchase behavior. The rapid integration of mobile ordering, delivery partnerships, and loyalty programs has further strengthened brand visibility and customer engagement, allowing large QSR networks to outperform independent outlets in both developed and emerging economies.
Chain-based fast food operators invested heavily in digital transformation and sustainability initiatives, such as energy-efficient equipment and waste reduction programs, aligning with global shifts toward responsible consumption. Their strong capital base enabled continuous adaptation to changing consumer trends, including the demand for healthier menu options and plant-based offerings. By 2025, the Chain QSR segment is expected to sustain its dominance, supported by continued urbanization, rising disposable incomes, and the expansion of drive-thru and delivery-only models in high-density markets. The segment’s scale advantages, supply chain integration, and data-driven marketing are projected to enhance profitability and operational resilience, positioning chain operators as the primary growth engine of the global fast food QSR industry.
By Cuisine Analysis
American Cuisine dominates with 39.6% share driven by its global popularity and standardized offerings
In 2024, American cuisine held a dominant market position, capturing more than a 39.6% share in the global fast food QSR market. The segment’s leadership is primarily driven by the global presence of iconic American fast-food chains that have successfully established strong brand loyalty and recognition across diverse regions. Burgers, fries, fried chicken, and sandwiches remain the core menu items that continue to appeal to a broad consumer base due to their affordability, taste consistency, and convenience. The wide availability of these products, along with strong marketing campaigns and franchised expansion strategies, has made American cuisine the most recognizable format in the QSR industry.
American-style QSRs witnessed steady sales growth supported by digital integration, efficient delivery systems, and modernization of store formats. The inclusion of healthier variants, plant-based alternatives, and sustainable packaging also contributed to attracting younger and health-conscious consumers. Moving into 2025, the dominance of American cuisine is expected to continue as international demand for Western-style fast food remains strong, particularly in Asia-Pacific and Latin America. Global expansion plans, menu localization, and strategic partnerships with food aggregators are anticipated to further strengthen its position. With its deep-rooted cultural influence and continuous innovation, American cuisine will remain a central driver of the global fast food QSR market’s growth trajectory.
Key Market Segments
By Type
- Chain
- Independent
By Cuisine
- American
- Chinese
- Italian
- Mexican
- Japanese
- Turkish & Lebanese
- Others
Emerging Trends
Menu Transparency And Sodium-Smart Reformulation
Fast-food/QSR menus are shifting toward clear calorie disclosure and lower-sodium recipes—a regulatory-driven trend that is reshaping product development and guest communication. In the U.S., the Food and Drug Administration requires chain restaurants with 20+ locations to list calories on menus and menu boards and to provide, on request, full nutrition details including sodium, sugars, fat and protein. This federal rule has been in effect since May 7, 2018, and it applies across dining rooms, kiosks, and drive-thru boards—making transparent nutrition part of the standard guest experience.
- The same policy momentum is pushing sodium reduction inside kitchens. Average U.S. sodium intake remains >3,300 mg/day, above the federal guideline of <2,300 mg/day for teens and adults; CDC analyses show ≈86.7%–89.2% of adults exceeded 2,300 mg/day in 2003–2016. These figures keep sodium squarely in the public-health spotlight and create a powerful nudge for QSR reformulation.
In October 2021, FDA issued voluntary short-term sodium reduction targets for commercially prepared and packaged foods, aiming to move population intake from ~3,400 mg/day to ~3,000 mg/day—about a 12% decrease over 2.5 years; FDA updated the guidance in August 2024 to keep industry on pace. For QSR operators, that translates to salting standards, seasoning blends, breading systems, sauces and cheese usage all getting redesigned, while preserving taste and food safety. The World Health Organization reinforces the direction: Member States agreed to a 30% relative reduction in salt intake by 2025, and WHO estimates 1.9 million deaths each year are attributable to high sodium; global mean intake was 4.3 g/day sodium in 2019, over double the recommendation (<2 g/day).
Consumer behavior and policy are reinforcing each other. USDA data show food-away-from-home (FAFH) hit a record 58.9% share of total U.S. food spending in 2024, meaning more purchase decisions now happen under menu boards and within apps where calories are visible. This setting rewards brands that pair transparent labeling with credible “better-for-you” options. FDA’s menu-labeling framework also compels operational discipline: covered brands must keep nutrition files current and accessible at each unit, aligning marketing claims with actual recipes.
Drivers
Eating-Out Spend + Trust Infrastructure
A major force pushing fast-food/QSR growth is the sustained shift toward eating out, now reinforced by clear safety and regulatory infrastructure that keeps consumers confident. In the United States, total nominal food spending reached $2.58 trillion in 2024, up from $2.48 trillion in 2023; critically, food-away-from-home (FAFH)—the category that includes quick-service chains—expanded to $1.52 trillion in 2024, signaling that prepared, on-the-go meals continue to pull dollars from at-home channels.
USDA further notes that FAFH accounted for 58.5% of all U.S. food spending in 2023, the highest share in the series that dates back to the 1930s—evidence that eating out has become the default, not the exception. This spending momentum shows up in industry-side indicators: the National Restaurant Association projected $1.1 trillion in 2024 U.S. restaurant sales and a workforce of 15.7 million people, underlining both the scale and resilience of limited-service formats that dominate convenience occasions.
Public nutrition programs also intersect with QSR ecosystem logistics and demand. USDA’s SNAP—the nation’s largest nutrition assistance program—served an average of 41.7 million participants per month in FY 2024, with total Federal SNAP spending of $99.8 billion; this magnitude shapes local food-retail and prepared-food access patterns, including state-level Restaurant Meals Program (RMP) options and the rapid expansion of SNAP Online Purchasing that has normalized app-based ordering for millions of households.
Consumer confidence to purchase ready-to-eat food is shaped by visible, codified food-safety frameworks, which in turn lower perceived risk and speed demand recovery after shocks. The FDA Food Code serves as the national model for restaurant and retail food safety; FDA’s 2023 adoption analysis shows 39 U.S. states have a single primary agency overseeing restaurants/retail, while 12 states operate with multiple agencies—an administrative picture that helps operators scale compliance processes across units.
Restraints
Health & Regulatory Risks Limiting QSR Expansion
One of the major restraining factors facing fast-food and QSR chains is the escalating health and regulatory challenge that arises from their core business models. Globally, the World Health Organization (WHO) estimates that 600 million people—almost 1 in 10 of the world’s population—fall ill after eating contaminated food each year, and 420 000 people die annually from foodborne diseases. While this spans all food service, the implication for high-volume, rapid-turn QSR kitchens is clear: tighter regulation and higher compliance burdens.
In the U.S., the Food and Drug Administration (FDA) reported in its 2017-2018 review of fast-food and full-service restaurants that unsafe food-handling practices remain a persistent risk factor. The report highlighted that the two most common risk factors in food-service establishments were “improper holding time and temperature” and “poor personal hygiene” among employees.
In the U.S., the Food and Drug Administration (FDA) reported in its 2017-2018 review of fast-food and full-service restaurants that unsafe food-handling practices remain a persistent risk factor. The report highlighted that the two most common risk factors in food-service establishments were “improper holding time and temperature” and “poor personal hygiene” among employees.
- According to the Centers for Disease Control and Prevention (CDC), during 2013-2016 roughly 36.6% of U.S. adults consumed fast food on any given day. Within the 20-39 age group it was even higher: 44.9%. Such high penetration attracts scrutiny from governments and civil society alike, especially given correlations with overweight, obesity, and diet-related diseases. QSR chains might find regulatory caps, zoning restrictions or health-taxes increasingly common in markets sensitive to public health.
Opportunity
Inclusive Digital Access + Public-Program Integration
A powerful growth path for fast-food/QSR is to meet demand where it already flows—toward eating out—while widening access through government-supported digital channels. In the United States, food spending has tilted decisively toward meals prepared away from home. USDA’s Economic Research Service reports that total nominal food spending reached $2.58 trillion in 2024, up from $2.48 trillion in 2023, with food-away-from-home (FAFH) rising to $1.52 trillion in 2024. In share terms, FAFH climbed to a record 58.9% of total food spending in 2024, reflecting consumers’ preference for prepared, convenient meals and the normalization of app-based ordering.
- This demand backdrop is matched by industry capacity: the National Restaurant Association projected $1.1 trillion in 2024 U.S. restaurant sales and a workforce of 15.7 million, underscoring the scale at which limited-service formats can leverage new access channels.
Access is where the next leg of growth lies. USDA’s Supplemental Nutrition Assistance Program (SNAP) served an average of 41.7 million participants per month in FY 2024, with Federal SNAP spending of $99.8 billion—a large, highly digital population whose purchasing habits increasingly include online ordering. USDA’s Food and Nutrition Service (FNS) has expanded SNAP Online Purchasing, enabling benefits redemption through e-commerce in participating States; FNS maintains an up-to-date map of participating States and retailers as the program scales.
Digital inclusion can compound core demand trends. USDA ERS documents that FAFH’s share hit 58.5% in 2023, the highest on record since the 1930s, as consumers embraced out-of-home meals and friction-light ordering. With SNAP representing about two-thirds to 70% of USDA nutrition-assistance outlays, integrating program-compliant offers and payment paths exposes QSR brands to large, recurring demand pools—often in delivery-dense neighborhoods where speed and affordability matter most.
Regional Insights
North America leads the global Fast Food QSR market with 47.9% share valued at USD 98.7 billion
In 2024, North America held a dominant position in the global fast food QSR market, accounting for 47.9% of total revenue, valued at USD 98.7 billion. The region’s leadership is largely supported by a mature quick-service infrastructure, a well-established franchise network, and strong consumer demand for convenient and affordable dining options.
The United States continues to represent the largest national market within the region, driven by the high penetration of international chains such as McDonald’s, Yum! Brands, and Wendy’s, alongside growing regional players focused on niche offerings. According to the U.S. Census Bureau, the foodservice and drinking place sales exceeded USD 1.4 trillion in 2024, highlighting the deep economic influence of the QSR segment in the regional economy.
North America’s QSR landscape is also shaped by evolving consumer preferences for digital convenience, healthier menu items, and sustainability-led operations. The rapid growth of mobile ordering and third-party delivery platforms has transformed the competitive environment, with over 60% of QSR sales in the U.S. now involving digital channels. Additionally, Canada’s fast food sector has shown consistent expansion, supported by rising urbanization and increased disposable income levels.
Key Regions and Countries Insights
- North America
- US
- Canada
- Europe
- Germany
- France
- The UK
- Spain
- Italy
- Rest of Europe
- Asia Pacific
- China
- Japan
- South Korea
- India
- Australia
- Rest of APAC
- Latin America
- Brazil
- Mexico
- Rest of Latin America
- Middle East & Africa
- GCC
- South Africa
- Rest of MEA
Key Players Analysis
Quality Is Our Recipe, LLC, the parent company of Wendy’s, maintained a strong foothold in the global QSR market in 2024, driven by its expanding franchise network and consistent innovation in menu offerings. The company operated over 7,000 outlets worldwide, emphasizing premium ingredients and improved customer experience through digital kiosks and mobile ordering. Its focus on breakfast expansion, sustainability, and energy-efficient restaurant models has strengthened brand positioning, supporting revenue growth across key markets in North America and Europe.
Carrols Restaurant Group, Inc., one of the largest Burger King and Popeyes franchisees, reported steady growth in 2024 through operational efficiency and remodeling programs. With over 1,000 restaurant locations across the United States, the company focused on enhancing digital engagement and drive-thru optimization. Strategic reinvestment in technology, menu simplification, and delivery partnerships improved profitability. Continued focus on cost management and brand alignment helped Carrols strengthen its position as a leading QSR operator in the North American market.
Darden Concepts, Inc., a key player in the American dining and QSR segment, showcased solid performance in 2024 through diversified restaurant brands, including Olive Garden and LongHorn Steakhouse. The company benefited from rising off-premise sales and menu innovation that catered to evolving customer preferences. With over 1,900 locations in North America, Darden prioritized workforce training, supply chain efficiency, and sustainability goals. Its balanced approach between affordability and quality positioned the company for stable growth into 2025.
Top Key Players Outlook
- Quality Is Our Recipe, LLC
- Carrols Restaurant Group, Inc.
- Yum! Brands
- Darden Concepts, Inc.
- Ark Restaurant Corp.
- DEL TACO RESTAURANT, INC.
- Restaurant Brands International Inc.
- Kotipizza Group Oyj
- Chipotle Mexican Grill
- JACK IN THE BOX INC
Recent Industry Developments
In 2024 Quality Is Our Recipe, LLC, reported Total Revenues of USD 534.8 million, up from USD 528.8 million in the same quarter of 2023, representing a 1.1 % increase.
Del Taco Restaurant, Inc. operates as a fast-food chain combining Mexican-style and American favorites, and in full-year 2024 the brand reported a same-store sales decline of 3.9% in Q4 and system-wide sales down 3.3% for that quarter.
Report Scope
Report Features Description Market Value (2024) USD 206.2 Bn Forecast Revenue (2034) USD 376.3 Bn CAGR (2025-2034) 6.2% Base Year for Estimation 2024 Historic Period 2020-2023 Forecast Period 2025-2034 Report Coverage Revenue Forecast, Market Dynamics, Competitive Landscape, Recent Developments Segments Covered By Type (Chain, Independent), By Cuisine (American, Chinese, Italian, Mexican, Japanese, Turkish And Lebanese, Others) Regional Analysis North America – US, Canada; Europe – Germany, France, The UK, Spain, Italy, Rest of Europe; Asia Pacific – China, Japan, South Korea, India, Australia, Singapore, Rest of APAC; Latin America – Brazil, Mexico, Rest of Latin America; Middle East & Africa – GCC, South Africa, Rest of MEA Competitive Landscape Quality Is Our Recipe, LLC, Carrols Restaurant Group, Inc., Yum! Brands, Darden Concepts, Inc., Ark Restaurant Corp., DEL TACO RESTAURANT, INC., Restaurant Brands International Inc., Kotipizza Group Oyj, Chipotle Mexican Grill, JACK IN THE BOX INC Customization Scope Customization for segments, region/country-level will be provided. Moreover, additional customization can be done based on the requirements. Purchase Options We have three licenses to opt for: Single User License, Multi-User License (Up to 5 Users), Corporate Use License (Unlimited User and Printable PDF) 
-
-
- Quality Is Our Recipe, LLC
- Carrols Restaurant Group, Inc.
- Yum! Brands
- Darden Concepts, Inc.
- Ark Restaurant Corp.
- DEL TACO RESTAURANT, INC.
- Restaurant Brands International Inc.
- Kotipizza Group Oyj
- Chipotle Mexican Grill
- JACK IN THE BOX INC
Our Clients
- 162990
- Oct 2025


