


Cargo Shipping Market Report Overview
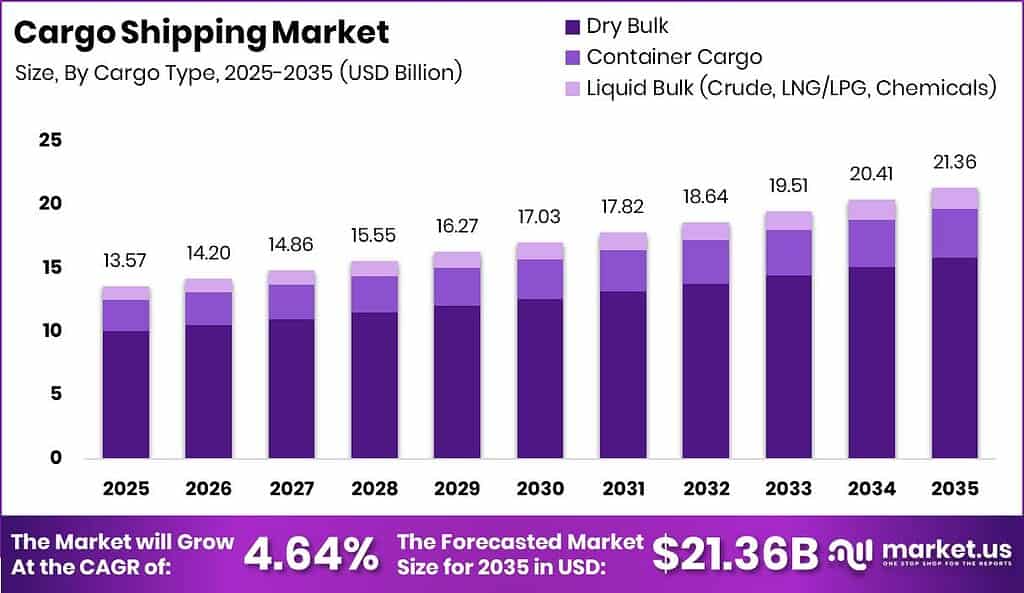
Global Cargo Shipping Market size is expected to be worth around USD 21.36 Billion by 2035 from USD 14.2 Billion in 2026, growing at a CAGR of 4.64% during the forecast period 2026 to 2035. Carriers convert industrial output and retail restocking into paid tonne-miles across ocean lanes. Investors track capacity discipline because rate recovery depends on matching newbuild deliveries to cargo liftings.
Therefore, the Cargo Shipping Market covers ocean movement of dry bulk, containerized goods, and liquid cargoes on bulk carriers, container ships, tankers, general cargo ships, and specialized vessels. Service models split into liner schedules, tramp voyages, and project heavy-lift parcels. Vessel size classes from Handy to ultra-large units shape port access, slot economics, and contract pricing for shippers.
Key Takeaways
- The market reaches USD 14.2 Billion in 2026 and USD 21.36 Billion by 2035 at a CAGR of 4.64%.
- Bulk Carriers lead By Ship Type with a 43.00% share.
- Dry Bulk leads By Cargo Type with a 74.00% share.
- Manufacturing leads By End-Use Industry with a 35.85% share.
- Panamax leads By Vessel Size Class with a 37.85% share.
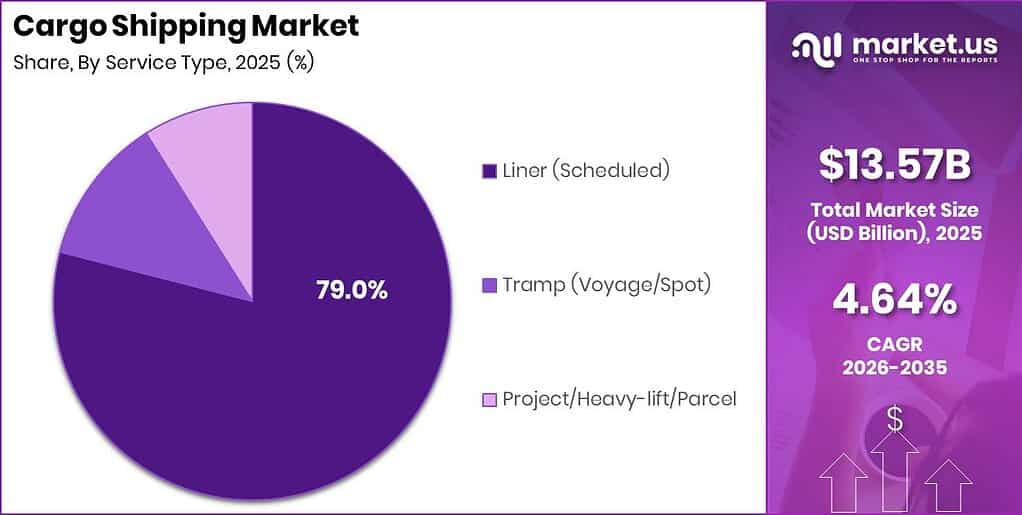
- Liner (Scheduled) leads By Service Type with a 79.00% share.
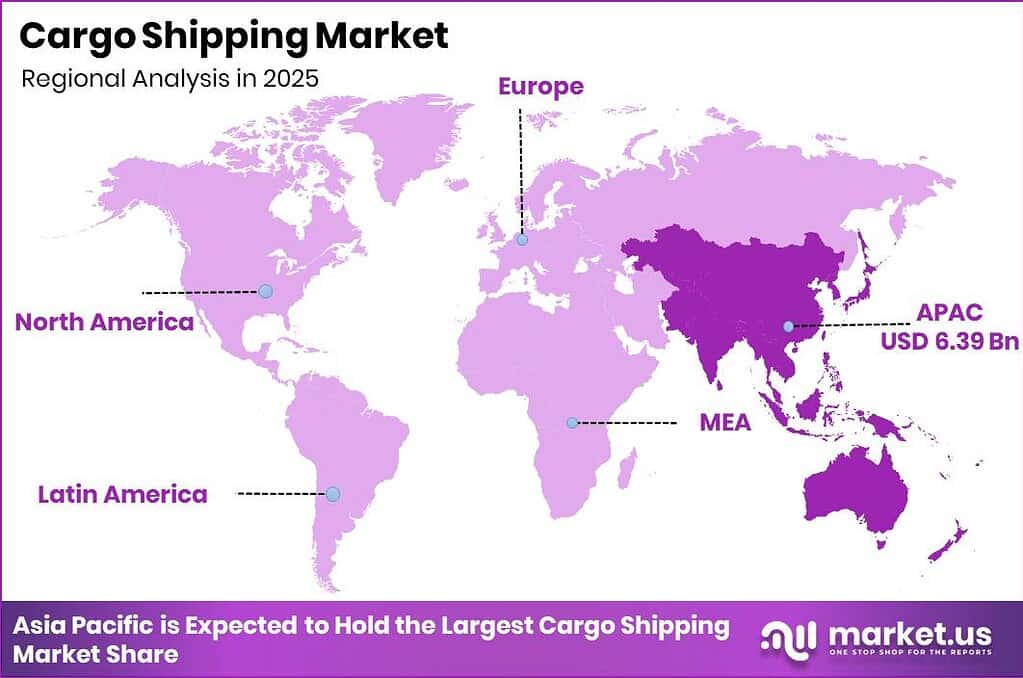
- Asia Pacific leads regionally with a 47.13% share valued at USD 6.39 Billion.
- Reefer and Specialized Vessels, Container Cargo, Pharmaceuticals and Healthcare, and Post-Panamax and Neo-Panamax rank as fastest-growing sub-segments.
Government emissions rules and carbon pricing reshape fleet CapEx as operators order dual-fuel tonnage and plan retrofits under IMO and EU frameworks. Manufacturing end-use growth lifts dry bulk and container liftings because factories pull raw materials and ship finished goods on liner and tramp services. As a result, cargo volumes stay tied to industrial production cycles rather than pure consumer spikes alone.
As per our research, the global tank-container fleet reached 899,044 units on 1 January 2026, up 1.93% from 882,023 units a year earlier. This fleet expansion supports liquid bulk chemical moves and rewards operators who secure long-term storage contracts. Shippers gain flexible intermodal options when tank inventory grows faster than retirements.
Data from ITCO shows manufacturers produced 28,521 new tank containers in 2025 while about 11,500 units left active service. This net addition tightens leasing spreads when idle tanks stay near 15% of the leasing fleet. In 2026, Seanergy Maritime Holdings acquired two Japanese-built 181,500 dwt Capesize vessels, signaling continued dry cargo fleet renewal among bulk specialists.
Ship Type Analysis
Bulk Carriers dominates with 43.00% due to iron ore coal grain tonne-miles.
In 2025, Bulk Carriers held a dominant market position in the By Ship Type segment of Cargo Shipping Market, with a 43.00% share. As reported by UNCTAD, world fleet carrying capacity reached 2.5 billion dwt on 1 January 2026, up 85 million dwt year over year. Bulk units absorb commodity swings and give owners scale on major export corridors. Carriers that time scrapping against deliveries protect earnings when cargo growth slows.
Container Ships move high-frequency consumer and intermediate goods on fixed schedules across main east-west and north-south lanes. Figures from industry fleet tracking show the fully cellular fleet at 6,706 active ships carrying 33.6 million TEU. This scale lets lines monetize premium slots and integrated logistics. Operators who control large TEU banks set contract benchmarks for major retailers.
Tankers haul crude, products, chemicals, LNG, and LPG under strict segregation and coating rules. Odfjell operated 70 chemical tankers with 2.467 million tonnes deadweight at end-2025 and carried 13.392 million tonnes of cargo that year. Specialized chemical capacity earns premiums when parcel complexity rises. Owners with stainless and coated fleets capture higher-margin chemical trades.
General Cargo Ships serve breakbulk and multipurpose routes where containers or pure bulk ships underfit cargo shape. Reefer and Specialized Vessels grow fastest as cold-chain and project cargoes expand. Pacific Basin Shipping invested about USD 119.2 million in four Handysize newbuildings in December 2025, lifting dry bulk flexibility on secondary ports. Niche fleets win when mainline tonnage cannot call smaller berths.
Cargo Type Analysis
Dry Bulk dominates with 74.00% due to commodity export corridor volumes.
In 2025, Dry Bulk held a dominant market position in the By Cargo Type segment of Cargo Shipping Market, with a 74.00% share. According to UNCTAD, maritime trade grew 2.2% in 2024 before slowing toward 0.5% in 2025, with bulk commodities still anchoring tonne-miles. Iron ore, coal, and grain keep utilization high on Capesize and Panamax routes. Traders who lock long-haul contracts stabilize cash flow when spot rates soften.
Container Cargo is the fastest-growing cargo type as e-commerce and SKU-fragmented retail restocking lift TEU demand. US ports handled 16.9 million TEU across the nine largest gateways in H1 2025, up 1.7% year over year per BIMCO port analysis cited in market tracking. Higher TEU velocity supports premium expedited products. Carriers with door-to-door offers capture margin beyond pure ocean slots.
Liquid Bulk covers crude, LNG/LPG, and chemicals that need tank, pipeline, and terminal interfaces. ECTA Responsible Care members recorded 4,282,162 chemical-logistics moves and transported 94,697,172 tonnes in 2024. Chemical parcel complexity raises barriers for generalist fleets. Specialized operators with tank-container and terminal links secure sticky industrial contracts.
End-Use Industry Analysis
Manufacturing dominates with 35.85% due to raw material finished goods flows.
In 2025, Manufacturing held a dominant market position in the By End-Use Industry segment of Cargo Shipping Market, with a 35.85% share. World Bank goods-trade indicators through 2025 show industrial procurement still sets baseline ocean demand even when consumer channels fluctuate. Factories pull ores, intermediates, and components then export finished lots on liner and bulk services. Carriers aligned with industrial hubs win multi-year volume commitments.
Pharmaceuticals and Healthcare is the fastest-growing end-use as temperature-controlled and high-value shipments expand. Reefer capacity and validated cold chains reduce spoilage risk for sensitive products. Shippers pay premiums for monitored lanes and priority stowage. Operators who certify pharma protocols open higher-margin niches than general container boxes.
Food and Beverages depend on bulk grains, refrigerated produce, and packaged goods moving on seasonal peaks. Oil, Gas and Energy cargoes fill tankers and support energy security routes. Electrical and Electronics shipments favor container reliability and schedule integrity. Others cover residual industrial and retail flows. Diversified end-use books cushion carriers when one sector slows.
Vessel Size Class Analysis
Panamax dominates with 37.85% due to canal draft port flexibility balance.
In 2025, Panamax held a dominant market position in the By Vessel Size Class segment of Cargo Shipping Market, with a 37.85% share. Global tracking notes more than 500 traditional Panamax container ships still active, holding just over 2.3 million TEU of capacity. This class balances canal transit, draft limits, and secondary port access. Owners keep Panamax units for trades where ultra-large ships cannot call.
Handy and Handymax vessels serve minor bulk and regional routes with shallow-draft advantage. They load at ports that restrict larger ships and support parcelized dry cargo. Flexibility offsets lower absolute tonne capacity per voyage. Charterers use this class to match fragmented cargo stems.
Post-Panamax and Neo-Panamax form the fastest-growing size class as widened canal rules and hub-and-spoke networks favor larger mid-size units. Ultra-Large Container Vessels concentrate on main trunk lanes between deep-water hubs. Scale cuts unit slot cost but raises cascade risk when demand softens. Lines that cascade tonnage carefully protect network utilization.
Service Type Analysis
Liner (Scheduled) dominates with 79.00% due to fixed weekly network reliability.
In 2025, Liner (Scheduled) held a dominant market position in the By Service Type segment of Cargo Shipping Market, with a 79.00% share. Scheduled loops let retailers and manufacturers plan inventory against published cut-offs. Carrier alliances and independent loops set the backbone of containerized trade. Shippers value predictability enough to accept contract premiums over pure spot tramp rates.
Tramp (Voyage/Spot) services match bulk and tanker cargoes to open tonnage without fixed itineraries. Fixture speed and geographic positioning decide earnings day to day. Owners with efficient chartering desks capture spikes when tonne-miles lengthen. Spot exposure raises earnings volatility versus liner contracts.
Project, Heavy-lift, and Parcel services move out-of-gauge and engineered cargoes that standard boxes cannot handle. ECTA data shows intermodal transport already at 42.0% of member chemical tonne-kilometres versus road at 57.9%. Multimodal project moves need specialized gear and planning. Contractors who combine heavy-lift ships with inland legs win complex industrial bids.
Cargo Shipping Market Segments
By Ship Type
- Bulk Carriers
- Container Ships
- Tankers
- General Cargo Ships
- Reefer and Specialized Vessels
By Cargo Type
- Dry Bulk
- Container Cargo
- Liquid Bulk (Crude, LNG/LPG, Chemicals)
By End-Use Industry
- Manufacturing
- Pharmaceuticals and Healthcare
- Food and Beverages
- Oil, Gas and Energy
- Electrical and Electronics
- Others
By Vessel Size Class
- Panamax
- Handy/Handymax
- Post-Panamax and Neo-Panamax
- Ultra-Large Container Vessels
By Service Type
- Liner (Scheduled)
- Tramp (Voyage/Spot)
- Project/Heavy-lift/Parcel
Regional Analysis
Asia Pacific Dominates the Cargo Shipping Market with a Market Share of 47.13%, Valued at USD 6.39 Billion
Asia Pacific anchors global cargo shipping through export manufacturing, bulk commodity outflows, and dense port clusters in China, Japan, South Korea, India, and Australia. As per our research, the region holds 47.13% share and USD 6.39 Billion value, reflecting its role as the primary origin for containerized and dry bulk liftings. Carriers concentrate mainliner strings and feeder webs here to capture scale. Investors watch Asian yard deliveries because local capacity additions set global supply pace.
North America and Europe remain critical destination and hub markets for Transpacific and Asia-Europe trades, while Latin America and Africa support reefer, bulk, and emerging intra-regional lanes. Cape of Good Hope rerouting has lengthened Asia-Europe tonne-miles and lifted vessel demand on alternative paths. This creates short-term utilization support for owners with flexible deployment. Ports that clear landside bottlenecks retain cargo when schedules stretch.
Key Regions and Countries
North America
- US
- Canada
Europe
- Germany
- France
- The UK
- Spain
- Italy
- Rest of Europe
Asia Pacific
- China
- Japan
- South Korea
- India
- Australia
- Rest of APAC
Latin America
- Brazil
- Mexico
- Rest of Latin America
Middle East and Africa
- GCC
- South Africa
- Rest of MEA
Market Dynamics
Market Opportunity Analysis - Reefer niches, secondary size classes, and emerging lanes reward focused entrants
Reefer and Specialized Vessels remain the fastest-growing ship type yet still sit behind bulk and container scale fleets. Cold-chain gaps in Latin America, Asia-Pacific, and Africa leave room for dedicated reefer operators. New entrants that pair validated pharma protocols with monitored containers capture premium yields. Investors gain exposure to healthcare and food lanes without bidding against mega-alliance slot wars.
Post-Panamax and Neo-Panamax growth outpaces ultra-large cascade risk on secondary hubs. Many regional ports still cannot handle the largest ships efficiently. This creates a structural opening for mid-size fleets on feeder and intra-regional strings. Owners who order Neo-Panamax tonnage early secure better charter cover.
Pharmaceuticals and Healthcare end-use expands faster than manufacturing yet holds a smaller base share. Temperature-controlled capacity and compliance documentation remain uneven across carriers. Specialists who certify lanes end to end win sticky hospital and distributor contracts. Consequently, capital allocated to reefer-as-a-service models can compound faster than general TEU bets.
Tramp and project heavy-lift services trail liner share but serve cargoes liners cannot stow. Out-of-gauge industrial moves and energy project modules need multipurpose ships. Smaller owners with heavy-lift gear face less direct competition from alliance mega-ships. This segment offers acquisition targets when distressed multipurpose tonnage appears.
Technology and Innovation Landscape - Dual-fuel ships, digital documents, and terminal automation reset cost curves
Dual-fuel and methanol-ready newbuilds redefine fleet competitiveness as Wallenius Wilhelmsen’s Arctic Tern shows methanol readiness for vehicle and project cargo. Odfjell’s mix of 32 supersegregators and stainless units illustrates specialized chemical technology leadership. Owners who delay alternative-fuel orders face higher compliance costs after 2027 levies. Shipyards in East Asia capture the order wave and set delivery timelines.
Digital hybrid eECD processes replaced paper cleaning documents at two chemical tank-cleaning stations in 2025. This digitization cuts turnaround friction and audit risk for tank operators. Carriers that standardize electronic certificates reduce dwell at terminals. Software vendors gain recurring revenue as more stations convert.
Odfjell Terminals ran 480 tanks and 1.3 million cubic metres of storage with 96% average commercial occupancy in 2025. Korea terminal E5 added 10 tanks totaling 87,940 cubic metres and reclassified Jetty 1 for vessels up to 50,000 DWT. High occupancy signals scarce quality tank capacity. Terminal investors monetize expansion where inbound throughput still rises double digits.
ECTA member truck fleets reported 95.4% Euro VI vehicles in 2024, showing landside emissions upgrades already advanced. Intermodal shares near 42.0% prove multimodal tech adoption is structural. Ocean carriers that integrate clean trucking and rail legs meet shipper Scope 3 targets. Integrated green corridors become a sales differentiator on chemical and retail accounts.
Drivers
E-commerce-led containerized demand adds an estimated +1.4% above the 4.64% baseline as cross-border parcels convert into TEU liftings. According to UNCTAD, seaborne trade rebounded to 2.2% growth in 2024, with containerized segments outpacing dry bulk on restocking velocity. High-frequency SKU shipments raise slot utilization and let carriers sell expedited services. Operators that own door-to-door fulfilment protect margins when pure ocean spot rates compress.
US ports handled 16.9 million TEU across the nine largest gateways in H1 2025, up 1.7% year over year. Record Q3 2025 container-line net profits near USD 26.8 billion showed how velocity monetizes capacity. This shifts business models from port-to-port slots toward integrated logistics platforms. Buyers gain reliability while sellers expand margin per unit moved.
| Driver | (~) % Impact on CAGR Forecast | Geographic Relevance | Impact Timeline |
|---|---|---|---|
| E-commerce-led containerized demand growth | +1.4% | Asia-Pacific, North America, Europe | Short term (2 years or less) |
| Supply chain diversification & nearshoring flows | +1.1% | North America, Southeast Asia, Mexico | Medium term (2 to 4 years) |
| Cape of Good Hope rerouting tonne-mile inflation | +0.9% | Asia-Europe, Red Sea, Mediterranean | Short term (2 years or less) |
| Fleet renewal & alternative-fuel newbuild delivery | +0.8% | Global; East Asia shipyards | Medium term (2 to 4 years) |
| Cold-chain & reefer trade expansion | +0.6% | Latin America, Asia-Pacific, Africa | Medium term (2 to 4 years) |
| Tariff-driven frontloading & inventory pull-forward | +0.4% | US-China, Transpacific | Short term (2 years or less) |
Restraints
Structural fleet overcapacity deducts an estimated -1.6% from baseline growth as vessel deliveries outrun cargo. Market.us capacity monitoring shows the container fleet expanding roughly 3.7% in 2026, adding about 1.5 million TEUs, while UNCTAD data shows maritime trade growth slowing to 0.5% in 2025 from 2.2% in 2024. Excess slots push blank sailings and idling. Owners delay uncommitted CapEx when utilization falls.
The Market.us World Container Index fell to USD 1,959 per 40-foot container in early February 2026, a 7% single-week drop, with Far East to US West Coast spots near USD 1,889 per FEU. Fleet growth near 3.2% outpaced port-handling growth near 1.5%. Contract rates risk declines of 30% or more in 2026. Participants face thinner margins after the strong 2024 to 2025 earnings cycle.
| Restraint | (~) % Impact on CAGR Forecast | Geographic Relevance | Impact Timeline |
|---|---|---|---|
| Structural fleet overcapacity vs. demand | -1.6% | Global; Transpacific, Asia-Europe | Short term (2 years or less) |
| Tariff escalation contracting core trade lanes | -1.1% | US-China, North America | Short term (2 years or less) |
| Spot freight rate collapse & revenue erosion | -0.9% | Far East to US & Europe trades | Short term (2 years or less) |
| Elevated financing costs on newbuild CapEx | -0.6% | Global; European & Asian owners | Medium term (2 to 4 years) |
| Compliance CapEx for emissions retrofits | -0.4% | Global; EU jurisdiction | Medium term (2 to 4 years) |
| de minimis revocation & low-value parcel drag | -0.3% | US inbound, China origin | Short term (2 years or less) |
Challenges
Decarbonization compliance imposes about -0.9% drag as operators fund fuel transition without a fixed endpoint. Based on the IMO 2023 GHG Strategy, shipping must cut emissions 20% to 30% by 2030 and 70% to 80% by 2040, with at least 5% of energy from net-zero fuels by 2030. Mid-term measures due in 2027 add carbon-intensity levies on ships of 5,000 GT and above. Capital shifts to dual-fuel orders and offtakes instead of pure capacity growth.
Green methanol and ammonia scarcity plus EU ETS pricing create a lasting cost wedge through 2040. Dual-fuel ordering, retrofits, and multi-year fuel contracts become mandatory corporate programs. This challenge opens revenue in compliance advisory, retrofit yards, and certified green corridors. Early movers who secure fuel supply lock cost advantages against late adopters.
| Challenge | (~) % CAGR Friction Drag | Geographic Relevance | Mitigation Horizon |
|---|---|---|---|
| Decarbonization compliance complexity | -0.9% | Global; EU & IMO jurisdiction | Long term (4 years or more) |
| Certified officer talent shortfall | -0.7% | Global; Asia-Pacific supply base | Long term (4 years or more) |
| Geopolitical routing volatility | -0.6% | Red Sea, Suez, Panama | Medium term (2 to 4 years) |
| Port congestion & landside bottlenecks | -0.5% | North America, Europe, Asia | Medium term (2 to 4 years) |
| Alternative-fuel supply & bunkering scarcity | -0.4% | Global; major bunkering hubs | Long term (4 years or more) |
| Cybersecurity & data-integrity exposure | -0.3% | Global; digitalized operators | Medium term (2 to 4 years) |
Opportunities
AI-driven port and voyage platforms offer about +1.3% upside because adoption remains fragmented. UNCTAD lists digitalization among 2025 priorities as efficiency gains stay unrealized. Predictive berthing and just-in-time arrival can cut per-voyage fuel burn by 5% to 10%. Software vendors and carriers that productize these tools create recurring SaaS-like margin layers.
Automated terminals attack landside dwell gaps while vessel fleet growth runs near 3.2%. A certified-officer shortfall near 39,100 STCW officers estimated for 2026 raises the value of remote monitoring tools. Early movers convert labor scarcity into decision-support revenue. Cost-per-TEU falls as digital penetration scales toward 2028.
| Opportunity | (~) % Potential CAGR Upside | Geographic Relevance | Execution Window |
|---|---|---|---|
| AI-driven port & voyage optimization platforms | +1.3% | Global; smart-port hubs | Medium term (2 to 4 years) |
| Vertically integrated end-to-end logistics monetization | +1.0% | North America, Europe, Asia-Pacific | Medium term (2 to 4 years) |
| Green-fuel bunkering & corridor infrastructure | +0.8% | Singapore, Rotterdam, Gulf hubs | Long term (4 years or more) |
| Emerging-market & intra-Africa trade lanes | +0.7% | Sub-Saharan Africa, South Asia | Long term (4 years or more) |
| Distressed-asset M&A roll-up consolidation | +0.5% | Global; regional carriers | Short term (2 years or less) |
| Reefer-as-a-service & pharma cold-chain premiumization | +0.4% | Latin America, Asia, Africa | Medium term (2 to 4 years) |
Key Company Insights
A.P. Moller – Maersk A/S advances fleet renewal to protect long-term ocean capacity and integrated logistics reach. In February 2026 the group ordered eight 18,600 TEU container vessels from New Times Shipbuilding for 2029 and 2030 delivery. This CapEx signals commitment to scale on mainliner trades. Rivals without comparable order books risk slot shortages when cargo recovers.
Mediterranean Shipping Company S.A. competes through network density and flexible deployment across global loops. Tank-container operators managed 629,996 tanks globally at 1 January 2026, with the 10 largest controlling over 52% of operator fleet capacity per ITCO. Concentrated operator control raises barriers for smaller liquid logistics entrants. Scale players set service terms on chemical and parcel trades.
Key Players
- A.P. Moller – Maersk A/S
- Mediterranean Shipping Company S.A.
- CMA CGM Group
- China COSCO Shipping Corporation Limited
- Hapag-Lloyd AG
- DHL International GmbH
- Ocean Network Express Pte. Ltd.
- Evergreen Marine Corp. Ltd.
- Orient Overseas Container Line Limited
- Nippon Express Co. Ltd.
- Zhonggu Logistics Corporation
- ZIM Integrated Shipping Services
- Yang Ming Marine Transport Corporation
- Mitsui O.S.K. Lines Ltd.
- Antong Holdings Co. Ltd.
- Hyundai Merchant Marine Co. Ltd.
- Panalpina World Transport (Holding) Ltd.
- Regional Container Lines
- Swire Shipping
- Pacific International Lines Pte. Ltd.
- Emirates Shipping Line
- Sinokor Merchant Marine Co. Ltd.
- Sea Lead Shipping
- Medical Information Technology Inc.
- SAP
- CPSI
- Meta Inc.
- Elinext Group
- Epic Systems Corporation
- Infor
- Cognizant
- Oracle
- JAG Products LLC
- Allscripts Healthcare
Recent Developments
- February 2026: Hapag-Lloyd signed an agreement to acquire 100% of ZIM Integrated Shipping Services shares in a transaction valued at more than USD 4 billion, creating a combined operation with over 400 vessels and more than 3 million TEU capacity after approvals.
- 2026: CMA CGM Group announced the acquisition of FedEx Supply Chain for USD 1.4 billion to expand warehousing and supply chain capabilities alongside ocean freight.
- February 2025: Maersk and Hapag-Lloyd launched the Gemini Cooperation network, combining around 340 vessels across 29 mainliner services and 28 regional shuttle services.
- 2026: Wallenius Wilhelmsen introduced its first Shaper Class vessel, Arctic Tern, with dual-fuel capability and methanol readiness for vehicle and project cargo.
Geopolitical Impact Analysis
According to UNCTAD, maritime trade growth slowed toward 0.5% in 2025 after 2.2% in 2024 as routing risk and trade policy weighed on volumes. Red Sea and Suez disruptions force Cape of Good Hope diversions that inflate tonne-miles on Asia-Europe cargo shipping lanes. Longer voyages absorb spare vessel capacity and raise bunker burn per shipment. Carriers reprice contracts to recover extra steaming days and war-risk costs.
Data from UNCTAD shows world fleet capacity at 2.5 billion dwt on 1 January 2026, up 85 million dwt, while cargo growth lags new supply. Tariff friction on US-China and Transpacific lanes encourages frontloading then sudden volume gaps. This pattern destabilizes container schedule integrity and dry bulk fixture timing. Operators with flexible tramp and multi-trade fleets reallocate ships faster than pure liner specialists.
Report Scope
| Report Features | Description |
|---|---|
| Market Value (2025) | USD 13.57 Billion |
| Forecast Revenue (2035) | USD 21.36 Billion |
| CAGR (2026-2035) | 4.64% |
| Base Year for Estimation | 2025 |
| Historic Period | 2020-2024 |
| Forecast Period | 2026-2035 |
| Report Coverage | Revenue Forecast, Market Dynamics, Market Opportunity Analysis, Technology and Innovation Landscape, Competitive Landscape, Recent Developments |
| Segments Covered | By Ship Type (Bulk Carriers, Container Ships, Tankers, General Cargo Ships, Reefer and Specialized Vessels), By Cargo Type (Dry Bulk, Container Cargo, Liquid Bulk (Crude, LNG/LPG, Chemicals)), By End-Use Industry (Manufacturing, Pharmaceuticals and Healthcare, Food and Beverages, Oil, Gas and Energy, Electrical and Electronics, Others), By Vessel Size Class (Panamax, Handy/Handymax, Post-Panamax and Neo-Panamax, Ultra-Large Container Vessels), By Service Type (Liner (Scheduled), Tramp (Voyage/Spot), Project/Heavy-lift/Parcel) |
| Regional Analysis | North America (US and Canada), Europe (Germany, France, The UK, Spain, Italy, and Rest of Europe), Asia Pacific (China, Japan, South Korea, India, Australia, and Rest of APAC), Latin America (Brazil, Mexico, and Rest of Latin America), Middle East and Africa (GCC, South Africa, and Rest of MEA) |
| Competitive Landscape | A.P. Moller – Maersk A/S, Mediterranean Shipping Company S.A., CMA CGM Group, China COSCO Shipping Corporation Limited, Hapag-Lloyd AG, DHL International GmbH, Ocean Network Express Pte. Ltd., Evergreen Marine Corp. Ltd., Orient Overseas Container Line Limited, Nippon Express Co. Ltd., Zhonggu Logistics Corporation, ZIM Integrated Shipping Services, Yang Ming Marine Transport Corporation, Mitsui O.S.K. Lines Ltd., Antong Holdings Co. Ltd., Hyundai Merchant Marine Co. Ltd., Panalpina World Transport (Holding) Ltd., Regional Container Lines, Swire Shipping, Pacific International Lines Pte. Ltd., Emirates Shipping Line, Sinokor Merchant Marine Co. Ltd., Sea Lead Shipping, Medical Information Technology Inc., SAP, CPSI, Meta Inc., Elinext Group, Epic Systems Corporation, Infor, Cognizant, Oracle, JAG Products LLC, Allscripts Healthcare |
| Customization Scope | Customization for segments, region / country-level will be provided. Additional customization can be done based on requirements. |
| Purchase Options | We have three licenses to opt for: Single User License | Multi-User License (Up to 5 Users) | Corporate Use License (Unlimited User and Printable PDF) |





































