
Global Car Sharing Market Size, Share, Growth Analysis By Vehicle Class (Economy Cars, Mid-Range Cars, Executive Cars), By Trip Type (One-Way, Round Trip), By Vehicle (Hatchback, Sedan, SUV, Others), By Model (Free Float, Stationary, Peer To Peer), By End Use (Individual, Business, Government Agencies, Non-Profit Organizations), By Area (Intercity, Intracity), By Propulsion (Gasoline, Diesel, BEV, PHEV, HEV, Others), By Region and Companies - Industry Segment Outlook, Market Assessment, Competition Scenario, Statistics, Trends and Forecast 2026-2035
- Published date: Feb 2026
- Report ID: 178308
- Number of Pages: 327
- Format:
-
keyboard_arrow_up
Quick Navigation
Report Overview
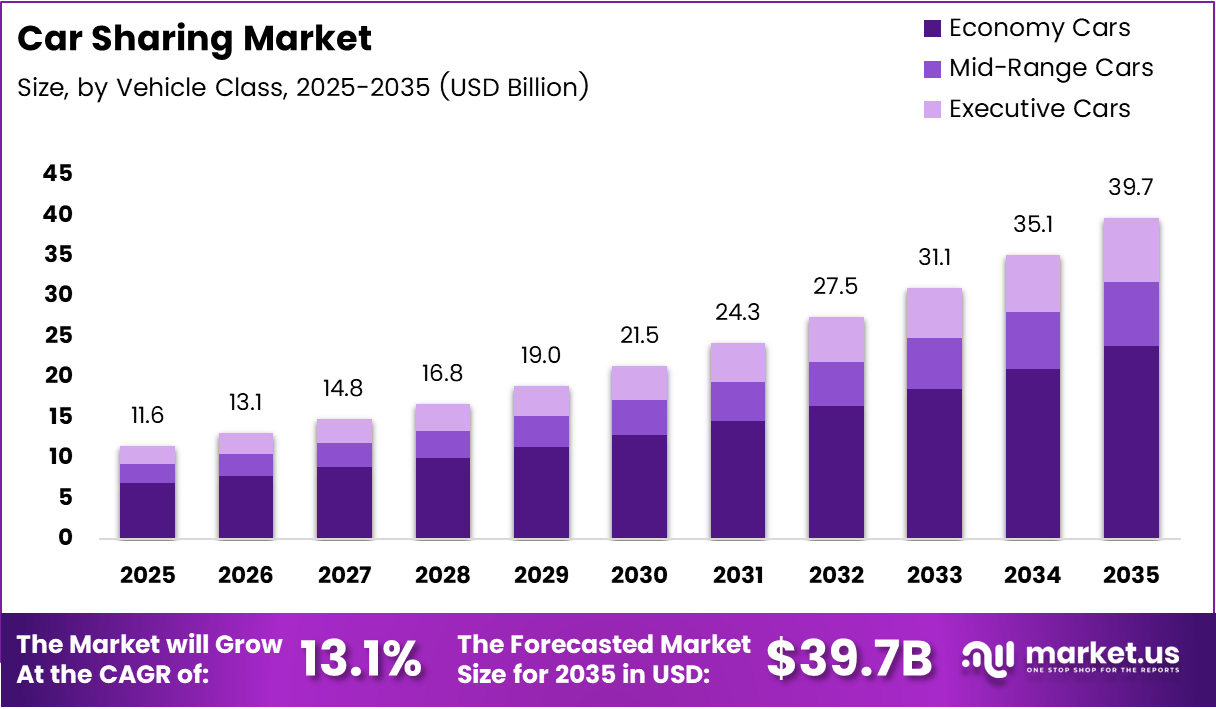
Global Car Sharing Market size is expected to be worth around USD 39.7 Billion by 2035 from USD 11.6 Billion in 2025, growing at a CAGR of 13.1% during the forecast period 2026 to 2035.
Car sharing connects urban residents, business travelers, and occasional drivers to vehicles on demand — without the financial burden of ownership. The model operates across free-float, stationary, and peer-to-peer formats, each serving a distinct urban mobility need. This flexibility positions car sharing as a practical alternative to private vehicle ownership in congested city environments.
The structural case for car sharing strengthens as cities grow denser and private vehicle costs climb. Fuel, insurance, and maintenance now represent a substantial financial burden for most households. Car sharing platforms allow users to pay only for the time and distance they actually use, making urban mobility more efficient and affordable. This cost logic drives consistent adoption across both individual and business user segments.
Governments across North America, Europe, and Asia Pacific actively support shared mobility ecosystems through urban transport planning mandates and emissions reduction targets. Regulatory frameworks increasingly favor low-emission shared fleets over single-occupancy private vehicles. This policy alignment reduces market entry risk for operators and creates a more predictable operating environment for fleet investment decisions.
App-based platforms now serve as the primary distribution channel for car sharing services. Seamless digital booking, contactless unlock, and integrated payment systems have removed the friction that historically limited adoption. Stellantis completed the full integration of Share Now into its Free2move platform in October 2024, creating a single system with access to over 10,000 shared vehicles across Europe and the U.S. — a clear signal that platform consolidation is accelerating.
According to CoMoUK, UK car-sharing active users reached 328,539 in March 2025. This figure reflects a maturing user base that has moved past the early-adopter phase — operators can now plan fleet capacity around predictable demand patterns rather than speculative growth assumptions.
According to Environment Journal, car club membership more than doubled compared to 2019, recording a 122% increase. This long-term adoption curve indicates that the behavioral shift away from private ownership is structural, not cyclical — a distinction that matters enormously for investors evaluating the durability of demand in this market.
Key Takeaways
- The global car sharing market was valued at USD 11.6 Billion in 2025 and is forecast to reach USD 39.7 Billion by 2035 at a CAGR of 13.1%.
- By Vehicle Class, Economy Cars held the largest share at 64.2% in 2025.
- By Trip Type, One-Way trips dominated with a 67.9% share.
- By Vehicle, SUVs led with a 48.4% share.
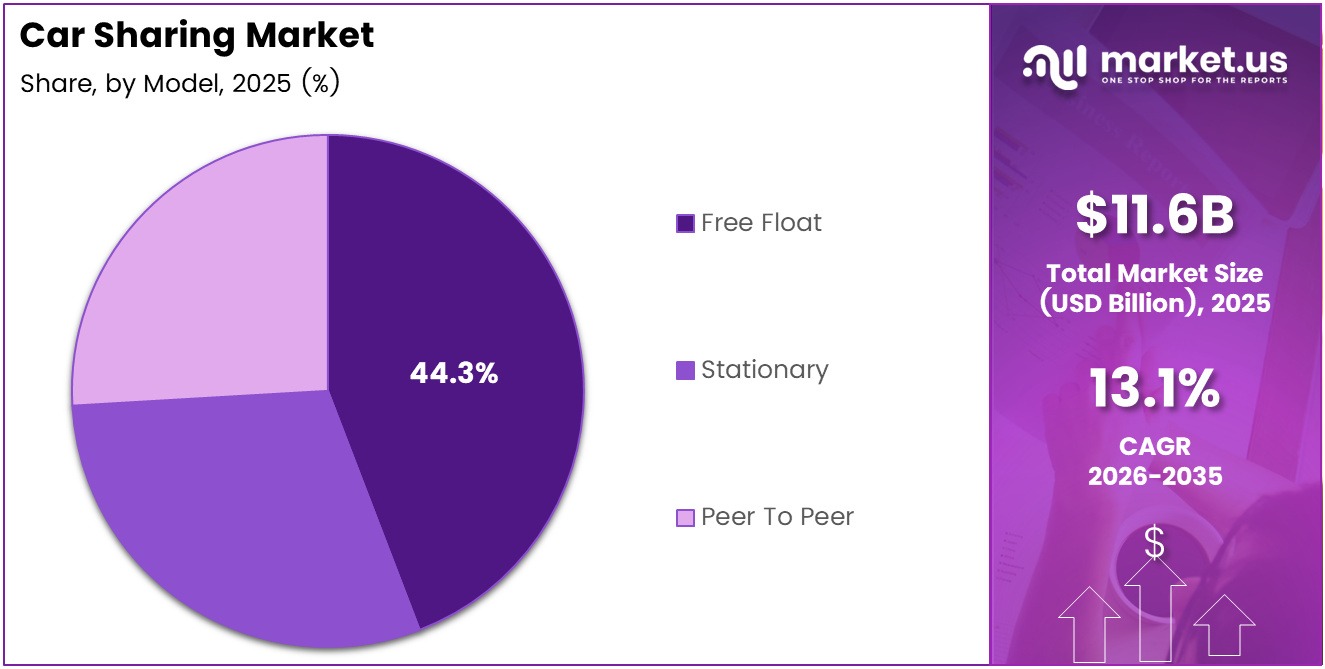
- By Model, Free Float led with a 44.3% share.
- By End Use, Individual users accounted for 61.7% of the market.
- By Area, Intercity car sharing dominated with a 76.6% share.
- By Propulsion, Gasoline vehicles held the leading share at 53.5%.
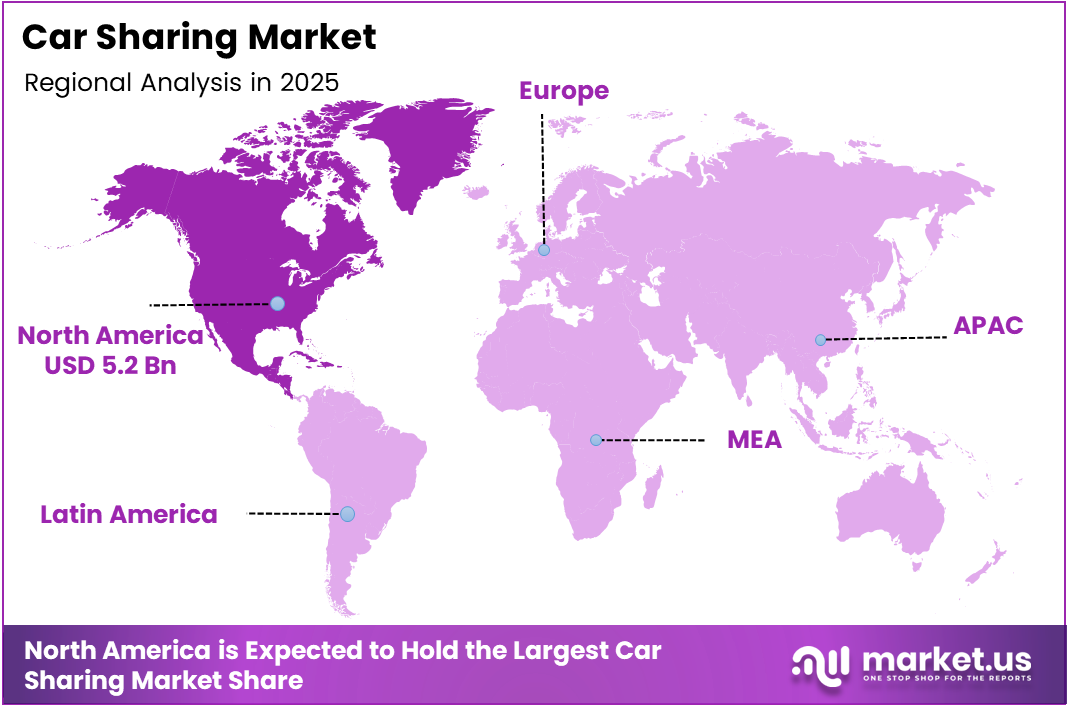
- North America dominated regionally with a 45.20% share, valued at USD 5.2 Billion.
Product Analysis
Economy Cars dominate with 64.2% due to low cost and high urban practicality.
In 2025, Economy Cars held a dominant market position in the By Vehicle Class segment of the Car Sharing Market, with a 64.2% share. Urban commuters prioritize low per-minute costs over comfort — economy vehicles directly match this behavior. According to CoMoUK, the UK shared car fleet reached 5,310 vehicles in 2025, with economy-class models forming the operational core of most urban fleets.
Mid-Range Cars serve corporate and premium leisure users who require more comfort than economy vehicles provide. This segment captures business accounts and weekend-trip users — a buyer profile with higher average spend per booking. Operators that stock mid-range vehicles alongside economy models typically achieve better revenue mix without proportionally increasing fleet complexity.
Executive Cars carry the highest revenue per booking within the vehicle class segment. However, utilization rates run lower than economy or mid-range tiers because the audience is narrower. Operators position executive vehicles near airports, business districts, and premium hotels — locations where willingness to pay is highest and booking frequency can justify the elevated fleet cost.
Trip Type Analysis
One-Way trips dominate with 67.9% due to commuter convenience and urban point-to-point demand.
In 2025, One-Way trips held a dominant market position in the By Trip Type segment of the Car Sharing Market, with a 67.9% share. Urban users rarely need to return a vehicle to the same location — they drive to a destination and continue by other means. This behavior makes one-way models structurally dominant in dense cities where transit networks complement car sharing.
Round Trip bookings serve users who need a vehicle for a fixed duration and plan to return to the same starting point. This model suits grocery runs, day trips, and suburban errands where no alternative return transport exists. Round-trip operators benefit from predictable fleet positioning and lower relocation costs compared to free-float one-way systems.
Vehicle Analysis
SUVs dominate with 48.4% due to multi-passenger capacity and intercity trip preference.
In 2025, SUVs held a dominant market position in the By Vehicle segment of the Car Sharing Market, with a 48.4% share. Users booking for family travel, airport transfers, or intercity journeys consistently choose SUVs over smaller formats. This demand pattern reflects the intercity dominance in the By Area segment — longer trips require more cargo space and passenger comfort.
Hatchbacks anchor city-center fleets where parking space is limited and per-minute cost sensitivity is highest. Their compact dimensions reduce parking costs for operators and match the short-distance, high-frequency usage pattern of urban commuters. Hatchbacks typically generate more daily transactions per vehicle than any other vehicle type in dense urban environments.
Sedans occupy a mid-position between hatchbacks and SUVs in both cost and utility. Business users and airport travelers frequently choose sedans for a balance of comfort and professional appearance. Additionally, sedans show strong performance in peer-to-peer models where vehicle owners list their personal cars — typically mid-size sedans — on sharing platforms.
Others in the vehicle segment include vans, minibuses, and specialty vehicles serving niche use cases such as group transport, moving assistance, or trade-specific applications. While volume is limited, this sub-segment commands the highest per-booking revenue and serves a distinct buyer who cannot substitute with smaller vehicle classes.
Model Analysis
Free Float dominates with 44.3% due to maximum flexibility and station-free urban convenience.
In 2025, Free Float held a dominant market position in the By Model segment of the Car Sharing Market, with a 44.3% share. Users value the ability to pick up and drop off vehicles anywhere within a defined zone — this removes the station-dependency that constrains alternative models. In October 2024, Stellantis completed the full integration of Share Now into its Free2move platform, creating access to over 10,000 shared vehicles across Europe and the U.S. under a single free-float system.
Stationary models require users to collect and return vehicles to fixed locations. This constraint reduces operational complexity for fleet managers and cuts vehicle relocation costs significantly. However, stationary models work best in markets with clear demand nodes — airports, transit hubs, and business districts — where predictable pickup points align with user travel patterns.
Peer To Peer car sharing enables private vehicle owners to monetize idle assets through platform intermediaries. This model scales supply without requiring operators to purchase fleet inventory, lowering capital requirements substantially. Peer-to-peer platforms serve suburban and lower-density markets where traditional operator-owned fleets struggle to achieve sufficient vehicle utilization to justify deployment costs.
End Use Analysis
Individual users dominate with 61.7% due to personal commute and leisure trip behavior.
In 2025, Individual users held a dominant market position in the By End Use segment of the Car Sharing Market, with a 61.7% share. Personal users book vehicles for commuting gaps, leisure trips, and errands — high-frequency, low-duration bookings that generate strong transaction volume. This buyer profile drives platform revenue consistency more reliably than lower-frequency corporate accounts.
Business users represent a structurally different demand profile — lower booking frequency but higher average booking value and predictable repeat usage. Corporate accounts typically negotiate subscription or volume-discount arrangements, giving operators stable revenue floors. Businesses also demonstrate lower price sensitivity than individual users, improving margin per booking across commercial fleets.
Government Agencies use car sharing platforms as a cost-effective alternative to maintaining large government vehicle fleets. Public-sector procurement cycles are slow, but once contracted, government accounts generate long-duration, low-churn revenue. Operators that successfully win government contracts gain anchor revenue that supports fleet investment planning with lower demand uncertainty.
Non-Profit Organizations represent the smallest end-use segment by volume but benefit from favorable pricing arrangements and align with operator sustainability narratives. Non-profits typically use shared vehicles for field operations, community service delivery, and staff transport. Consequently, this segment adds social proof value that supports operator positioning in markets where municipal access and public trust matter.
Area Analysis
Intercity trips dominate with 76.6% due to long-distance demand and higher booking value per trip.
In 2025, Intercity trips held a dominant market position in the By Area segment of the Car Sharing Market, with a 76.6% share. Travelers moving between cities require vehicle access that public transport cannot efficiently provide — car sharing fills this gap at lower cost than rental car alternatives. Longer trip durations mean higher per-booking revenue, making intercity bookings disproportionately valuable to operators relative to short urban trips.
Intracity car sharing serves the dense urban core, where short trips, high parking costs, and congestion pricing make private vehicle ownership inefficient. This segment generates the highest booking frequency per vehicle but also carries higher operational complexity — fleet repositioning, parking management, and vehicle turnaround must be managed continuously to maintain availability.
Propulsion Analysis
Gasoline vehicles dominate with 53.5% due to range reliability and existing infrastructure coverage.
In 2025, Gasoline vehicles held a dominant market position in the By Propulsion segment of the Car Sharing Market, with a 53.5% share. Operators continue to rely on gasoline fleets because refueling infrastructure is universally available and range anxiety does not affect user confidence. However, this dominance reflects existing fleet composition rather than forward investment — new fleet additions increasingly favor electrification.
Diesel vehicles serve markets where long-distance intercity trips are common and fuel economy at highway speeds matters. However, tightening urban low-emission zone regulations in Europe and Asia are systematically removing diesel from city-center shared fleets. Operators with heavy diesel exposure face accelerating compliance costs that will pressure margins over the forecast period.
Battery Electric Vehicles (BEV) represent the fastest-shifting propulsion category in new fleet deployment. Operators face higher upfront acquisition costs, but lower fuel and maintenance costs per kilometer improve long-run economics. Charging infrastructure density determines deployment viability — operators in markets with mature public charging networks gain first-mover cost advantages over competitors still deploying gasoline fleets.
Plug-in Hybrid (PHEV) vehicles bridge the transition between combustion and fully electric operations. They eliminate range anxiety for intercity users while delivering partial emission reductions that satisfy urban low-emission zone requirements. PHEVs carry higher acquisition costs than gasoline equivalents but position operators to serve both urban and intercity segments without fleet bifurcation.
Hybrid Electric Vehicles (HEV) offer improved fuel efficiency without charging infrastructure dependency — an advantage in markets where public charging remains sparse. HEVs reduce per-kilometer fuel costs relative to gasoline while avoiding the range and charging limitations of BEVs. Moreover, HEVs require minimal operational changes from gasoline fleet management, lowering the transition cost for operators expanding their green fleet share.
Others in the propulsion segment include hydrogen fuel cell vehicles and alternative fuel formats currently in pilot deployment. While commercial scale remains limited, hydrogen vehicles attract government co-investment in markets with national clean hydrogen strategies. Therefore, early-stage operator participation in hydrogen pilots creates regulatory goodwill and positions fleets ahead of potential future mandate cycles.
Key Market Segments
By Vehicle Class
- Economy Cars
- Mid-Range Cars
- Executive Cars
By Trip Type
- One-Way
- Round Trip
By Vehicle
- Hatchback
- Sedan
- SUV
- Others
By Model
- Free Float
- Stationary
- Peer To Peer
By End Use
- Individual
- Business
- Government Agencies
- Non-Profit Organizations
By Area
- Intercity
- Intracity
By Propulsion
- Gasoline
- Diesel
- BEV
- PHEV
- HEV
- Others
Drivers
Rising Private Vehicle Ownership Costs Push Urban Residents Toward Shared Mobility
Fuel, insurance, and maintenance costs now consume a material share of household income for urban residents in major metropolitan areas. Car sharing lets users pay only for the kilometers and minutes they actually use — removing the fixed cost burden of ownership entirely. This cost structure shift is the primary behavioral trigger converting private car owners into car sharing subscribers.
According to CoMoUK, as reported by Environment Journal, each shared car replaces approximately 26 to 27 privately owned vehicles. This displacement ratio is commercially significant — it means operators do not need mass fleet deployment to achieve meaningful market penetration. One well-placed vehicle can serve the mobility needs of nearly three dozen households, dramatically improving asset utilization economics.
In May 2025, Free2move confirmed the successful integration and turnaround of its Share Now acquisition — a milestone that demonstrates platform consolidation can deliver operational efficiency gains. This validates the business case for operators: scale reduces per-vehicle costs, and integrated platforms command stronger user retention than fragmented multi-app alternatives.
App-Based Platforms and Digital Payment Integration Remove Adoption Barriers
Smartphone-native car sharing platforms have eliminated the friction that historically prevented casual adoption. Users book, unlock, drive, and pay entirely within a single app — without physical keys, paperwork, or branch visits. This frictionless experience directly competes with private vehicle convenience, narrowing the behavioral gap between ownership and access-based mobility.
Seamless digital payment integration also enables micro-duration bookings — users can reserve a vehicle for 15 minutes without cost penalty. This booking flexibility shifts car sharing from an occasional travel solution into a daily transport option for urban commuters. Operators that invest in payment infrastructure and app reliability gain measurable advantages in user retention and booking frequency.
Urban population density concentrates demand into zones where fleet utilization rates can remain high throughout the day. This density-driven utilization model distinguishes car sharing from traditional car rental, where vehicles sit idle between multi-day bookings. Consequently, operators in high-density cities generate significantly better returns on fleet investment than those serving low-density suburban markets.
Restraints
High Operational Costs and Vehicle Unavailability During Peak Hours Limit Market Reliability
Fleet maintenance, parking fees, congestion charges, and regulatory compliance represent fixed operating costs that operators cannot fully offset through per-minute pricing alone. These costs compound in premium urban markets where parking real estate is expensive and municipal compliance requirements are strict. Operators with thin margins face acute pressure when any cost variable — such as fuel or parking rates — rises unexpectedly.
According to The Irish News, UK public car club users reached approximately 307,437 active members. This figure, while substantial, represents a fraction of the addressable urban population — partly because vehicle unavailability during peak commute hours consistently undermines user confidence. When users cannot find an available vehicle at critical times, they revert to private ownership or competing transport modes, making reliability the single largest conversion barrier.
In December 2025, following Stellantis’s evaluation of a potential sale of its Free2move unit, the market received a clear signal that high operational complexity makes car sharing a difficult business to scale profitably at the platform level. Operators across Europe and North America face a structural tension: growing user bases require larger fleets, but larger fleets increase fixed costs faster than revenue scales — a constraint that restrains aggressive market expansion.
Growth Factors
EV Fleet Integration and Corporate Mobility Subscriptions Open New Revenue Streams
Electric vehicle fleets reduce per-kilometer fuel and maintenance costs relative to gasoline equivalents, improving operator unit economics over time. As EV acquisition prices decline and public charging infrastructure matures, the cost case for electric car sharing fleets strengthens. In May 2025, Free2move expanded its pure car-sharing EV fleet by adding approximately 300 Fiat 500e vehicles across Berlin, Cologne, and Düsseldorf — demonstrating that EV fleet scaling is commercially executable today.
According to Environment Journal, based on a CoMoUK survey of over 8,600 users, approximately 780,000 people have signed up to shared vehicle access programs. This user base represents a mature demand pool that corporate mobility subscription programs can directly target. Employers offering car sharing as an employee benefit gain a cost-efficient mobility solution while operators secure recurring subscription revenue with lower churn than pay-per-trip models.
Expansion into Tier-2 and Tier-3 cities with rising middle-class populations creates a second-wave growth opportunity for operators who have already established profitable operations in Tier-1 urban markets. These cities carry lower fleet deployment costs, less competition, and growing commuter populations who lack mature public transit alternatives. AI-based demand forecasting further enables operators to right-size fleet deployment in new geographies without over-investing in inventory ahead of proven demand.
Emerging Trends
Subscription Access Models and Multimodal Integration Reshape How Cities Think About Car Sharing
Subscription-based car access programs replace pay-per-trip economics with predictable monthly revenue for operators and fixed mobility budgets for users. This model shift changes the competitive dynamic — operators compete on subscription value and vehicle availability rather than per-minute pricing alone. Early movers in subscription car sharing gain a structural loyalty advantage that pay-per-trip platforms cannot easily replicate.
According to Environment Journal and CoMoUK survey data, the average car-sharing user drives approximately 153 miles per year through shared platforms. This low annual mileage confirms that most users treat car sharing as a complement to public transit — not a full vehicle replacement. Consequently, operators and city planners who integrate car sharing with metro and bus networks capture users at the point where transit ends and personal mobility begins.
Telematics and IoT-enabled vehicle tracking now allow operators to monitor fleet health in real time, predict maintenance needs before breakdowns occur, and reduce vehicle downtime. Contactless, app-only unlock features further reduce operational touchpoints and associated labor costs. Together, these technologies shift car sharing operations from reactive fleet management toward predictive, data-driven efficiency — a capability gap that separates scaled operators from smaller market entrants.
Regional Analysis
North America Dominates the Car Sharing Market with a Market Share of 45.20%, Valued at USD 5.2 Billion
North America holds 45.20% of the global car sharing market, valued at USD 5.2 Billion in 2025. Mature digital payment infrastructure, high smartphone penetration, and early regulatory support for shared mobility ecosystems established this region’s lead. Dense urban centers in the U.S. and Canada generate consistent fleet utilization rates that sustain operator profitability at scale.
Europe Car Sharing Market Trends
Europe represents the second-largest region, driven by aggressive urban decarbonization mandates and congestion charging policies that directly penalize private vehicle use. Cities including London, Paris, Berlin, and Amsterdam have established low-emission zones that structurally advantage shared EV fleets over privately owned combustion vehicles. These regulatory conditions reduce operator acquisition risk and accelerate fleet electrification timelines.
Asia Pacific Car Sharing Market Trends
Asia Pacific holds substantial long-term expansion potential, anchored by China’s massive urban population, rising disposable incomes, and government-backed smart city initiatives. India and Southeast Asian markets are entering early-stage adoption as middle-class commuter populations in Tier-1 cities outgrow private vehicle budgets. Platform operators with mobile-first infrastructure are best positioned to capture this demand at scale.
Latin America Car Sharing Market Trends
Latin America’s car sharing market develops unevenly, with Brazil and Mexico leading adoption in megacity corridors where traffic congestion makes private vehicle ownership increasingly impractical. Affordability constraints limit penetration to urban professionals with smartphone access and bank account infrastructure for digital payments. However, the addressable commuter population in São Paulo and Mexico City alone represents a commercially significant user base for early movers.
Middle East and Africa Car Sharing Market Trends
The Middle East and Africa region remains at an early commercial stage, with deployment concentrated in Gulf Cooperation Council cities including Dubai and Riyadh. Government smart city agendas in the UAE and Saudi Arabia actively support mobility-as-a-service infrastructure development, creating a policy-backed entry opportunity. Africa’s longer-term potential depends on urban infrastructure maturity and smartphone and banking penetration growth timelines.
Key Regions and Countries
North America
- US
- Canada
Europe
- Germany
- France
- The UK
- Spain
- Italy
- Rest of Europe
Asia Pacific
- China
- Japan
- South Korea
- India
- Australia
- Rest of APAC
Latin America
- Brazil
- Mexico
- Rest of Latin America
Middle East & Africa
- GCC
- South Africa
- Rest of MEA
Key Company Insights
Cambio Mobilitäts Service operates a station-based car sharing model across Germany and Belgium, targeting urban residents and businesses that need predictable vehicle access rather than free-float flexibility. Its station-based approach reduces vehicle repositioning costs and supports corporate account management more efficiently than free-float competitors. This operational discipline gives Cambio a margin advantage in markets where parking cost management is critical.
Communauto holds the distinction of being North America’s longest-running car sharing operator, giving it a loyalty depth and brand recognition that new entrants cannot replicate quickly. Its hybrid model — combining station-based and one-way options — allows it to serve a broader urban user profile than single-model competitors. Consequently, Communauto captures both habitual commuter users and occasional trip users within the same platform infrastructure.
Free2Move benefits from Stellantis’s manufacturing scale and multi-brand vehicle portfolio, giving it fleet acquisition advantages unavailable to independent operators. Its successful consolidation of Share Now into a single platform with access to over 10,000 shared vehicles across Europe and the U.S. demonstrates platform integration capability at enterprise scale. However, reported evaluations of a potential sale in October 2025 introduce strategic uncertainty that competitors may attempt to exploit.
Getaround differentiates through its peer-to-peer model, which allows private car owners to monetize idle vehicles without operator-owned fleet investment. This asset-light approach enables geographic expansion at lower capital cost than traditional operator-owned models. Getaround’s competitive positioning depends on building a dense supply of listed vehicles in target markets — a network effect dynamic where supply density directly determines user booking success rates and platform retention.
Key Players
- Cambio Mobilitäts Service
- Communauto
- Free2Move
- Getaround
- GoGet
- Mobility Carsharing
- Sixt
- Turo
- Zipcar
Recent Developments
- March 2024 — Vehicle-financing and mobility platform Moove raised $100 million in Series B funding, reaching a valuation of $750 million. The company announced plans to expand into 16 global markets by 2025, signaling investor confidence in scaled mobility financing infrastructure.
- 2025 — Lyft agreed to acquire European mobility app FreeNow for approximately €175 million, marking a significant cross-continental strategic move. The acquisition positions Lyft to compete directly with established European shared mobility operators and reduces its dependency on the North American ride-hail market.
- December 2025 — Zipcar announced the closure of its UK operations, citing rising costs, congestion charge changes, and sustained financial losses. This exit reshapes the UK car sharing competitive landscape, removing one of the market’s most recognized brands and creating a fleet availability gap that remaining operators are actively evaluating.
- Late 2025 — Uber launched a robotaxi service in Dallas through a strategic partnership, expanding its shared mobility model into autonomous vehicle operations. This move signals a next-generation business model direction for shared transport — one that eliminates driver cost from the unit economics equation entirely.
- May 2024 — Zoomcar announced ecosystem partnerships with Cars24, ACKO Drive, Spinny, and Droom, alongside fleet expansion plans targeting 20,000 cars by FY2025. These partnerships accelerate vehicle supply growth without proportional capital expenditure, applying a platform aggregation model to car sharing supply-side scaling.
Report Scope
Report Features Description Market Value (2025) USD 11.6 Billion Forecast Revenue (2035) USD 39.7 Billion CAGR (2026-2035) 13.1% Base Year for Estimation 2025 Historic Period 2020-2024 Forecast Period 2026-2035 Report Coverage Revenue Forecast, Market Dynamics, Competitive Landscape, Recent Developments Segments Covered By Vehicle Class (Economy Cars, Mid-Range Cars, Executive Cars), By Trip Type (One-Way, Round Trip), By Vehicle (Hatchback, Sedan, SUV, Others), By Model (Free Float, Stationary, Peer To Peer), By End Use (Individual, Business, Government Agencies, Non-Profit Organizations), By Area (Intercity, Intracity), By Propulsion (Gasoline, Diesel, BEV, PHEV, HEV, Others) Regional Analysis North America (US and Canada), Europe (Germany, France, The UK, Spain, Italy, and Rest of Europe), Asia Pacific (China, Japan, South Korea, India, Australia, and Rest of APAC), Latin America (Brazil, Mexico, and Rest of Latin America), Middle East & Africa (GCC, South Africa, and Rest of MEA) Competitive Landscape Cambio Mobilitäts Service, Communauto, Free2Move, Getaround, GoGet, Mobility Carsharing, Sixt, Turo, Zipcar Customization Scope Customization for segments, region/country-level will be provided. Moreover, additional customization can be done based on the requirements. Purchase Options We have three licenses to opt for: Single User License, Multi-User License (Up to 5 Users), Corporate Use License (Unlimited User and Printable PDF) 
-
-
- Cambio Mobilitäts Service
- Communauto
- Free2Move
- Getaround
- GoGet
- Mobility Carsharing
- Sixt
- Turo
- Zipcar
Our Clients
- 178308
- Feb 2026


