


Report Overview
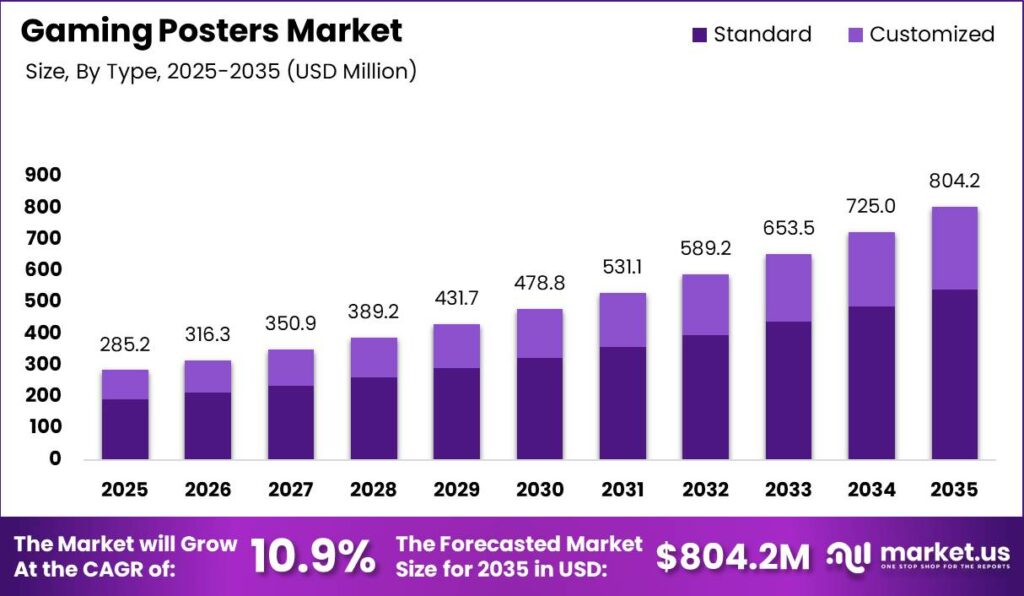
Global Gaming Posters Market size is expected to be worth around USD 804.20 Million by 2035 from USD 285.20 Million in 2025, growing at a CAGR of 10.9% during the forecast period 2026 to 2035. This trajectory nearly triples the revenue base within a decade. Investors gain a clear window to enter before licensing consolidation and premium tiers lock in leading positions.
Therefore, the market centers on printed wall art that features game characters, scenes, concept art, and esports branding. Sellers structure supply around two production models. One relies on standard mass-run prints for broad retail reach. The other uses print-on-demand for customized designs. This split lets small sellers compete without carrying inventory, widening the field of viable market participants.
Key Takeaways
- Global Gaming Posters Market size will reach USD 804.20 Million by 2035 from USD 285.20 Million in 2025.
- The market grows at a CAGR of 10.9% during 2026 to 2035.
- Standard posters lead the By Type segment with a 67.4% share.
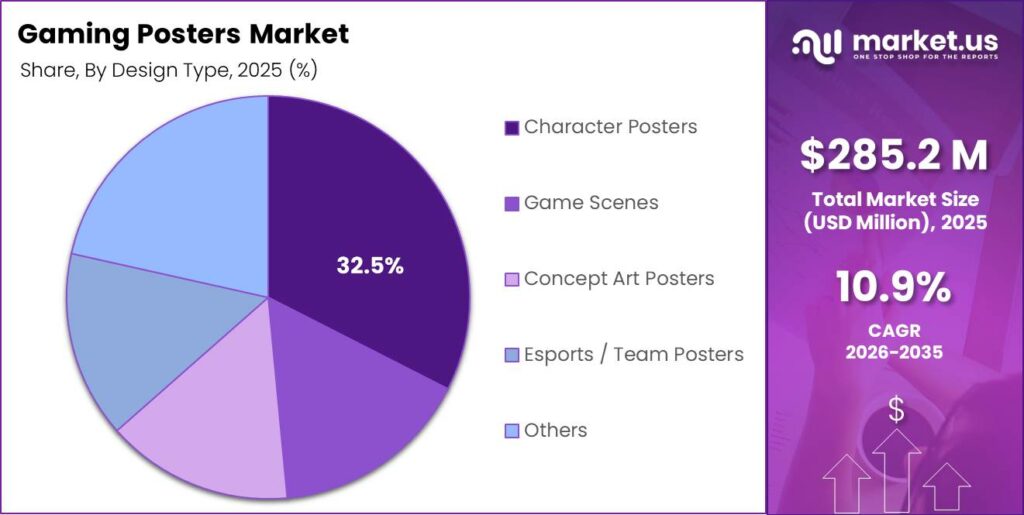
- Character Posters lead the By Design Type segment with a 32.5% share.
- Household applications dominate demand with a 67.5% share.
- Online Retail leads distribution with a 56.8% share.
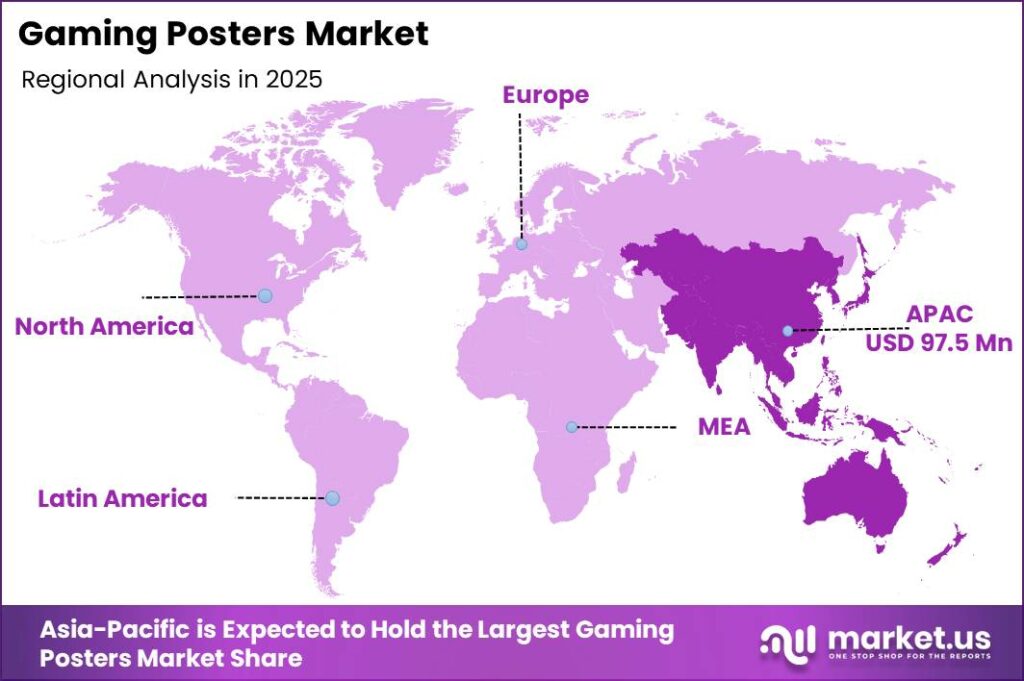
- Asia-Pacific dominates with a 34.2% share, valued at USD 97.5 Million.
As per our research, personalized products now anchor a rising share of custom poster orders as buyers seek player identity and achievement-based designs. This preference rewards sellers with flexible print workflows. Companies that adopt on-demand personalization capture repeat orders that fixed-catalog rivals cannot serve, protecting long-term revenue.
According to the Entertainment Software Association, U.S. consumer spending on video games reached USD 59.3 Billion in 2024. This scale confirms a deep buyer pool already committed to gaming culture. Poster sellers who attach merchandise to active franchises convert that spending into decorative product demand, lifting attach rates across the ecosystem.
Data from the Entertainment Software Association shows 89% of gamers played video games online in 2025. This near-universal engagement signals large, connected communities that buy franchise collectibles. Sellers who market through creator and esports channels reach these buyers directly, cutting acquisition cost and speeding inventory turnover.
Type Analysis
Standard posters dominate with 67.4% due to low-cost mass print runs.
In 2025, Standard held a dominant market position in the By Type segment of Gaming Posters Market, with a 67.4% share. Entertainment Software Association data shows 89% of gamers played online in 2025, creating a broad base for franchise wall art. This means sellers move high volumes at low unit cost. Vendors who lead standard lines with popular titles capture shelf space before premium tiers mature.
Customized posters serve buyers who want personalized designs tied to avatars and achievements. Print-on-demand platforms enable single-unit production without inventory risk. Everanta’s 2025 wall-poster range offers 1,000+ designs across gaming and aesthetic themes on 300 GSM prints. This means sellers can test niche demand cheaply. Operators who scale personalization win margin as buyers pay more for identity-driven artwork.
Design Type Analysis
Character posters dominate with 32.5% due to strong franchise fan attachment.
In 2025, Character Posters held a dominant market position in the By Design Type segment of Gaming Posters Market, with a 32.5% share. Everanta’s 2025 range spans 1,000+ designs across anime and gaming themes, showing deep character catalog demand. This means franchise likeness drives most purchases. Sellers who secure popular character rights convert fan loyalty into steady sales.
Game Scenes appeal to buyers who want immersive environment artwork rather than single characters. These designs suit larger format displays. A 2026 MagneticArt guide notes Displate metal posters start at USD 44 for size M and USD 89 for size L. This means scene prints support premium pricing. Sellers who target scene fans lift average order value across durable formats.
Concept Art Posters attract collectors who value pre-release and behind-the-scenes visuals. Esports and Team Posters serve fan bases tied to competitive tournaments and branded squads. Others cover mixed and experimental designs. Everanta’s 9-piece gaming set uses 300 GSM premium artboard across multi-panel installations. This means multi-piece formats open new upsell paths. These three design types together hold the remaining share, giving sellers room to test niche themes.
Application Analysis
Household dominates with 67.5% due to gaming room decor demand.
In 2025, Household held a dominant market position in the By Application segment of Gaming Posters Market, with a 67.5% share. Everanta’s 2025 range explicitly targets bedrooms and gaming rooms with 300 GSM HD prints. This means home buyers drive most volume. Sellers who market room-specific bundles capture repeat purchases as gamers refresh personal spaces.
Commercial buyers include game stores, cafes, and event venues that display posters to build atmosphere. These accounts order in bulk and favor durable substrates. MagneticArt data shows Displate metal posters priced at USD 44 to USD 89 per piece. This means commercial demand rewards premium, damage-resistant formats. Sellers who serve venues lock in larger recurring contracts than household orders alone provide.
Distribution Channel Analysis
Online Retail dominates with 56.8% due to broad print-on-demand reach.
In 2025, Online Retail held a dominant market position in the By Distribution Channel segment of Gaming Posters Market, with a 56.8% share. Entertainment Software Association data shows 89% of gamers played online in 2025, matching buyers to digital storefronts. This means online channels reach buyers where they already spend time. Sellers who scale marketplace listings capture demand without physical footprint costs.
Offline Retail covers game stores, supermarkets and hypermarkets, and other physical outlets. Game stores connect posters to point-of-sale gaming purchases. Supermarkets and hypermarkets add impulse reach across broad foot traffic. In May 2025, Displate joined Licensing Expo 2025 to expand entertainment and gaming brand partnerships. This means offline channels still anchor licensed distribution. Game stores, supermarkets and hypermarkets, and other outlets together hold the remaining share.
Key Market Segments
By Type
- Standard
- Customized
By Design Type
- Character Posters
- Game Scenes
- Concept Art Posters
- Esports / Team Posters
- Others
By Application
- Commercial
- Household
By Distribution Channel
- Online Retail
- Offline Retail
- Game stores
- Supermarkets & Hypermarket
- Others
Regional Analysis
Asia-Pacific Dominates the Gaming Posters Market with a Market Share of 34.2%, Valued at USD 97.5 Million
Asia-Pacific leads the Gaming Posters Market with a 34.2% share, valued at USD 97.5 Million in 2025. The region’s large console and PC installed base fuels franchise merchandise demand. In July 2025, Sony and Bandai Namco signed a strategic alliance, with Sony acquiring roughly 2.5% of Bandai Namco shares. This means licensed anime and gaming IP will expand across the region. Sellers who align with these franchises gain first access to fresh demand.
North America grows on strong direct-to-consumer e-commerce and gaming room decor trends. The Entertainment Software Association reports U.S. video game spending reached USD 59.3 Billion in 2024. This means a deep buyer pool already funds the ecosystem. Sellers who market personalized and premium posters to this base convert high engagement into rising order values.
Key Regions and Countries
North America
- US
- Canada
Europe
- Germany
- France
- The UK
- Spain
- Italy
- Rest of Europe
Asia Pacific
- China
- Japan
- South Korea
- India
- Australia
- Rest of APAC
Latin America
- Brazil
- Mexico
- Rest of Latin America
Middle East and Africa
- GCC
- South Africa
- Rest of MEA
Market Dynamics
Market Opportunity Analysis - Underserved design types, applications, and personalization tiers open entry points for new players
Customized posters remain underexploited against Standard’s 67.4% lead in the By Type segment. New entrants can target the smaller custom share where large mass-print sellers hold weak positions. This means personalization becomes a defensible niche. Investors who back flexible print-on-demand operators enter a space where incumbents lack the workflow to compete on identity-driven designs.
Esports and Team Posters sit outside Character Posters’ 32.5% design lead, leaving room in fan-driven artwork. This subsegment ties directly to tournament and squad loyalty that resells across seasons. This creates repeat demand that static character prints cannot match. New entrants who lock esports partnerships early capture a rising fan base before larger poster houses respond.
Commercial applications trail Household’s 67.5% dominance, signaling an underserved bulk-order channel. Game stores, cafes, and event venues need durable display artwork at scale. This means B2B accounts offer larger contract values than single home orders. Investors who fund sellers targeting commercial venues secure recurring revenue that consumer-only rivals overlook.
Offline Retail sits below Online Retail’s 56.8% share, leaving physical channels open in emerging markets. Game stores and hypermarkets reach buyers who prefer in-person purchase. By contrast, most sellers crowd digital storefronts. New entrants who build offline distribution in underpenetrated regions gain shelf presence where online competition stays thin.
Technology and Innovation Landscape - Digital printing, AI design tools, and premium substrates redefine competitive edges
On demand digital printing reshapes production by removing minimum run requirements entirely. Sellers now fulfill single units profitably rather than stocking bulk inventory. This means manufacturers shift capital away from unsold stock toward customer acquisition. Operators who adopt roll to roll and flatbed systems undercut wholesale rivals on flexibility and speed to market.
AI-powered design tools accelerate personalized artwork creation across gaming themes. In July 2025, Displate partnered with Google Cloud to integrate Gemini AI into its creative ecosystem. This means artwork development speeds up while customer experience improves. Manufacturers who deploy AI workflows produce more designs per artist, lowering the cost of serving niche fan demand profitably.
Premium substrates such as 300 GSM matte artboard and metal prints raise the durable wall art tier. Everanta standardizes 300 GSM across multi-panel gaming sets in 2025. This means buyers accept higher price points for quality finishes. Manufacturers who move to heavier substrates capture margin as gaming decor shifts from disposable prints to lasting display pieces.
Augmented reality integration adds an interactive layer to physical posters through printed markers. This innovation triggers animated scenes or in-game avatars on a buyer’s smartphone. This means posters gain recurring software value beyond the print itself. Manufacturers who productize AR features attach digital revenue to physical goods, opening a moat pure print sellers cannot cross.
Drivers
The scale-up of on demand digital printing is the strongest driver, adding an estimated +2.9% above the 10.9% baseline. This technology removes the old need for minimum runs of 500 to 1,000 units per design. Instead sellers fulfill single units at healthy margins. As a result, working capital moves out of unsold stock, lifting contribution margins by an estimated 8 to 12 percentage points for asset light operators.
Wide format printer imports into the US and Germany climbed at a double digit annual pace through 2025, per national customs data. This growth cut the effective cost per poster from roughly USD 3.50 to under USD 1.80 at scale. This means small sellers can serve many regions from one micro fulfilment node. Companies that redeploy freed capital into paid social channels capture share faster than warehouse-heavy rivals.
| Driver | (~) % Impact on CAGR Forecast | Geographic Relevance | Impact Timeline |
|---|---|---|---|
| On demand digital printing scale up | +2.9% | North America, Western Europe | Short term (2 years or less) |
| Direct to consumer e commerce shift | +2.4% | Global | Short term (2 years or less) |
| Expanding console and PC installed base | +1.8% | Asia Pacific, North America | Medium term (2 to 4 years) |
| Official IP licensing collaborations | +1.6% | Japan, North America, Europe | Medium term (2 to 4 years) |
| Streaming and creator merch integration | +1.3% | Global | Short term (2 years or less) |
| Home office and gaming room decor trend | +1.0% | North America, Middle East | Medium term (2 to 4 years) |
Restraints
Aggressive copyright and trademark enforcement by game publishers is the dominant restraint, cutting an estimated 2.7% from the baseline. Most poster demand attaches to protected character likenesses rather than original art. Under the US Digital Millennium Copyright Act of 1998, unlicensed listings can vanish within the statutory 10 to 14 day counter notice window. This means live revenue can freeze overnight for non-compliant sellers.
Compliant operators must divert an estimated 6 to 10 percent of net revenue into licensing royalties and legal review. Gaming franchise mark filings intensified sharply through 2024 and 2025, per USPTO register activity. This means unauthorized volume that once padded the market gets removed structurally. As a result, sellers delay new print capacity investment until they secure clear rights.
| Restraint | (~) % Impact on CAGR Forecast | Geographic Relevance | Impact Timeline |
|---|---|---|---|
| IP infringement takedowns and bans | -2.7% | North America, Europe | Short term (2 years or less) |
| Elevated interest rates on working capital | -1.9% | Global | Short term (2 years or less) |
| Paper and pulp input cost inflation | -1.5% | Europe, Asia Pacific | Short term (2 years or less) |
| Platform marketplace listing restrictions | -1.2% | North America | Medium term (2 to 4 years) |
| Cross border tariff and import duties | -0.9% | North America, Asia Pacific | Medium term (2 to 4 years) |
Challenges
Franchise by franchise rights negotiation imposes the largest friction drag at an estimated 1.8%. No central clearinghouse exists for interactive entertainment IP, so individual deals can take 6 to 12 months to close. Major publisher consumer products divisions apply royalty rates commonly in the 10 to 18 percent range, per SEC filings. This means breakeven volume per title rises sharply for smaller sellers.
Approval cycles on artwork add weeks of lead time and tie up an estimated 4 to 7 percent of operating expense in legal and account overhead. This creates a clear revenue path for firms that build pre-cleared design libraries. Companies that operate dedicated rights teams amortize this fixed cost across many titles. Early movers who solve licensing friction open a service niche rivals cannot match.
| Challenge | (~) % CAGR Friction Drag | Geographic Relevance | Mitigation Horizon |
|---|---|---|---|
| Fragmented licensing negotiation friction | -1.8% | Global | Long term (4 years or more) |
| Return rates and print defects | -1.1% | North America, Europe | Medium term (2 to 4 years) |
| Last mile shipping damage exposure | -0.9% | Global | Medium term (2 to 4 years) |
| Design talent and art sourcing scarcity | -0.8% | North America, Western Europe | Long term (4 years or more) |
| Trend cycle and title obsolescence risk | -0.7% | Global | Short term (2 years or less) |
Opportunities
The fusion of user personalization with augmented reality overlays represents genuine white space, offering an estimated +2.6% upside. The market today sells static licensed prints, so this interactive layer stays unmonetized at scale. AR marker and computer vision filings reached commercial readiness through 2025, per WIPO classification trends. This means posters can now trigger animated scenes or in-game avatars.
A personalized AR-enabled poster commands an estimated 25 to 40 percent price premium over a standard print. Incremental cost per unit rises only USD 2 to USD 4 for software and marker integration. This means gross margin expands by an estimated 10 to 15 percentage points. Early movers who build AR platforms capture demand that pure print players cannot serve without deliberate investment.
| Opportunity | (~) % Potential CAGR Upside | Geographic Relevance | Execution Window |
|---|---|---|---|
| Personalized and augmented reality posters | +2.6% | North America, Asia Pacific | Medium term (2 to 4 years) |
| Emerging market gamer base penetration | +2.1% | India, Southeast Asia, Latin America | Long term (4 years or more) |
| Limited edition collectible drop models | +1.7% | North America, Japan | Medium term (2 to 4 years) |
| Esports arena and event retail channel | +1.4% | Global | Medium term (2 to 4 years) |
| Sustainable substrate premium tier | +1.0% | Western Europe, North America | Long term (4 years or more) |
Key Company Insights
Grindstore Ltd holds a structural advantage through its established licensed music and gaming merchandise catalog across European retail. This breadth lets the company cross-sell posters alongside apparel and accessories. Grindstore’s wholesale relationships give it distribution reach that pure online sellers lack. However, its wholesale focus leaves a gap in direct personalization, exposing it to nimble print-on-demand challengers that own the customer relationship.
Society6, LLC builds its edge on an artist-driven print-on-demand model that hosts a vast independent designer base. This structure removes inventory risk and refreshes designs continuously. Society6 converts creator communities into a steady flow of original gaming artwork. This creates a licensing risk, since much fan art touches protected franchise IP. Society6 must invest in rights review to protect its catalog from takedown exposure.
Key Players
- Grindstore Ltd
- Society6, LLC
- Redbubble
- Poster Foundry
- Meeple Design
- Mason City Poster Company
- Green Panda Printers Pvt. Ltd.
- GB Eye Limited
- Game & Graphics
- Fangamer LLC
- Etsy
- Displate
- Art.com, Inc.
- AllPosters.com
- AB Posters
Recent Developments
- July 2025: Displate expanded its AI capabilities by partnering with Google Cloud to integrate Gemini AI into its creative and fandom ecosystem, supporting faster artwork development and improved customer experiences.
- November 2025: Nintendo announced the acquisition of Bandai Namco Studios Singapore, which will become Nintendo Studios Singapore, strengthening Nintendo’s global game development capabilities.
Geopolitical Impact Analysis
According to the World Trade Organization, global merchandise trade volume growth slowed to around 2.7% in recent years amid rising tariff friction. Cross border poster shipments face import duties that add an estimated 0.9% drag on regional pricing. This means sellers sourcing paper and printed goods across borders absorb higher landed costs. Companies that localize print nodes near demand centers reduce exposure to duty volatility and protect margin.
Figures from the World Shipping Council show container freight rates spiked over 150% above baseline during recent Red Sea rerouting events. Longer transit adds delivery delays that raise last mile damage risk for fragile poster tubes and framed prints. This means physical gaming decor faces higher logistics cost than digital rivals. Therefore, sellers that shift toward regional print-on-demand cut transit distance and shield delivery reliability from shipping disruption.
Report Scope
| Report Features | Description |
|---|---|
| Market Value (2025) | USD 285.20 Million |
| Forecast Revenue (2035) | USD 804.20 Million |
| CAGR (2026-2035) | 10.9% |
| Base Year for Estimation | 2025 |
| Historic Period | 2020-2024 |
| Forecast Period | 2026-2035 |
| Report Coverage | Revenue Forecast, Market Dynamics, Market Opportunity Analysis, Technology and Innovation Landscape, Competitive Landscape, Recent Developments |
| Segments Covered | By Type (Standard, Customized), By Design Type (Character Posters, Game Scenes, Concept Art Posters, Esports / Team Posters, Others), By Application (Commercial, Household), By Distribution Channel (Online Retail, Offline Retail [Game stores, Supermarkets & Hypermarket, Others]) |
| Regional Analysis | North America (US and Canada), Europe (Germany, France, The UK, Spain, Italy, and Rest of Europe), Asia Pacific (China, Japan, South Korea, India, Australia, and Rest of APAC), Latin America (Brazil, Mexico, and Rest of Latin America), Middle East and Africa (GCC, South Africa, and Rest of MEA) |
| Competitive Landscape | Grindstore Ltd, Society6, LLC, Redbubble, Poster Foundry, Meeple Design, Mason City Poster Company, Green Panda Printers Pvt. Ltd., GB Eye Limited, Game & Graphics, Fangamer LLC, Etsy, Displate, Art.com, Inc., AllPosters.com, AB Posters |
| Customization Scope | Customization for segments, region / country-level will be provided. Additional customization can be done based on requirements. |
| Purchase Options | We have three licenses to opt for: Single User License | Multi-User License (Up to 5 Users) | Corporate Use License (Unlimited User and Printable PDF) |





































