
Quick Navigation
Report Overview
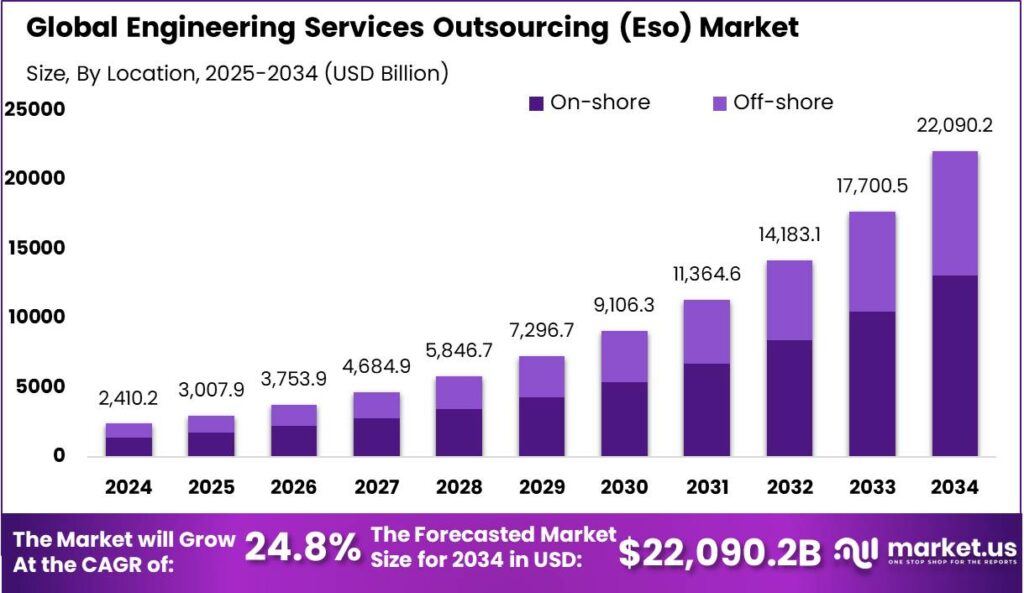
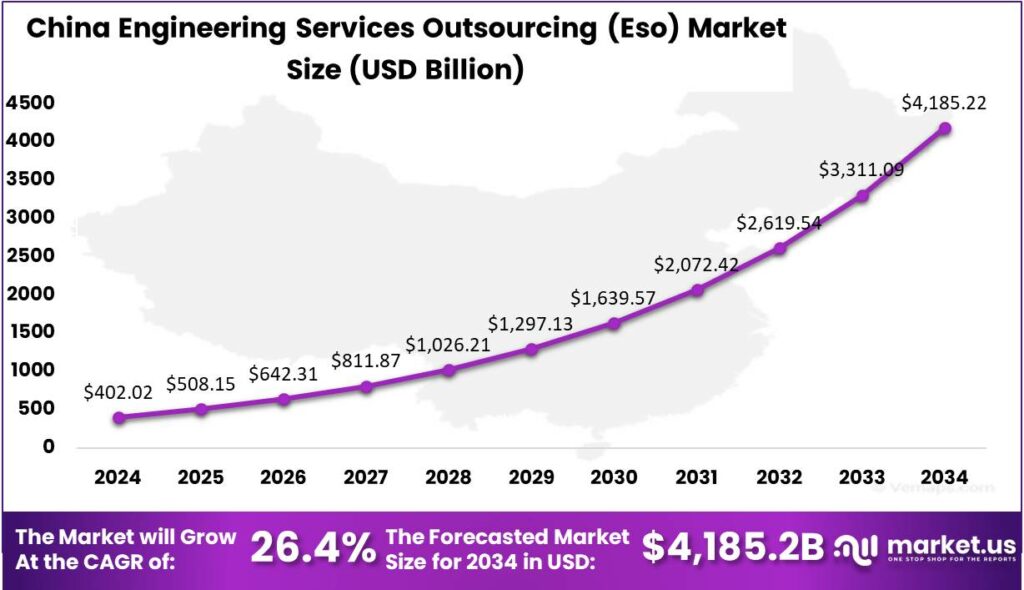
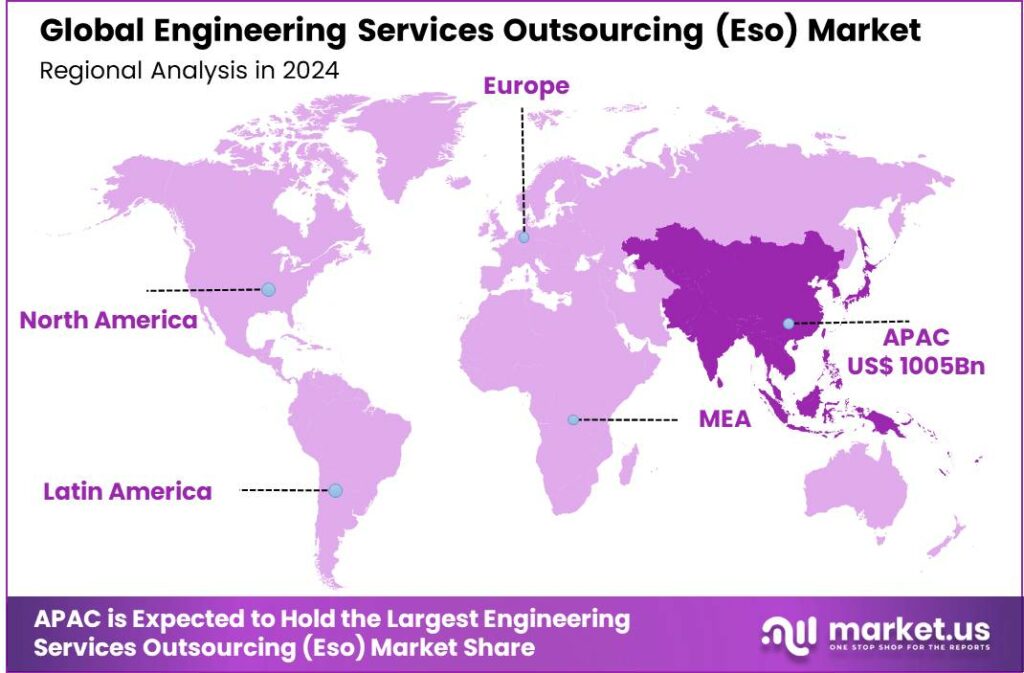
The Engineering Services Outsourcing (ESO) Market size is expected to be worth around USD 22,090.2 Bn By 2034, from USD 2410.2 Bn in 2024, growing at a CAGR of 24.8% during the forecast period from 2025 to 2034. In 2024, the Asia-Pacific region dominated the market, capturing over 41.7% of the share with revenues of approximately USD 1,005 billion. The ESO market in China was valued at USD 402.02 billion and is projected to grow at a CAGR of 26.4%.
Engineering Services Outsourcing (ESO) refers to the practice of contracting various engineering tasks, such as design, prototyping, testing, and other technical services, to external parties. ESO services are outsourced to cut costs, access specialized expertise, and increase flexibility. Companies target vendors in countries with lower labor costs and advanced skills to optimize operations and focus on core competencies.
The growth of the ESO market is driven by key factors such as the global focus on cost reduction and operational efficiency, prompting companies to outsource engineering tasks. Rapid technological advancements and the integration of AI and IoT have expanded ESO services, requiring specialized skills often accessible through outsourcing. Additionally, a global talent pool fosters innovation and enhances product offerings.
The demand for ESO is also driven by the need for advanced engineering competencies across various sectors. Companies are seeking to accelerate their product development cycles and enhance innovation by accessing global talent pools. The integration of emerging technologies such as AI and IoT in engineering projects further fuels this demand, as companies require specialized skills to incorporate these technologies effectively.
Outsourcing engineering services provides key business benefits, including cost management by reducing the need for large in-house teams. It offers flexibility to scale operations based on project needs, which is ideal for industries with variable demand. Access to a global talent pool also boosts innovation, improving engineering solutions and enhancing competitive advantage.
The ESO market presents significant opportunities through technology integration and expansion into emerging markets. As industries digitally transform, demand for ESO providers with advanced tech expertise will grow. Tapping into regions like Eastern Europe and Southeast Asia, known for their skilled and cost-effective workforce, offers further growth potential.
Market expansion strategies for ESO include forming strategic alliances and partnerships with local firms in target regions to facilitate smoother entry and operational integration. Developing tailored solutions for various industries can attract a wider client base. Continuous learning and adaptation to technological advancements will keep services relevant and competitive.
Key Takeaways
- The Global Engineering Services Outsourcing (ESO) Market size is expected to reach USD 22,090.2 Billion by 2034, up from USD 2410.2 Billion in 2024, growing at a CAGR of 24.80% during the forecast period from 2025 to 2034.
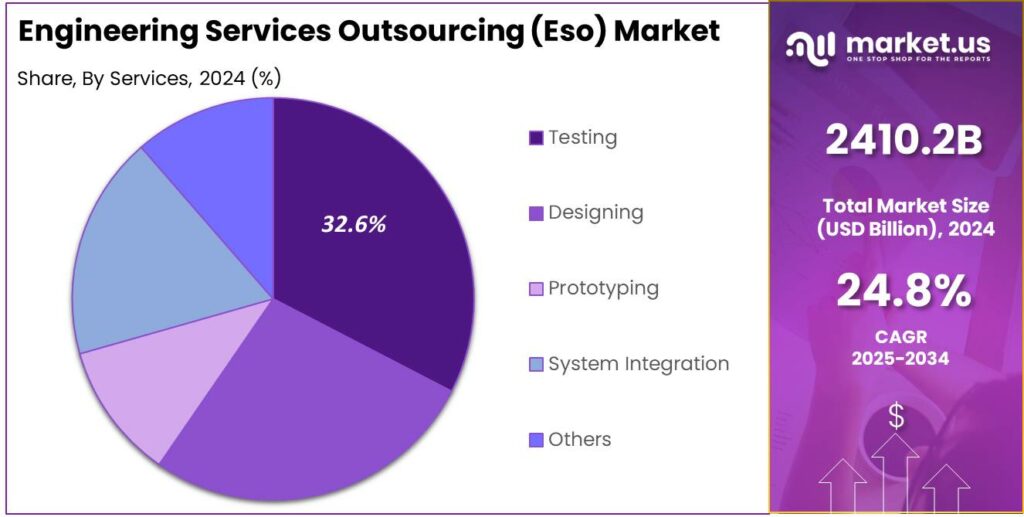
- In 2024, the Testing segment held a dominant position in the Engineering Services Outsourcing (ESO) market, capturing more than 32.6% of the market share.
- In 2024, the on-shore segment held a dominant position in the Engineering Services Outsourcing market, capturing over 59.3% of the share.
- In 2024, the Manufacturing segment also held a dominant position in the Engineering Services Outsourcing (ESO) market, accounting for more than 28.5% of the market share.
- In 2024, the Asia-Pacific region held a dominant position in the Engineering Services Outsourcing (ESO) market, capturing more than 41.7% of the share, with revenues amounting to approximately USD 1005 billion.
- The market for Engineering Services Outsourcing (ESO) in China was valued at USD 402.02 billion in 2024 and is projected to expand at a CAGR of 26.4%.
Business Benefits
Outsourcing engineering services provides significant advantages, such as cost reduction. Reducing or controlling costs stands as one of the key motivations for businesses to outsource engineering services. Deloitte’s Global Outsourcing Survey reveals that a significant 83% of companies turn to outsourcing with the goal of driving cost efficiencies.
Outsourcing can lead to savings of up to 60% on labor costs, particularly when partnering with service providers in countries where wages are lower. This cost advantage makes outsourcing a strategic choice for many companies.
Access to specialized skills and advanced technologies is another critical advantage. Outsourcing enables firms to tap into a global talent pool with expertise that may not be available internally. Engineering service providers often invest in the latest tools and technologies, offering clients innovative solutions without the need for significant capital investment.
Outsourcing provides scalability and flexibility, allowing companies to adjust services based on project needs and optimize resource use without the burden of a large in-house team. According to an IDC study, outsourcing engineering services can slash project completion times by 30-50%. This time-saving advantage is especially crucial for businesses under tight deadlines or those eager to speed up the time-to-market for their new products.
China Market Growth
The market for Engineering Services Outsourcing (ESO) in China was valued at USD 402.02 billion in the year 2024. It is projected to expand at a compound annual growth rate (CAGR) of 26.4%. The significant growth of the Chinese ESO market is primarily driven by key factors, including the growing demand for cost efficiency and quicker time-to-market in industries like automotive, aerospace, and electronics.
Outsourcing engineering services allows companies to lower operational costs and concentrate on their core competencies, strengthening their competitive position. Advancements in AI, IoT, and cloud computing are significantly influencing the ESO market by streamlining project management, design, and development.
Supportive Chinese government policies on foreign direct investment and the establishment of engineering centers have created a favorable environment for the ESO market. These regulations, combined with China’s large pool of engineering talent, attract multinational companies seeking outsourcing solutions, further driving market growth.
In 2024, Asia-Pacific held a dominant position in the Engineering Services Outsourcing (ESO) market, capturing more than a 41.7% share with revenues amounting to approximately USD 1005 billion. This region’s leadership in the ESO market can be attributed to several compelling factors that uniquely position it at the forefront of the industry.
Asia-Pacific benefits from a strong industrial base, especially in China, India, and South Korea, with a high concentration of manufacturing and high-tech industries. These sectors require specialized engineering services such as product design, automation, and software engineering, driving demand for outsourced services to enhance efficiency and reduce costs.
Asia-Pacific’s vast pool of skilled engineers, with many graduates from top institutions, offers a cost-effective alternative to Western labor. This, combined with growing technological capabilities, makes the region an attractive outsourcing hub for multinational corporations seeking high-quality, affordable engineering solutions.
Furthermore, governments across the region have implemented favorable policies aimed at boosting technology adoption and digital transformation. Initiatives that promote the development of smart cities, renewable energy projects, and infrastructure upgrades require extensive engineering expertise, further fueling the growth of the ESO market in Asia-Pacific.
Services Analysis
In 2024, the Testing segment held a dominant position in the Engineering Services Outsourcing (ESO) market, capturing more than a 32.6% share. This segment’s leadership is primarily attributed to the critical role of testing in ensuring product safety, compliance with international standards, and market readiness.
The prominence of the Testing segment is strengthened by the integration of advanced technologies like automation and AI, which improve both efficiency and accuracy. These technologies make testing services more attractive to companies outsourcing, as automation speeds up the process, reduces human error, and ensures reliable results, boosting the segment’s market share.
Stricter regulatory requirements across industries are driving companies to invest in testing services to ensure compliance. From environmental standards in automotive to safety protocols in aerospace, these regulations necessitate thorough testing, fueling the growth of the Testing segment.
The rise of digital transformation across industries has increased product and system complexity, requiring advanced testing services to evaluate performance and security. This growing need for specialized testing services strengthens the dominant market share of the Testing segment in the ESO market.
Location Analysis
In 2024, the on-shore segment held a dominant position in the Engineering Services Outsourcing market, capturing more than a 59.3% share. This segment’s leadership can be attributed to several key factors that align with the operational and strategic preferences of many businesses.
The preference for on-shore outsourcing is largely driven by the desire for closer collaboration and alignment with external engineering teams. Companies opting for on-shore partners benefit from similar regulatory environments and fewer cultural and language barriers, which often translates into smoother project management and execution.
On-shore outsourcing is preferred for its ability to ensure strict adherence to local regulations and standards. Industries like aerospace, automotive, and healthcare, where compliance and quality are crucial, favor on-shore partnerships to minimize risks and ensure all engineering activities meet stringent regulatory requirements.
Furthermore, the on-shore model supports a higher level of intellectual property security. Businesses are increasingly vigilant about protecting their proprietary information and see on-shore outsourcing as a safer option. The legal protections available within the same country often provide a stronger safeguard against IP theft compared to off-shore alternatives.
Application Analysis
In 2024, the Manufacturing segment held a dominant position in the Engineering Services Outsourcing (ESO) market, capturing more than a 28.5% share. This leadership is largely due to the increasing adoption of automation and digital technologies in manufacturing processes which demand sophisticated engineering expertise to develop, integrate, and maintain.
The push towards Industry 4.0 technologies is a significant driver behind the growth of the manufacturing segment in the ESO market. As manufacturers globally strive to enhance efficiency and productivity, there is a growing reliance on outsourcing engineering tasks related to the integration of robotics, artificial intelligence, and the Internet of Things (IoT).
Furthermore, the need for sustainable and environmentally friendly manufacturing processes has propelled the demand for advanced engineering solutions. Outsourced engineering service providers are increasingly engaged to design and implement energy-efficient systems and optimize waste management, which are critical in complying with global environmental standards and regulations.
Additionally, the globalization of the manufacturing industry has led to a greater need for standardized production processes across various locations. Outsourcing engineering tasks allows companies to maintain consistency in quality and compliance with international standards, which is crucial for multinational operations.
Key Market Segments
By Services
- Designing
- Prototyping
- System Integration
- Testing
- Others
By Location
- On-shore
- Off-shore
By Application
- Aerospace
- Automotive
- Manufacturing
- Consumer Electronics
- Semiconductors
- Healthcare
- Telecom
- Energy & Utilities
- Construction & Infrastructure
- Others
Key Regions and Countries
- North America
- US
- Canada
- Europe
- Germany
- France
- The UK
- Spain
- Italy
- Rest of Europe
- Asia Pacific
- China
- Japan
- South Korea
- India
- Australia
- Singapore
- Rest of Asia Pacific
- Latin America
- Brazil
- Mexico
- Rest of Latin America
- Middle East & Africa
- South Africa
- Saudi Arabia
- UAE
- Rest of MEA
Driver
Access to Specialized Talent
The Engineering Services Outsourcing (ESO) market is significantly driven by the pursuit of specialized talent. Companies are increasingly seeking expertise that may not be readily available within their internal teams.
By outsourcing engineering services, organizations gain access to a global talent pool, enabling them to leverage advanced skills and innovative solutions. This approach not only enhances the quality of engineering projects but also accelerates time-to-market, providing a competitive edge in rapidly evolving industries.
Moreover, outsourcing allows firms to focus on their core competencies while entrusting specialized tasks to external experts, leading to improved operational efficiency. This strategic move is particularly beneficial in sectors where technological advancements occur swiftly, necessitating continuous adaptation and expertise.
Restraint
Intellectual Property Concerns
Despite its advantages, ESO faces challenges related to intellectual property (IP) security. Outsourcing engineering tasks often involves sharing sensitive data and proprietary information with external vendors. This exposure raises concerns about potential IP theft or misuse, which can have detrimental effects on a company’s competitive position.
Ensuring robust confidentiality agreements and implementing stringent data protection measures are essential to mitigate these risks. However, the complexity of international laws and varying enforcement standards across countries can complicate IP protection efforts.
Companies must conduct thorough due diligence when selecting outsourcing partners and establish clear protocols to safeguard their intellectual assets. The risk of losing confidential information remains a significant barrier to the broader adoption of engineering services outsourcing.
Opportunity
Adoption of Digital Technologies
The integration of digital technologies presents a substantial opportunity within the ESO market. The rise of automation and digital solutions has enabled companies to streamline operations and reduce costs. By outsourcing engineering services, organizations can leverage the latest technological advancements without the need for significant in-house investment.
This approach allows firms to stay at the forefront of innovation, adapting swiftly to market changes and consumer demands. Outsourcing partners often possess specialized knowledge in implementing and managing digital tools, facilitating a smoother transition and effective utilization of these technologies.
Embracing digital transformation through outsourcing can lead to enhanced product development, improved service delivery, and the creation of new business models, thereby driving growth and competitiveness in the market.
Challenge
Communication Barriers
Effective communication is a critical challenge in the ESO landscape. Collaborating with offshore teams often introduces obstacles such as time zone differences, language barriers, and cultural disparities. These factors can impede the seamless exchange of information, leading to misunderstandings, project delays, and compromised quality.
For instance, a study revealed that a significant percentage of companies experienced communication issues when outsourcing engineering tasks, highlighting the prevalence of this challenge. To address these issues, organizations must invest in robust communication strategies, including regular meetings, clear documentation, and the use of collaborative tools.
Emerging Trends
A prominent trend is the adoption of digital transformation initiatives. Companies are increasingly adopting emerging technologies like AI, machine learning, and IoT to improve product development and operational efficiency. This shift helps organizations stay competitive in a fast-evolving market.
Another notable development is the emergence of Global Capability Centers (GCCs). Multinational corporations are setting up GCCs to develop in-house capabilities across functions like engineering. These centers act as strategic hubs, providing essential services such as technology development and business operations, which reduces dependence on third-party vendors.
Additionally, there is a growing emphasis on sustainability within the ESO market. Companies are prioritizing eco-friendly practices and choosing outsourcing partners who comply with environmental regulations and standards. This focus helps ensure regulatory compliance, boosts corporate reputation, and meets growing consumer demand for sustainable products.
Key Player Analysis
Several major players dominate the ESO industry, offering innovative and high-quality services.
Capgemini Engineering is a global leader in engineering and R&D services. The company blends its technological expertise with a solid engineering foundation to offer end-to-end services across industries like automotive, aerospace, energy, and telecommunications. Capgemini’s strength lies in delivering innovative solutions by leveraging digital technologies such as AI, automation, and IoT.
Wipro Limited is one of the largest players in the engineering services outsourcing space. The company offers a wide range of services, including product engineering, design and development, and lifecycle management. Wipro is known for delivering high-quality, scalable, and customized solutions in industries like automotive, healthcare, and industrial equipment.
AKKA Technologies, now rebranded as Akkodis, is a key player in the global ESO market with a strong focus on advanced engineering solutions. Akkodis specializes in industries like aerospace, automotive, and digital transformation, offering services in product design, development, and testing.
Top Key Players in the Market
- Capgemini Engineering
- Wipro Limited
- AKKA Technologies (Akkodis)
- Alten Group
- HCL Technologies Limited
- Tech Mahindra Limited
- Entelect
- Infosys Limited
- Tata Elxsi
- Tata Consultancy Services Limited
- Emerson Electric Co
- Other Major Players
Top Opportunities for Players
In the dynamic landscape of Engineering Services Outsourcing (ESO), several opportunities are emerging that market players can capitalize on to enhance their growth and competitive advantage.
- Digital Transformation and Industry 4.0: The ESO market is witnessing a significant shift towards digital transformation, including the integration of Industry 4.0 technologies such as IoT, automation, and smart manufacturing. Companies that leverage these technologies can offer more advanced engineering solutions, which are in growing demand across various industries.
- Expansion in Aerospace and Automotive Sectors: The aerospace and automotive industries are increasingly relying on ESO for complex engineering tasks such as aircraft design, avionics, electric vehicle development, and autonomous driving technologies. This trend is driven by the need for rapid innovation and adherence to stringent safety standards.
- Healthcare and Pharmaceutical Innovations: There is a growing opportunity for ESO in the healthcare and pharmaceutical sectors, particularly in drug development, regulatory compliance, and process engineering. Outsourcing these functions can significantly reduce research time and cost, thereby accelerating the time to market for new treatments.
- Adoption of Sustainable and Environmentally Friendly Practices: With a global push towards sustainability, ESO providers are increasingly expected to incorporate environmentally friendly practices and solutions. This includes everything from sustainable manufacturing processes to the development of green technologies, providing a competitive edge to firms that can meet these emerging client demands.
- Geographical Expansion into High-Growth Markets: The Asia-Pacific region, in particular, represents a substantial opportunity due to its rapid technological advancements and the availability of skilled engineering professionals. Companies expanding in this region can benefit from lower costs and access to a large talent pool, essential for scaling operations and improving service offerings.
Recent Developments
- In February 2024, MGS launched its Global Engineering Services Group, uniting over 200 toolmakers and 85 engineers worldwide. This move boosts engineering capabilities and global production for healthcare innovators, complementing recent acquisitions aimed at expanding MGS’ front-end engineering and manufacturing reach in North America and Europe.
- In March 2024, Tata Consultancy Services (TCS) has teamed up with Denmark’s Ramboll, a global architecture and engineering consultancy ,in a multimillion-dollar, seven-year deal to transform its IT infrastructure. This partnership will modernize Ramboll’s IT model, driving business growth, reducing costs, and minimizing its carbon footprint.
Report Scope
| Report Features | Description |
|---|---|
| Market Value (2024) | USD 2410.2 Bn |
| Forecast Revenue (2034) | USD 22,090.2 Bn |
| CAGR (2025-2034) | 24.80% |
| Base Year for Estimation | 2024 |
| Historic Period | 2020-2023 |
| Forecast Period | 2025-2034 |
| Report Coverage | Revenue forecast, AI impact on market trends, Share Insights, Company ranking, competitive landscape, Recent Developments, Market Dynamics and Emerging Trends |
| Segments Covered | By Services (Designing, Prototyping, System Integration, Testing, Others), By Location (On-shore, Off-shore), By Application (Aerospace, Automotive, Manufacturing, Consumer Electronics, Semiconductors, Healthcare, Telecom, Energy & Utilities, Construction & Infrastructure, Others) |
| Regional Analysis | North America – US, Canada; Europe – Germany, France, The UK, Spain, Italy, Russia, Netherlands, Rest of Europe; Asia Pacific – China, Japan, South Korea, India, New Zealand, Singapore, Thailand, Vietnam, Rest of APAC; Latin America – Brazil, Mexico, Rest of Latin America; Middle East & Africa – South Africa, Saudi Arabia, UAE, Rest of MEA |
| Competitive Landscape | Capgemini Engineering, Wipro Limited, AKKA Technologies (Akkodis), Alten Group, HCL Technologies Limited, Tech Mahindra Limited, Entelect, Infosys Limited, Tata Elxsi, Tata Consultancy Services Limited, Emerson Electric Co, Other Major Players |
| Customization Scope | Customization for segments, region/country-level will be provided. Moreover, additional customization can be done based on the requirements. |
| Purchase Options | We have three license to opt for: Single User License, Multi-User License (Up to 5 Users), Corporate Use License (Unlimited User and Printable PDF) |
 Market")


