
Quick Navigation
Report Overview
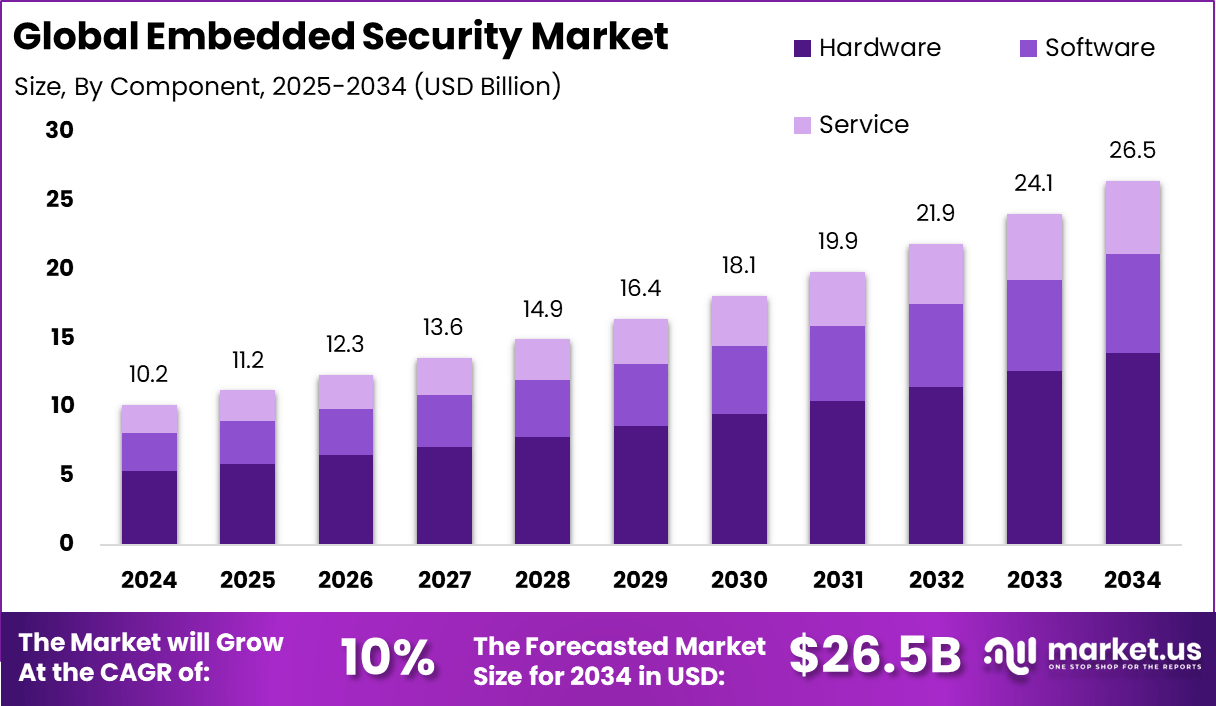
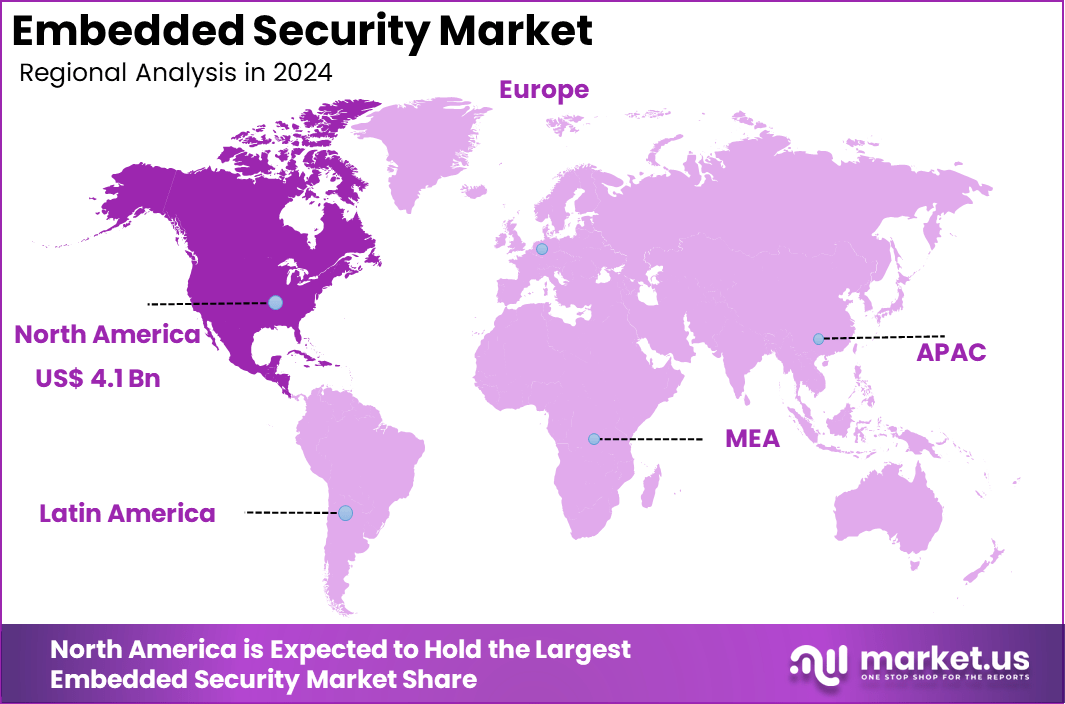
The Global Embedded Security Market size is expected to be worth around USD 26.5 Billion By 2034, from USD 10.2 billion in 2024, growing at a CAGR of 10% during the forecast period from 2025 to 2034. In 2024, North America held a dominant market position, capturing more than a 40.2% share, holding USD 4.1 Billion revenue.
Embedded security refers to the deployment of security mechanisms within hardware devices to protect the software running on them from cyber threats. This security framework is typically integrated at the hardware level of various devices like smartphones, smart cards, and network systems. The primary purpose of embedded security is to safeguard critical data and ensure device integrity by mitigating risks of unauthorized access and data breaches.
The embedded security market is experiencing robust growth, driven primarily by the escalating deployment of IoT devices across various sectors such as automotive, healthcare, and consumer electronics. The market’s expansion is underpinned by the critical need to secure these connected devices against increasingly sophisticated cyber threats.
Demand for embedded security solutions is surging, primarily fueled by the proliferation of connected devices and the associated risks of cyber-attacks. Businesses and consumers alike seek technologies that can offer comprehensive protection against increasingly sophisticated threats.
A significant reason for increased demand is the rising incidence of cyber-attacks and data breaches, which jeopardize personal and corporate information. The embedded security serves as a fundamental component in thwarting these threats by securing devices at the hardware level.
Currently, the market is trending towards the integration of AI and machine learning technologies into embedded security systems. These innovations enhance the ability to detect and respond to threats in real-time, significantly improving security efficiency.
As per the report from Market.us, The Embedded Systems Market is projected to reach approximately USD 173 billion by 2032, rising from an estimated USD 103 billion in 2024. This growth is expected to occur at a steady compound annual growth rate (CAGR) of 6.8% during the forecast period from 2023 to 2032.
Technologies such as blockchain and biometrics are being increasingly adopted within the embedded security domain. These technologies offer enhanced security features, such as decentralized operations and unique identity verification, which are crucial for preventing fraud and unauthorized access.
The key reasons for adopting these technologies include their ability to provide superior security measures that are hard to bypass. They offer a robust defense mechanism against a variety of cyber threats, making them indispensable in modern security architecture.
Key Takeaways
- The Global Embedded Security Market is projected to grow from USD 10.2 billion in 2024 to around USD 26.5 billion by 2034, at a CAGR of 10% during 2025-2034.
- In 2024, North America dominated the global market, capturing over 40.2% share, with a revenue of about USD 4.1 billion.
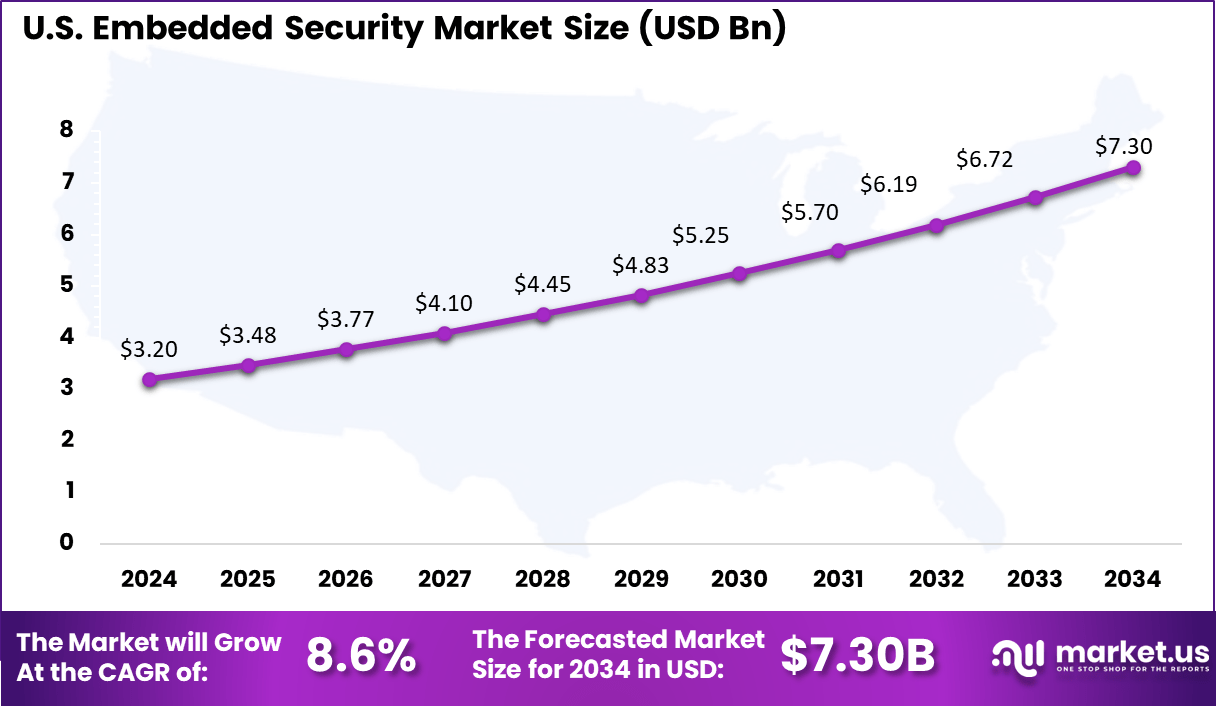
- The US Embedded Security Market was valued at approximately USD 3.2 billion in 2024 and is forecasted to reach nearly USD 7.3 billion by 2034, growing at a CAGR of 8.6%.
- In 2024, the hardware segment held a leading position in the embedded security market, accounting for more than 52.6% of the total share.
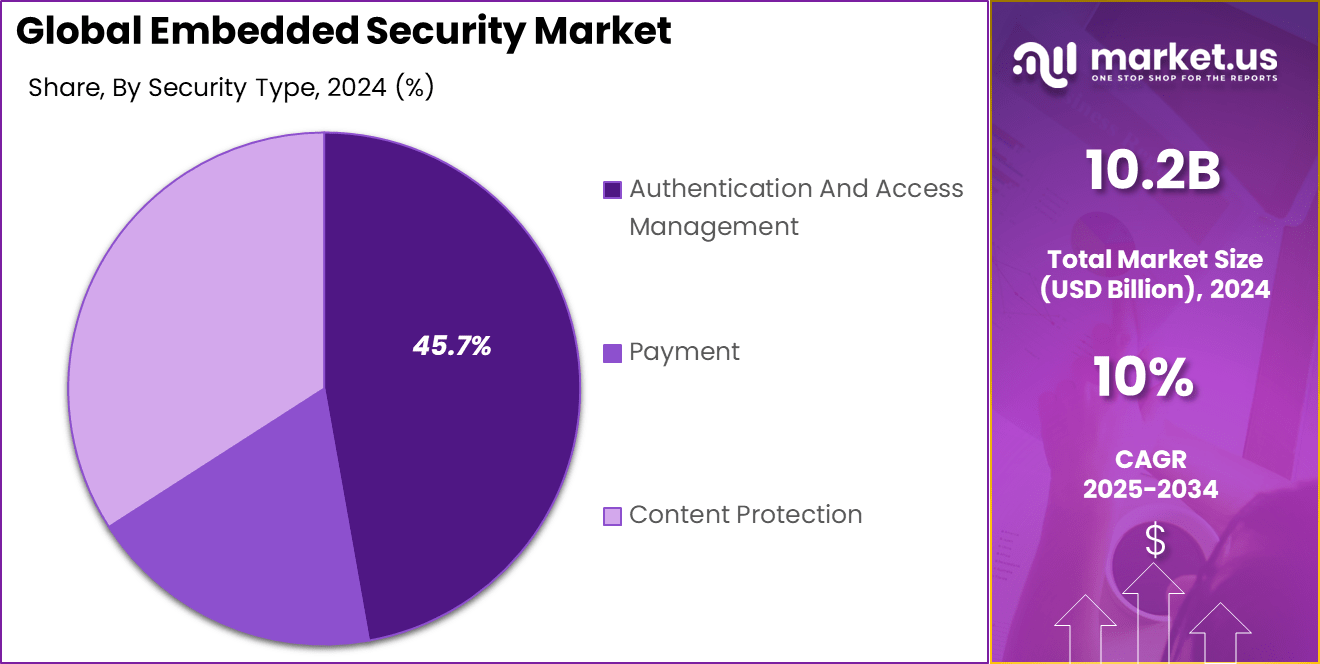
- The Authentication and Access Management segment dominated by securing over 45.7% share of the embedded security market in 2024.
- The automotive sector emerged as the largest end-user, commanding over 30.4% share of the embedded security market in 2024.
Analysts’ Viewpoint
The embedded security market presents substantial investment opportunities, particularly in developing and deploying security solutions for automotive and industrial applications. Investors are particularly interested in companies that innovate in encryption algorithms and secure communication protocols.
Implementing embedded security systems offers businesses critical benefits such as compliance with regulatory requirements, protection against data theft, and maintaining consumer trust. These advantages contribute significantly to sustaining business continuity and reputation.
The regulatory landscape for embedded security is evolving, with more stringent standards being implemented to ensure data protection and privacy. Regulations such as GDPR in Europe and CCPA in California have set benchmarks for security practices, pushing companies to adopt higher security standards.
US Market Growth
The US Embedded Security Market is valued at approximately USD 3.2 Billion in 2024 and is predicted to increase from USD 3.48 Billion in 2025 to approximately USD 7.3 Billion by 2034, projected at a CAGR of 8.6% from 2025 to 2034.
In 2024, North America held a dominant market position in the embedded security market, capturing more than a 40.2% share with revenues amounting to USD 4.1 Billion. This leadership can be primarily attributed to the robust technological infrastructure and the high concentration of leading technology companies in the region, particularly in the United States and Canada.
These companies actively integrate advanced security features into various consumer electronics, automotive products, and network appliances, which has significantly driven demand for embedded security solutions.
Additionally, North America benefits from stringent regulatory standards that mandate enhanced data protection across digital and physical platforms. Initiatives like the Cybersecurity Maturity Model Certification (CMMC) and the California Consumer Privacy Act (CCPA) have compelled organizations to adopt embedded security measures extensively.
Component Analysis
In 2024, the hardware segment of the embedded security market held a dominant market position, capturing more than a 52.6% share. This prominence can be attributed to the critical role that hardware components like Embedded SIMs, secure elements, trusted platform modules, hardware tokens, and hardware security modules play in the foundational security structures of embedded systems.
These components are integral in protecting against the rising tide of cyberattacks targeted at connected systems which are increasingly prevalent across various industries including automotive, healthcare, and industrial automation. The substantial market share of the hardware segment also stems from the complexity and higher costs associated with developing these robust security solutions compared to their software counterparts.
Hardware-based security solutions are deemed essential for high-security applications where prevention of physical tampering and secure storage of cryptographic keys are necessary. As the number and sophistication of cyber threats continue to escalate, especially with the expanding Internet of Things (IoT) landscape, the demand for durable and reliable security hardware is expected to grow, underscoring its significant market share.
Moreover, the strategic importance of hardware in embedded security is reinforced by its role in critical infrastructure and sensitive applications, where failure or breach could lead to severe consequences. This importance is magnified in sectors such as automotive and healthcare, where safety and data integrity are paramount. This drives ongoing innovation and investment in the hardware segment, ensuring its continued dominance in the embedded security market.
Security Type Analysis
In 2024, the Authentication and Access Management segment of the embedded security market held a dominant position, capturing more than a 45.7% market share. This segment’s leadership is primarily due to its crucial role in securing access to devices and data across various industries, from automotive to healthcare and beyond.
The growing complexity of cyber threats has significantly heightened the need for robust authentication and access management systems that not only prevent unauthorized access but also ensure the integrity and confidentiality of sensitive information. The importance of this segment is further underscored by the rapid expansion of digital and cloud technologies, which have increased the points of vulnerability that can be exploited by cyber attackers.
Modern businesses and IoT ecosystems rely heavily on secure access management to protect against breaches that could lead to substantial financial losses and damage to reputation. Additionally, regulatory pressures and compliance requirements across different regions mandate strong authentication measures, driving the adoption of advanced security solutions in this segment.
Moreover, innovations in biometric technologies and multi-factor authentication (MFA) strategies are being integrated within this sector to enhance security protocols, making it a continually evolving field that responds dynamically to emerging security challenges and technological advancements.
The sustained emphasis on improving security protocols to guard against the continuously evolving cyber threats underscores the enduring prominence and vital role of the Authentication and Access Management segment.
End Use Analysis
In 2024, the automotive segment of the embedded security market held a commanding position, capturing more than a 30.4% share. This dominance is largely driven by the increasing integration of advanced digital technologies within vehicles, including connectivity features and autonomous driving capabilities, which significantly heighten the need for robust security measures.
The surge in electric and connected vehicles has escalated the importance of cybersecurity within the automotive industry. As vehicles become more connected, the risk of cyber threats also increases, necessitating sophisticated security solutions to protect against data breaches, unauthorized access, and other cyber risks.
This trend is further amplified by stringent regulatory requirements that demand high levels of security to ensure both driver and vehicle safety. Moreover, the automotive industry’s focus on enhancing user experience through advanced infotainment systems and telematics has also contributed to the growth of embedded security.
These systems not only provide entertainment and navigation services but also handle sensitive user data, making security a critical requirement. The continuous evolution of vehicle technology and the industry’s shift towards more automated and connected functionalities underscore the growing significance of embedded security in safeguarding the modern automotive ecosystem.
Key Market Segments
By Component
- Hardware
- Secure Element
- Embedded SIM
- Trusted Platform Modules
- Hardware Security Modules
- Hardware Token
- Software
- Service
By Security Type
- Authentication And Access Management
- Payment
- Content Protection
By End Use
- Automotive
- Healthcare
- Consumer Electronics
- Telecommunications
- Aerospace & defense
- Others
Key Regions and Countries
North America
- US
- Canada
Europe
- Germany
- France
- The UK
- Spain
- Italy
- Russia
- Netherlands
- Rest of Europe
Asia Pacific
- China
- Japan
- South Korea
- India
- Australia
- Singapore
- Thailand
- Vietnam
- Rest of APAC
Latin America
- Brazil
- Mexico
- Rest of Latin America
Middle East & Africa
- South Africa
- Saudi Arabia
- UAE
- Rest of MEA
Driver
Increasing Demand for IoT and Connected Device Security
The growth of the embedded security market is significantly driven by the escalating demand for Internet of Things (IoT) and connected devices across various sectors, including healthcare, automotive, and consumer electronics. As these devices become increasingly interconnected, the need for robust security solutions to safeguard sensitive data and ensure device integrity becomes critical.
For instance, in healthcare, the rapid expansion of medical wearable technologies necessitates strong, scalable, and affordable machine-to-machine authentication. This surge in IoT device deployment underscores the critical role of embedded security to protect against cyber threats, data breaches, and unauthorized access.
Restraint
High Costs and Complexity of Implementation
One of the primary restraints in the embedded security market is the high cost and complexity associated with the implementation of advanced security solutions. Integrating comprehensive security features into embedded systems often requires significant investment in both financial and technical resources, which can be a substantial barrier for small to medium-sized enterprises.
Opportunity
Expansion into Emerging Markets
The embedded security market presents substantial opportunities for expansion into emerging markets, particularly in regions like Asia Pacific, where there is a burgeoning growth in automotive and consumer electronics industries. Countries like India and China are rapidly advancing their IT infrastructure, which further amplifies the demand for embedded security solutions.
This regional growth is propelled by the increasing adoption of connected technologies and the need for secure communication channels, presenting lucrative opportunities for market players to introduce innovative security solutions tailored for these markets.
Challenge
Evolving Cyber Threat Landscape
A significant challenge in the embedded security market is the constantly evolving landscape of cyber threats, which requires continual updates and adaptations of security measures. As cyber attackers develop more sophisticated methods of exploiting vulnerabilities in embedded systems, maintaining the efficacy of security solutions becomes increasingly challenging.
This dynamic threat environment demands ongoing research and development efforts to enhance security features and address new vulnerabilities, thereby increasing the pressure on market participants to innovate and keep pace with advanced threat scenarios.
Growth Factors
The embedded security market is primarily driven by the increasing necessity for secure communication and data handling across a multitude of sectors, particularly with the rise of the Internet of Things (IoT) and connected devices.
The escalating threats of cyberattacks on critical infrastructure and the inherent vulnerabilities of digital systems necessitate robust security solutions embedded directly within devices. Regulatory pressures and compliance requirements further amplify the need for embedded security, making it integral to ensuring the integrity and confidentiality of sensitive data across industries.
Emerging Trends
One of the most significant trends in the embedded security market is the integration of advanced technologies such as artificial intelligence (AI) and machine learning (ML) within security solutions. These technologies enhance the capability of embedded security systems to predict, detect, and respond to potential threats in real-time.
Additionally, the shift towards cloud-based services has increased the demand for embedded security solutions that can provide end-to-end encryption and secure cloud connectivity. The market is also witnessing a surge in demand for security solutions in consumer electronics and automotive sectors, where the emphasis is on protecting personal data and preventing unauthorized access to connected vehicles.
Business Benefits
Implementing embedded security offers substantial benefits for businesses, including enhanced protection of intellectual property and sensitive corporate data, compliance with global data protection regulations, and safeguarding of customer information. These measures collectively boost consumer trust and enhance corporate reputation.
Furthermore, embedded security plays a critical role in enabling safe digital transactions, thus supporting e-commerce and the digital economy. For industries like healthcare and automotive, where safety and reliability are paramount, embedded security ensures the integrity of devices and systems that handle critical functions.
Key Player Analysis
Cadence Design Systems, Inc. recently announced its intent to acquire Secure-IC, a leading provider of embedded security IP. This acquisition is set to enhance Cadence’s existing portfolio with Secure-IC’s advanced security technologies, targeting a broad array of applications from consumer electronics to aerospace and defense.
Infineon Technologies AG has been actively expanding its embedded security solutions, focusing on securing connected devices across various sectors, thereby strengthening its market position through innovation and strategic partnerships.
STMicroelectronics has launched several new products aimed at improving embedded security in IoT devices, which underscores its commitment to advancing security features in response to growing threats in interconnected devices.
Top Key Players in the Market
- Idemia Group
- Infineon Technologies AG
- Intellias Ltd.
- Karamba Security Ltd.
- McAfee, LLC
- Microchip Technology Inc.
- NXP Semiconductors
- Qualcomm Technologies
- Rambus Incorporated
- Renesas Electronics
- RVL
- Samsung Electronics Co.,
- Sirin Software
- STMicroelectronics N.V.
- Texas Instruments Inc.
- Other Players
Recent Developments
- In July 2024, the adoption of digital car keys witnessed significant progress as NXP received certification from the Car Connectivity Consortium (CCC). This achievement validated the security and interoperability of NXP’s digital key solutions, making it easier and safer for consumers to unlock and start their vehicles using smartphones.
- Similarly, in March 2024, a partnership between IDEMIA Secure Transactions and Qualcomm was announced to strengthen secure offline Central Bank Digital Currency (CBDC) payments. By combining IDEMIA’s secure transaction technologies with Qualcomm’s advanced hardware, the collaboration aims to support the growing need for secure and efficient offline CBDC transactions.
Report Scope
| Report Features | Description |
|---|---|
| Market Value (2024) | USD 29.9 Bn |
| Forecast Revenue (2034) | USD 52.1 Bn |
| CAGR (2025-2034) | 5.7% |
| Base Year for Estimation | 2024 |
| Historic Period | 2020-2023 |
| Forecast Period | 2025-2034 |
| Report Coverage | Revenue forecast, AI impact on market trends, Share Insights, Company ranking, competitive landscape, Recent Developments, Market Dynamics and Emerging Trends |
| Segments Covered | By Type (Graphics, Audio, Other Types), By End-user Industry (Consumer Electronics, IT and Telecommunication, Media and Entertainment, Government, Other End-user Industries) |
| Regional Analysis | North America – US, Canada; Europe – Germany, France, The UK, Spain, Italy, Russia, Netherlands, Rest of Europe; Asia Pacific – China, Japan, South Korea, India, New Zealand, Singapore, Thailand, Vietnam, Rest of APAC; Latin America – Brazil, Mexico, Rest of Latin America; Middle East & Africa – South Africa, Saudi Arabia, UAE, Rest of MEA |
| Competitive Landscape | NVIDIA Corporation, Intel Corporation, Qualcomm Inc., Cirrus Logic Inc., Advanced Micro Devices Inc., DSP Group Inc., Apple Inc., Broadcom Corporation, Realtek Semiconductor Corporation, Marvell Technology Group Ltd, Samsung Group, MediaTek Inc., ST Microelectronics, Others |
| Customization Scope | Customization for segments, region/country-level will be provided. Moreover, additional customization can be done based on the requirements. |
| Purchase Options | We have three license to opt for: Single User License, Multi-User License (Up to 5 Users), Corporate Use License (Unlimited User and Printable PDF) |


