
Global Educational Gadgets Market By Product Type (Interactive Learning Tablets and Smart Devices, STEM Kits and Robotics (Coding toys, DIY kits), Smart Pens and Note-taking Devices), By End-User (Individual Consumers, Educational Institutions), By Distribution Channel (Online Retail,Offline Retail,Direct Sales to Institutions), By Technology (Screen-based Interactive, Hands-on and Construction-based,Others), By Regional Analysis, Global Trends and Opportunity, Future Outlook By 2025-2035
- Published date: Jan. 2026
- Report ID: 173392
- Number of Pages: 208
- Format:
-
keyboard_arrow_up
Quick Navigation
- Report Overview
- Top Market Takeaways
- Key Insights Summary
- Product Type Analysis
- End-User Analysis
- Distribution Channel Analysis
- Technology Analysis
- Key Reasons for Adoption
- Benefits
- Usage
- Key Trends and Drivers
- Types of Gadgets and Solutions
- Emerging Trends
- Growth Factors
- Key Market Segments
- Regional Analysis
- Competitive Analysis
- Future Outlook
- Recent Developments
- Report Scope
Report Overview
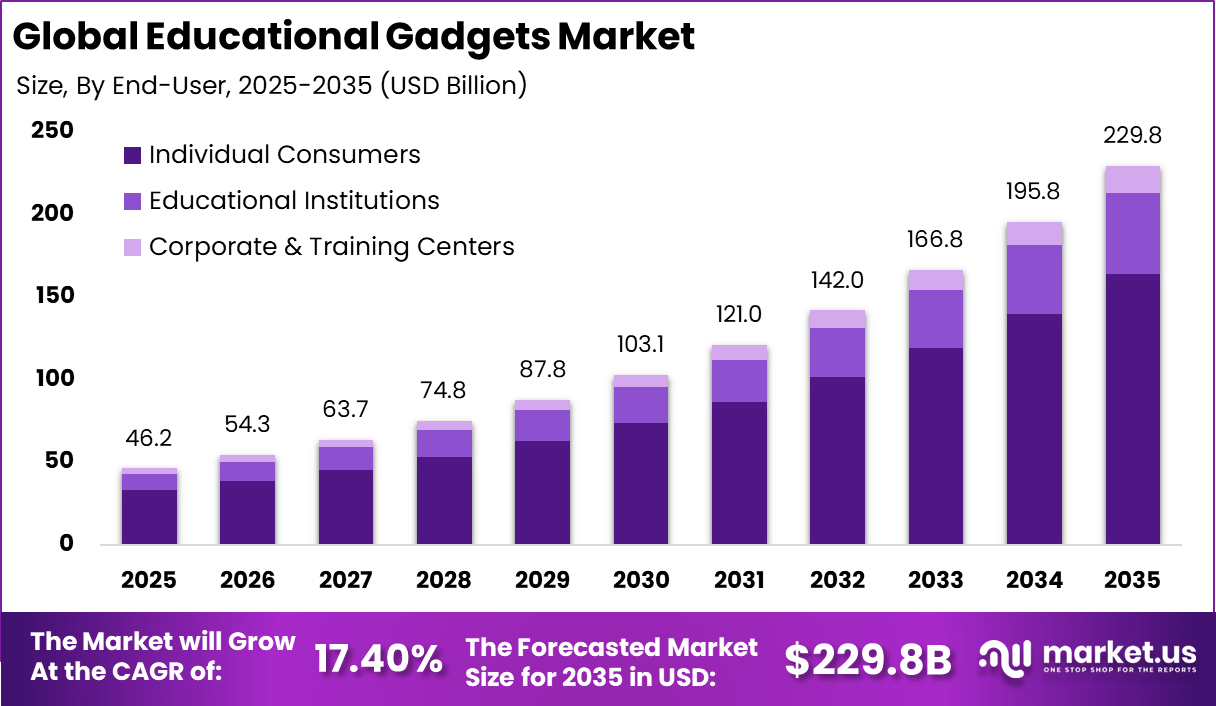
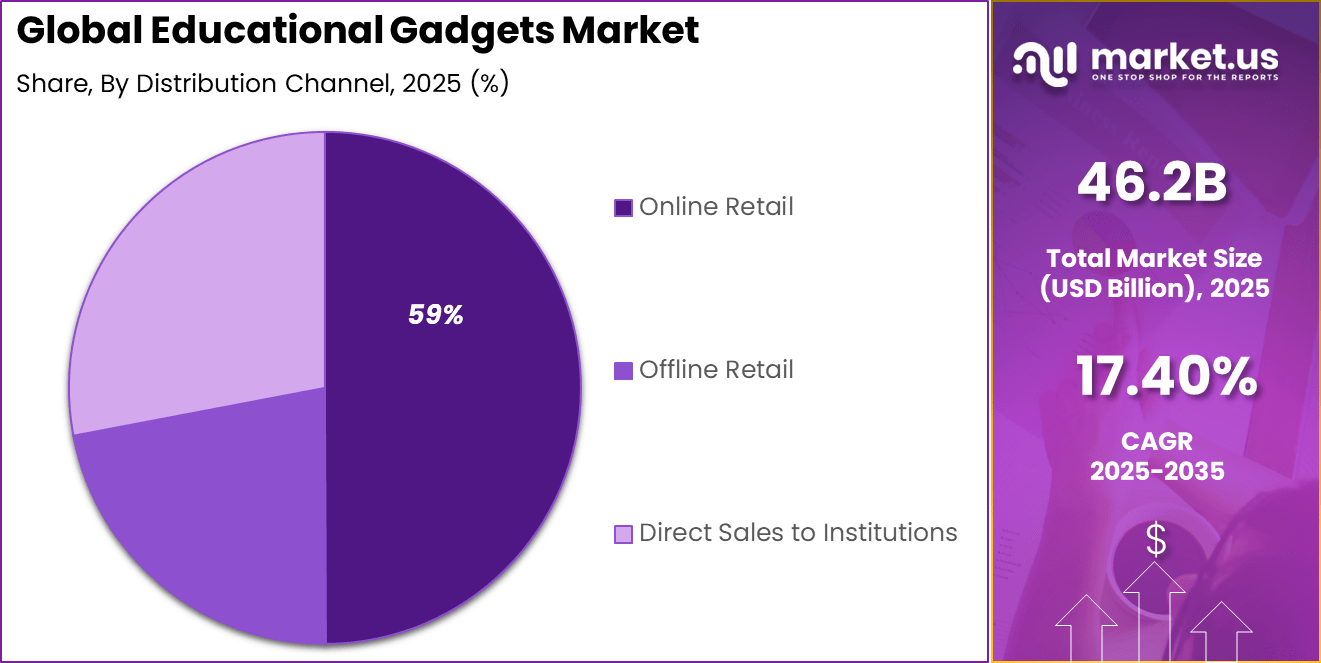
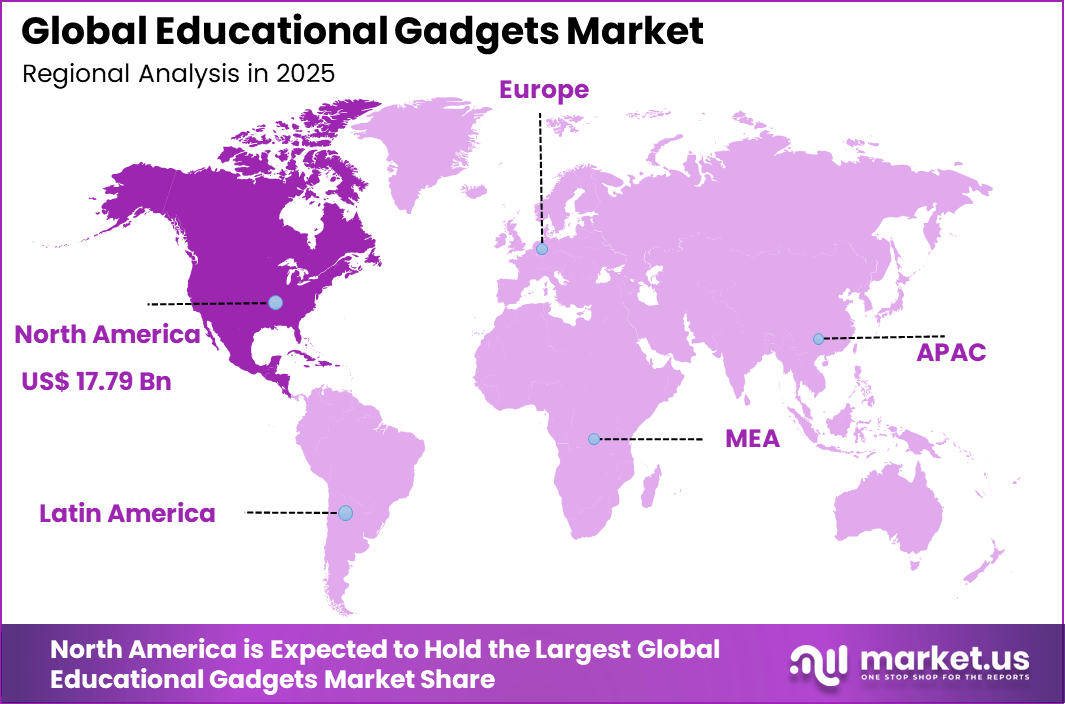
The Global Educational Gadgets Market generated USD 46.2 billion in 2025 and is predicted to register growth from USD 54.3 billion in 2026 to about USD 229.8 billion by 2035, recording a CAGR of 17.40% throughout the forecast span. In 2024, North America held a dominan market position, capturing more than a 38.5% share, holding USD 17.79 Billion revenue.
The educational gadgets market refers to electronic devices and smart tools designed to support learning, skill development, and classroom engagement across age groups. These gadgets include interactive tablets, smart pens, programmable robots, digital whiteboards, wearable learning aids, and augmented reality (AR) devices tailored for educational contexts.
Educational gadgets facilitate interactive and personalized learning both inside and outside traditional classrooms. Adoption spans schools, universities, training centers, and individual learners aiming to enhance outcomes through technology-enabled experiences. Market growth has been influenced by expanding digital literacy goals, curriculum modernization, and the need for engaging learning environments.
As educational institutions integrate technology into pedagogy, gadgets that support multimedia learning and hands-on experimentation have gained importance. These tools help bridge gaps between theoretical knowledge and practical application. As digital transformation progresses in education, demand for innovative learning hardware continues to strengthen.
One major driving factor of the educational gadgets market is the increasing focus on student engagement and experiential learning. Traditional instructional methods may not fully capture learners’ attention or accommodate diverse learning styles. Educational gadgets introduce interactivity, gamification, and immediate feedback that enhance motivation and retention. This improved engagement fosters deeper understanding and encourages lifelong learning habits.
Demand for educational gadgets is shaped by the rising prevalence of digital learning environments and remote education models. Learners increasingly access content through online courses, virtual labs, and blended learning platforms. Gadgets that support seamless transition between physical and digital learning contexts are valued for their flexibility and versatility. This broader learning ecosystem elevates demand for connected educational hardware.
Top Market Takeaways
- By product type, STEM kits and robotics took 34.8% of the educational gadgets market, engaging kids with hands-on science and coding projects.
- By end-user, individual consumers held 71.5% share, buying gadgets for home learning and hobbies.
- By distribution channel, online retail captured 58.9%, offering wide selection and fast delivery to parents.
- By technology, screen-based interactive led with 52.6%, combining tablets and apps for fun lessons.
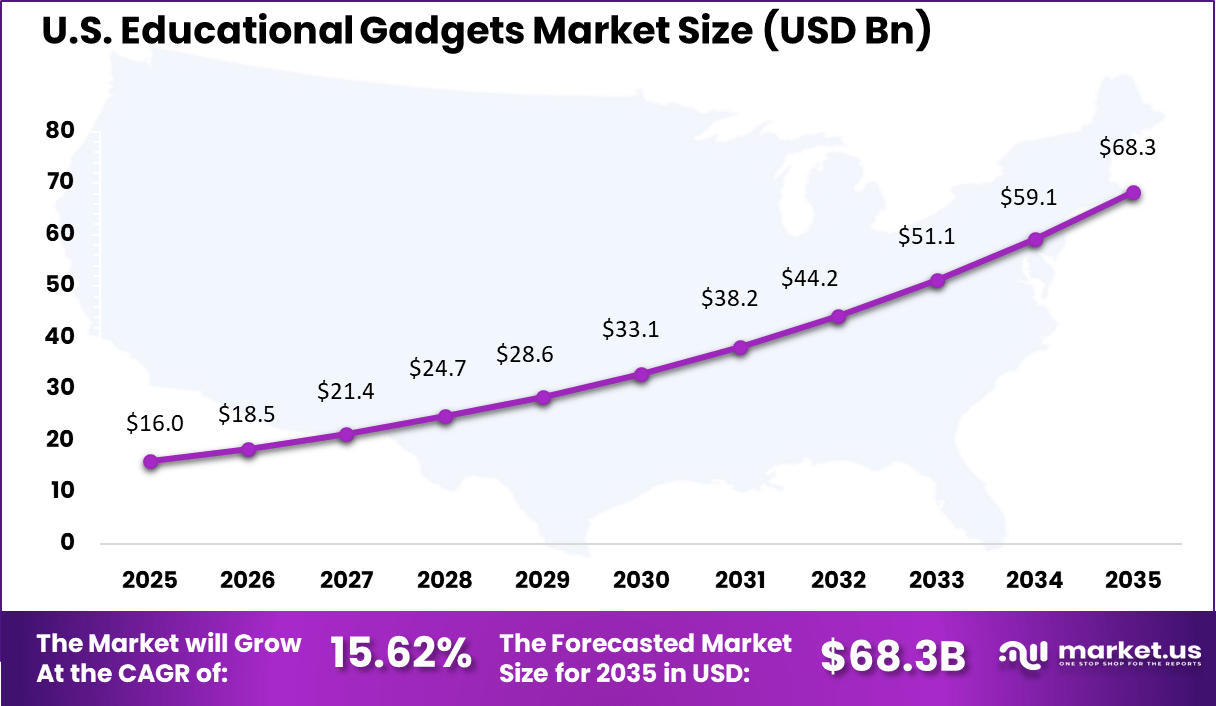
- North America had 38.5% of the global market, with the U.S. at USD 16.01 billion in 2025 and growing at a CAGR of 15.62%.
Key Insights Summary
EdTech Adoption and Usage Insights
- Universal device access has become standard in developed education systems, where one to one device programs are widely implemented in public schools. At a global level, 94% of Gen Z students use smartphones for educational purposes, making mobile devices central to modern learning.
- AI integration reached a mature stage by early 2026, as about 86% of students already used AI tools in their studies. At the same time, 60% of teachers integrated AI into regular teaching routines, indicating a shift from experimentation to daily classroom use.
- India showed strong regional growth, as digital education tool penetration increased from 25% in 2019 to over 70% in recent years. This expansion was supported by a large learner base of more than 10 million active students and rapid adoption of online learning platforms.
- School operating systems evolved toward unified platforms by 2026, replacing fragmented applications. These all in one systems reduced administrative workloads by up to 45%, improving operational efficiency for schools.
Usage Patterns and Learning Behavior
- Teacher usage frequency remained high, with 79% of K to 12 teachers using EdTech tools every day. This reflects deep integration of digital tools into lesson planning and delivery.
- Student usage was also consistent, as 89% of learners reported using digital learning tools in class at least a few days per week.
- Mobile learning became a core adoption driver, as global online learners increased from 150 million to 275 million. Mobile first learning was associated with a 45% higher retention rate compared with traditional methods.
- AR and VR tools gained traction, as virtual science labs reduced physical lab costs by up to 40%. In addition, VR based history and geography lessons improved knowledge retention by more than 75%.
Impact and Key Challenges
- Learner engagement improved significantly in schools using AI driven personalized learning paths, with reported engagement gains of 35%. Interactive digital content generated up to 10 times higher engagement than passive teaching formats.
- The smartphone distraction challenge persisted, as nearly 80% of teachers reported regular competition with phones and social media during classroom instruction.
- Policy responses expanded globally, with around 40% of school systems across 79 countries implementing phone restriction or ban policies by 2024 to 2025. These measures aimed to balance digital learning benefits with attention management in classrooms.
Product Type Analysis
STEM kits and robotics account for 34.8% of the Educational Gadgets market, reflecting strong interest in hands-on and experiential learning tools. These products combine science, technology, engineering, and mathematics concepts into practical activities that encourage problem-solving and creativity.
Learners use kits to build models, experiment with basic programming, and understand core technical principles through guided play. Their structured yet interactive nature makes them suitable for different age groups and learning levels.
From an educational value perspective, STEM kits and robotics help bridge the gap between theoretical knowledge and practical application. They support early exposure to technical skills and foster curiosity in emerging technologies. The strong share of this segment reflects growing emphasis on skill-based learning and early preparation for technology-driven careers.
End-User Analysis
Individual consumers represent 71.5% of the market, making them the largest end-user group for educational gadgets. Parents, students, and self-learners increasingly purchase these products for home-based learning and personal development. Educational gadgets provide flexible learning options that complement formal education systems.
This segment is driven by rising awareness of personalized learning and the importance of early skill development. Consumers value gadgets that offer convenience, engagement, and measurable learning outcomes. The strong presence of individual consumers highlights a shift toward self-directed and home-based educational investments.
Distribution Channel Analysis
Online retail accounts for 59% of the distribution channel segment, reflecting changing consumer purchasing behavior. Digital platforms offer wide product variety, detailed descriptions, and customer reviews, which support informed buying decisions. Online channels also provide convenience and home delivery, making them attractive to busy consumers.
For manufacturers, online retail enables direct engagement with customers and broader market reach. Promotions and digital marketing further support sales growth. The strong adoption of online retail reflects the increasing role of e-commerce in distributing educational products globally.
Technology Analysis
Screen-based interactive technology holds 52.6% of the market, driven by its ability to deliver engaging and dynamic learning experiences. These gadgets use displays, touch interfaces, and interactive content to explain concepts visually. Screen-based learning supports multimedia content such as videos, animations, and quizzes.
This technology helps maintain learner engagement and supports adaptive learning experiences. It also allows real-time feedback and progress tracking. The strong share of this segment reflects continued demand for interactive digital learning tools that align with modern learning preferences.
Key Reasons for Adoption
- Learning experiences are improved through interactive and visual tools that help students understand complex topics
- Teaching efficiency is enhanced by reducing dependence on traditional books and printed materials
- Digital literacy skills are supported at an early stage through regular use of smart learning devices
- Personalized learning is enabled by adaptive features that adjust content to student progress
- Remote and hybrid education needs are addressed through connected and portable learning tools
Benefits
- Student engagement levels are increased through hands-on and interactive learning methods
- Concept retention is improved with visual demonstrations and real-time feedback
- Teacher workload is reduced through automated assessments and content delivery
- Learning access is expanded for students in remote or underserved regions
- Collaboration among students is encouraged through shared digital platforms
Usage
- Used in classrooms to support subjects such as science, mathematics, and language learning
- Adopted in early education to build foundational cognitive and motor skills
- Applied in special education to support diverse learning needs
- Utilized in after-school programs and tutoring centers for skill reinforcement
- Integrated into home learning environments for continuous practice and revision
Key Trends and Drivers
- Personalized learning: AI and data tools adjust lessons to match each student’s pace and learning needs.
- Hybrid and remote learning: Schools rely more on software platforms so students can learn from anywhere.
- Immersive technology: Virtual reality and augmented reality are added to make lessons more interactive.
- Gamification: Game-like features are used to keep students interested and motivated.
- AI integration: AI tutors and smart learning systems help guide students and deliver content more effectively.
Types of Gadgets and Solutions
- Hardware: Tablets, smartboards, projectors, science kits, graphic tablets, and robotics kits used in classrooms and labs.
- Software and platforms: Learning management systems, AI tutors, education apps, and virtual classrooms such as Google Classroom and Microsoft Teams.
- Content: Digital materials such as eBooks, interactive videos, and online learning modules.
Emerging Trends
Key Trend Description AI-integrated smart devices Educational gadgets embed AI to support adaptive learning paths and personalized feedback for students. VR/AR immersive hardware Devices enable virtual laboratories and simulations, allowing hands-on learning experiences. IoT-connected classroom tools Sensors, smart boards, and connected tools create interactive and data-driven classroom environments. Educational robots and STEM kits Robotics gadgets encourage coding, problem-solving, and engineering skills through interactive play. Wearables for learning analytics Wearable devices track engagement and well-being to help optimize study habits. Growth Factors
Key Factors Description Rising STEM education focus Growing emphasis on science and technology education increases demand for supportive learning gadgets. Hybrid and remote learning shift Blended learning models drive the need for portable and interactive educational devices. Government tech funding Public initiatives fund digital infrastructure and smart devices in schools. Mobile device affordability Lower prices for tablets and smartphones expand access to digital learning tools. Parental investment in edtech Families increasingly purchase learning gadgets to support education at home. Key Market Segments
By Product Type
- Interactive Learning Tablets & Smart Devices
- STEM Kits & Robotics (Coding toys, DIY kits)
- Language Learning Devices & Translators
- AR/VR Learning Headsets & Kits
- Smart Pens & Note-taking Devices
By End-User
- Individual Consumers
- Educational Institutions
- Corporate & Training Centers
By Distribution Channel
- Online Retail
- Offline Retail
- Direct Sales to Institutions
By Technology
- Screen-based Interactive
- Hands-on / Construction-based
- Augmented & Virtual Reality
- AI-powered Adaptive Learning
- Others
Regional Analysis
North America accounted for 38.5% share, supported by strong integration of technology into education across schools, universities, and home learning environments. Educational gadgets such as tablets, interactive boards, smart pens, learning wearables, and coding devices have been widely adopted to improve engagement and learning outcomes.
Demand has been driven by digital curriculum adoption, blended learning models, and increased focus on STEM education. The region’s strong purchasing power and well developed digital infrastructure have further supported steady market expansion.
The U.S. market reached USD 16.01 Bn and is projected to grow at a 15.62% CAGR, reflecting strong demand from K12 education, higher education, and home schooling segments. Adoption has been driven by government and institutional initiatives to modernize classrooms and improve digital access. Educational gadgets have supported interactive teaching methods, improved student participation, and enabled data driven learning assessment.
Key Regions and Countries
- North America
- US
- Canada
- Europe
- Germany
- France
- The UK
- Spain
- Italy
- Russia
- Netherlands
- Rest of Europe
- Asia Pacific
- China
- Japan
- South Korea
- India
- Australia
- Singapore
- Thailand
- Vietnam
- Rest of APAC
- Latin America
- Brazil
- Mexico
- Rest of Latin America
- Middle East & Africa
- South Africa
- Saudi Arabia
- UAE
- Rest of MEA
Competitive Analysis
The Educational Gadgets Market is supported by established brands that combine learning with play-based engagement. LEGO Education focuses on hands-on STEM learning through structured kits. VTech Holdings, Ltd. and LeapFrog Enterprises, Inc. emphasize early childhood learning and digital literacy. Fisher-Price, Inc. under Mattel integrates educational value into age-focused products. These players benefit from strong brand trust, global reach, and curriculum-aligned designs.
Technology-driven innovators strengthen the market through interactive and coding-based tools. Osmo blends physical play with digital interfaces. Sphero, Inc. and Makeblock Co., Ltd. focus on robotics and programming skills. Kano Computing, Ltd. and Piper, Inc. promote DIY learning and problem-solving. These firms address rising demand for practical STEM education.
Creative and niche providers expand engagement across subjects and age groups. PlayShifu, Inc. delivers AR-based learning experiences. Anki, Inc. and littleBits support experimentation and creativity. WowWee Group, Ltd., Thames & Kosmos, and Botley target logic and discovery learning. Other players continue to enter the market, increasing innovation and accessibility.
Top Key Players in the Market
- LEGO Education
- Osmo
- Sphero, Inc.
- Makeblock Co., Ltd.
- VTech Holdings, Ltd.
- LeapFrog Enterprises, Inc.
- PlayShifu, Inc.
- Kano Computing, Ltd.
- Anki, Inc.
- littleBits
- Fisher-Price, Inc. (Mattel)
- WowWee Group, Ltd.
- Thames & Kosmos
- Botley
- Piper, Inc.
- Others
Future Outlook
Growth in the Educational Gadgets market is expected to remain positive as learning becomes more interactive and technology driven. Devices such as smart boards, tablets, learning kits, and digital pens are being used to support hands on learning and improve student engagement.
Rising adoption of digital classrooms and home learning environments is supporting steady demand. Over time, better device affordability, content integration, and focus on child friendly design are likely to increase usage across schools and households.
Recent Developments
- January, 2025 – LEGO Education announced the launch of its new LEGO Education Science solution, a hands-on K-8 program with over 120 standards-aligned lessons using reusable bricks and hardware to boost student engagement in science.
- March, 2025 – LeapFrog showcased upcoming active learning toys at Toy Fair 2025, teasing a motion-based product set for fall release to blend movement with early skills like math and reading.
Report Scope
Report Features Description Market Value (2025) USD 46.2 Bn Forecast Revenue (2035) USD 229.8 Bn CAGR(2025-2035) 17.40% Base Year for Estimation 2024 Historic Period 2020-2024 Forecast Period 2025-2035 Report Coverage Revenue forecast, AI impact on Market trends, Share Insights, Company ranking, competitive landscape, Recent Developments, Market Dynamics and Emerging Trends Segments Covered By Product Type (Interactive Learning Tablets and Smart Devices,STEM Kits and Robotics (Coding toys, DIY kits), Smart Pens and Note-taking Devices), By End-User (Individual Consumers,Educational Institutions), By Distribution Channel (Online Retail,Offline Retail,Direct Sales to Institutions), By Technology (Screen-based Interactive,Hands-on and Construction-based,Others) Regional Analysis North America – US, Canada; Europe – Germany, France, The UK, Spain, Italy, Russia, Netherlands, Rest of Europe; Asia Pacific – China, Japan, South Korea, India, New Zealand, Singapore, Thailand, Vietnam, Rest of Latin America; Latin America – Brazil, Mexico, Rest of Latin America; Middle East & Africa – South Africa, Saudi Arabia, UAE, Rest of MEA Competitive Landscape LEGO Education, Osmo, Sphero, Inc., Makeblock Co., Ltd., VTech Holdings, Ltd., LeapFrog Enterprises, Inc., PlayShifu, Inc., Kano Computing, Ltd., Anki, Inc., littleBits, Fisher-Price, Inc. (Mattel), WowWee Group, Ltd., Thames & Kosmos, Botley, Piper, Inc., Others Customization Scope Customization for segments, region/country-level will be provided. Moreover, additional customization can be done based on the requirements. Purchase Options We have three license to opt for: Single User License, Multi-User License (Up to 5 Users), Corporate Use License (Unlimited User and Printable PDF)  Educational Gadgets MarketPublished date: Jan. 2026add_shopping_cartBuy Now get_appDownload Sample
 -
-
- LEGO Education
- Osmo
- Sphero, Inc.
- Makeblock Co., Ltd.
- VTech Holdings, Ltd.
- LeapFrog Enterprises, Inc.
- PlayShifu, Inc.
- Kano Computing, Ltd.
- Anki, Inc.
- littleBits
- Fisher-Price, Inc. (Mattel)
- WowWee Group, Ltd.
- Thames & Kosmos
- Botley
- Piper, Inc.
- Others
Our Clients
- 173392
- Jan. 2026


