
Global Data Warehouse Observability Market Size, Share and Analysis Report By Deployment Mode (Cloud-based, On-premises), By Organization Size (Large Enterprises, Small and Medium-sized Enterprises), By Application (Data Quality Monitoring, Performance Analytics and Query Optimization, Data Integration and Pipeline Health, Security and Compliance Monitoring, Cost Management and Resource Optimization), By End-User Industry (Banking, Financial Services, and Insurance, Retail and E-commerce, Healthcare and Life Sciences, IT and Telecommunications, Manufacturing, Logistics and Supply Chain, Media and Entertainment, Others), By Regional Analysis, Global Trends and Opportunity, Future Outlook By 2025-2035
- Published date: Feb. 2026
- Report ID: 177899
- Number of Pages: 241
- Format:
-
keyboard_arrow_up
Quick Navigation
- Report Overview
- Key Takeaway
- Statistics and Metrics
- Drivers Impact Analysis
- Restraint Impact Analysis
- By Deployment Mode
- By Organization Size
- By Application
- By End User Industry
- Regional Analysis
- Emerging Trends Analysis
- Growth Factors Analysis
- Opportunity Analysis
- Customer Impact: Trends and Disruptors
- Key Market Segments
- Key Players Analysis
- Recent Developments
- Report Scope
Report Overview
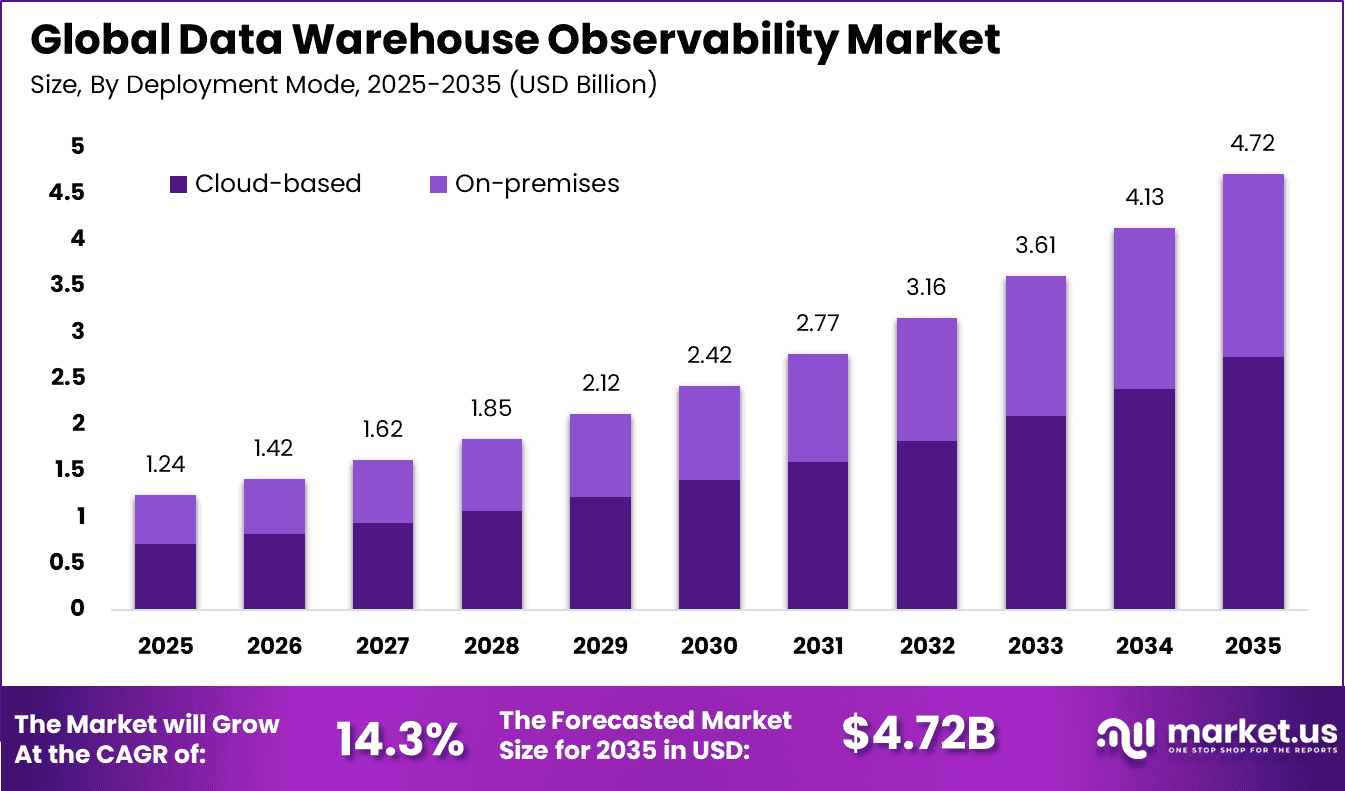
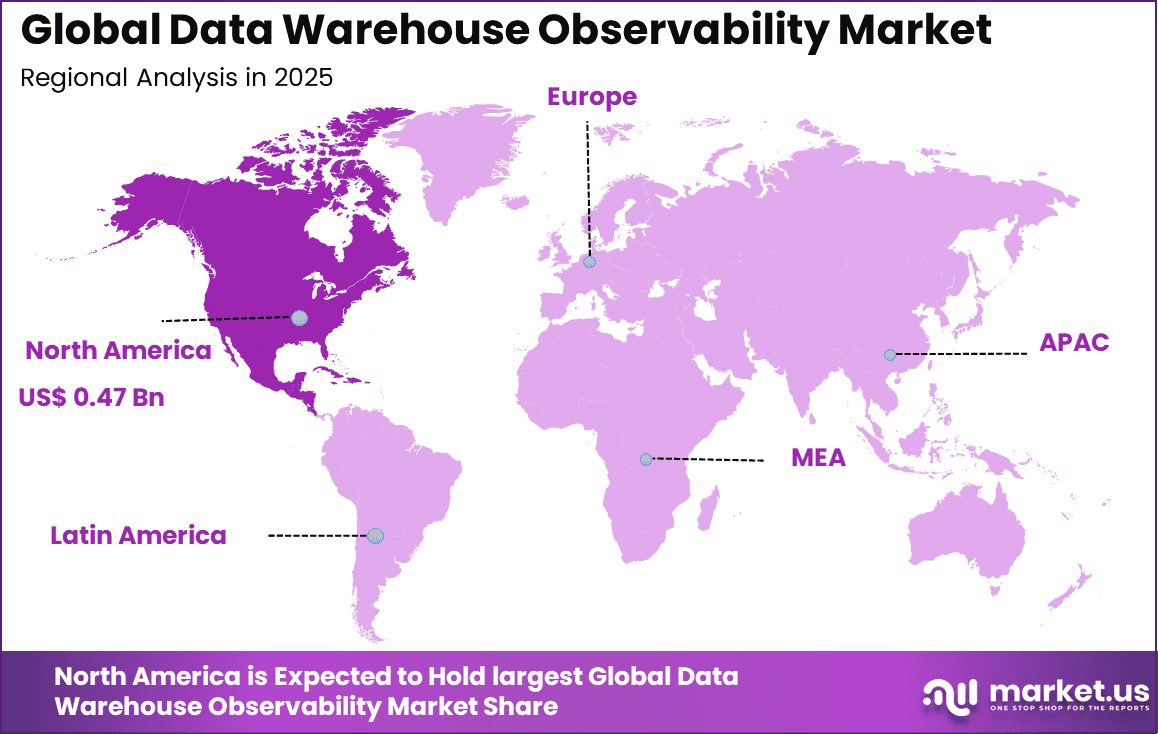
The Global Data Warehouse Observability Market size is expected to be worth around USD 4.72 billion by 2035, from USD 1.24 billion in 2025, growing at a CAGR of 14.3% during the forecast period from 2025 to 2035. North America held a dominant market position, capturing more than a 38.6% share, holding USD 0.47 billion in revenue.
The Data Warehouse Observability market refers to software and monitoring frameworks designed to continuously evaluate the reliability, freshness, quality, and performance of analytical data stored inside enterprise warehouses and lakehouse platforms. Modern organizations process billions of records every day and depend on accurate dashboards for operational and financial decisions. When a dataset becomes delayed or corrupted, business actions may be affected immediately.
Enterprises now operate hundreds of pipelines, and studies of enterprise analytics teams show that data incidents occur on average 2 to 5 times per week in large data environments. Traditional monitoring only checks system uptime, while observability evaluates completeness, schema change, lineage and anomaly detection together. This shift has positioned observability as a reliability layer for analytics infrastructure, similar to application performance monitoring in software engineering.
The main driver is the growing dependence on analytics for daily decision making. Retail, banking and logistics companies rely on automated dashboards, and research surveys indicate that more than 70% of business decisions in digital enterprises are now data assisted. A single failed pipeline can misreport revenue or inventory, which directly affects planning accuracy. Organizations therefore invest in preventive monitoring rather than reactive troubleshooting.
Demand is strongest among companies operating customer facing digital services because incorrect data impacts user experience and revenue. E commerce companies use pricing algorithms and recommendation systems that depend on fresh datasets. Financial institutions also require validated transaction data to prevent incorrect reporting and risk calculation. Small organizations are also entering the adoption cycle due to managed cloud data platforms.
For instance, in December 2025, Monte Carlo rolled out AI observability agents, including Monitoring and Troubleshooting Agents. These auto-suggest quality rules and root-cause issues, cutting data downtime by automating warehouse reliability checks.
Key Takeaway
- In 2025, cloud based deployment led the Global Data Warehouse Observability Market with a 58.0% share, reflecting preference for scalable and centralized monitoring environments.
- In 2025, large enterprises accounted for 62.0% of total adoption, driven by complex data ecosystems and higher governance requirements.
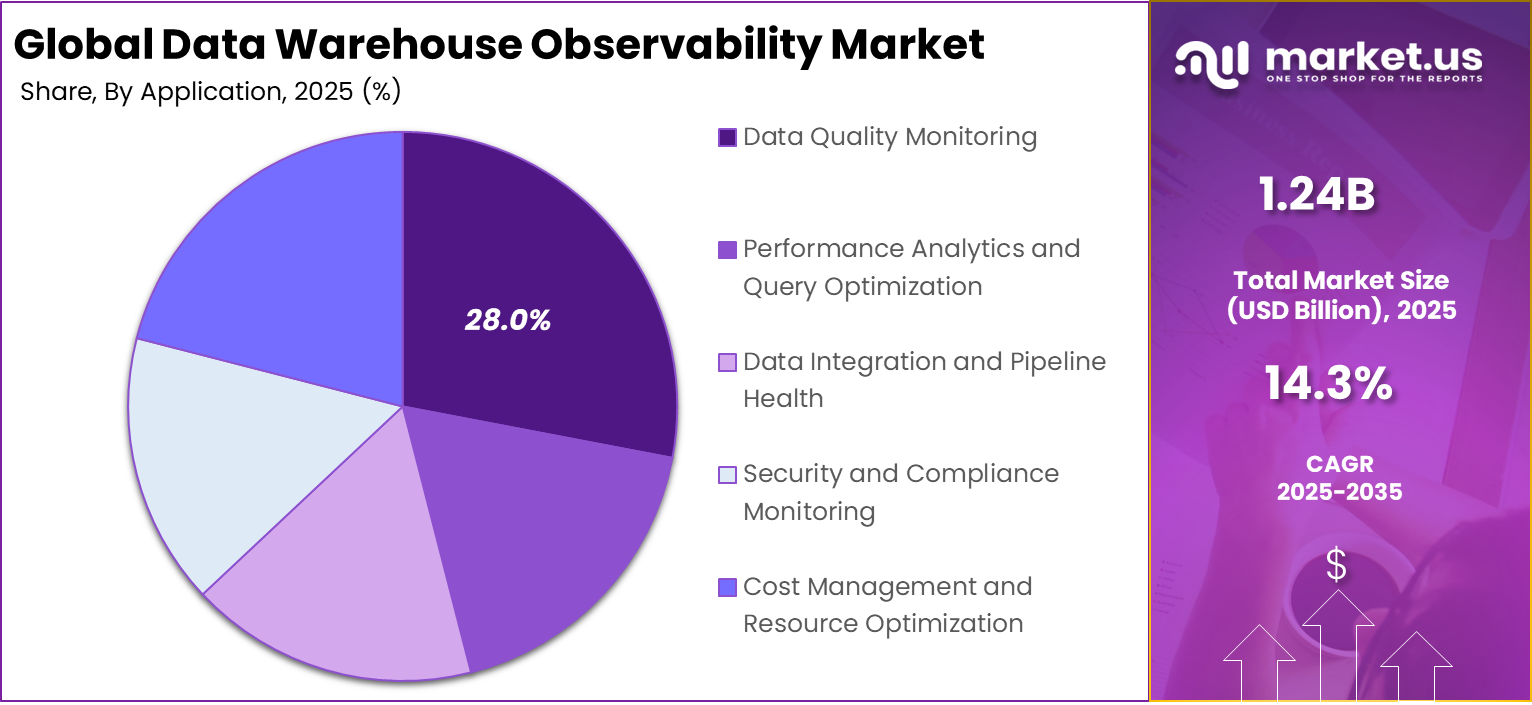
- In 2025, Data Quality Monitoring represented 28.0% of the market, highlighting focus on accuracy and reliability of warehouse data.
- In 2025, the Banking, Financial Services, and Insurance sector captured 35.0% of total demand, supported by strict compliance and reporting standards.
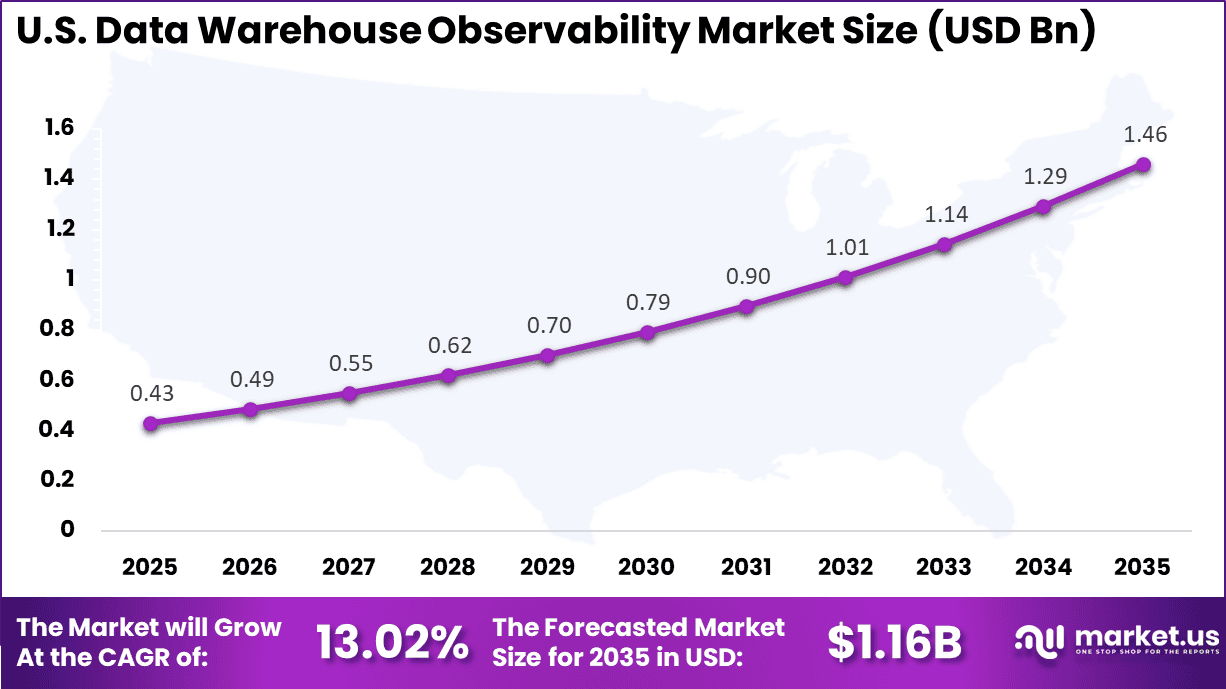
- In 2025, the US Data Warehouse Observability Market was valued at USD 0.43 billion and recorded a CAGR of 13.02%, reflecting steady enterprise investment.
- In 2025, North America held more than 38.6% of the Global Data Warehouse Observability Market, supported by advanced cloud infrastructure and mature data practices.
Statistics and Metrics
- By 2026, nearly 50% of enterprises operating distributed data architectures are expected to deploy data observability tools, compared with about 20% in 2024, reflecting rapid market expansion.
- Around 82% of organizations identify data quality concerns as a major barrier to data integration initiatives, and 80% of executives report limited trust in their data.
- The average time to resolve a data incident has increased from 9 hours to 15 hours year over year, indicating growing system complexity.
- Organizations may waste up to 32% of their cloud expenditure due to inefficient data processes, a gap that structured observability practices aim to reduce.
- A common operational benchmark estimates annual data incidents by dividing the total number of tables by 15, providing a reference for risk exposure.
- Deep column level monitoring is typically applied to 20% or less of total data assets, with priority given to business critical datasets.
Drivers Impact Analysis
Key Driver Impact on CAGR Forecast (~%) Geographic Relevance Impact Timeline Rapid adoption of cloud data warehouses and lakehouse architectures +3.8% North America, Europe Short to medium term Growing enterprise reliance on analytics for strategic decisions +3.2% Global Medium term Increasing incidents of data quality failures and reporting errors +2.9% Global Short to medium term Expansion of AI and machine learning workloads on warehouse data +2.4% North America, Asia Pacific Medium term Demand for governance and compliance monitoring across datasets +2.0% Europe, North America Medium to long term Restraint Impact Analysis
Key Restraint Impact on CAGR Forecast (~%) Geographic Relevance Impact Timeline Integration complexity across hybrid and multi-cloud environments -2.9% Global Short to medium term High implementation and customization costs -2.5% Emerging Markets Medium term Limited observability maturity in mid-sized enterprises -2.1% Asia Pacific, Latin America Medium term Data silos and inconsistent metadata management -1.8% Global Medium term Shortage of skilled data engineering talent -1.5% Global Medium to long term By Deployment Mode
Cloud based deployment accounted for 58.0% of implementations. The shift toward cloud data platforms has increased due to elastic storage, distributed compute processing, and support for streaming ingestion workloads. Observability tools operate closer to the processing layer, enabling automatic detection of anomalies without manual intervention. The approach improves operational continuity across multi region data environments.
Operational monitoring requirements have increased because modern analytics relies on continuous ingestion from applications, devices, and digital transactions. Cloud infrastructure enables real time telemetry collection across pipelines and storage layers. Organizations benefit from centralized dashboards that track latency, volume irregularities, and transformation errors. This capability reduces manual investigation cycles and supports faster incident resolution.
Security and governance frameworks also favor hosted deployments because access controls, logging, and encryption are managed centrally. Integration with identity and permission systems enables audit readiness. Enterprises operating global operations prefer scalable monitoring infrastructure that adjusts automatically to workload fluctuations. This has strengthened the adoption of hosted observability frameworks in modern data operations.
For Instance, in April 2025, Datadog expanded its Google Cloud observability with new BigQuery monitoring features. This update helps users track costs, spot data freshness issues, and optimize queries across cloud setups. It boosts efficiency for teams running data warehouses in the cloud, making it easier to handle growing workloads without surprises.
By Organization Size
Large enterprises represented 62.0% of adoption. These organizations operate complex data ecosystems consisting of multiple warehouses, transformation layers, and analytics applications. Observability is required to maintain consistent reporting across departments such as finance, risk management, and operations. Continuous monitoring ensures data remains synchronized across business units.
Regulatory exposure is higher in large organizations because reporting errors may lead to compliance penalties and reputational damage. Automated validation checks, lineage tracking, and alerting mechanisms help prevent inaccurate disclosures. Data teams rely on monitoring frameworks to validate transformations and detect unexpected schema changes. This reduces dependence on manual quality checks and strengthens governance practices.
Operational efficiency also improves through proactive error detection. Instead of reacting after dashboards fail, enterprises receive early warnings about pipeline instability. Maintenance efforts shift from reactive troubleshooting toward preventive management. As data volumes expand, automated observability becomes essential for operational sustainability.
For instance, in July 2025, Bigeye advanced its enterprise-grade observability, supporting hybrid clouds and legacy DBs with column-level lineage. Large orgs like Udacity cut issue detection from days to hours, unifying tools across vast estates. This appeals to big players handling diverse data, driving segment expansion through better governance and trust.
By Application
Data quality monitoring held 28.0% share of primary use cases. Organizations increasingly depend on analytics driven decision making, therefore accuracy of datasets directly influences strategy formulation. Observability tools detect null values, duplication, distribution shifts, and unexpected spikes in records. These indicators prevent incorrect performance assessments.
Modern business intelligence systems refresh frequently, sometimes within minutes. Without monitoring, delayed or corrupted data may propagate into executive reports. Continuous quality checks verify completeness before data reaches reporting layers. This protects planning, forecasting, and automated operational decisions from unreliable information.
Customer facing applications also rely on consistent datasets such as recommendations, personalization, and fraud detection models. Incorrect data may cause service disruptions or incorrect user actions. Monitoring frameworks therefore operate as an operational safeguard. The outcome is improved confidence in analytical outputs across the organization.
For Instance, in December 2024, Acceldata unveiled AI-powered tools for data quality, automating integrity checks across pipelines with intelligent alerting. It prioritizes issues in real-time, slashing bad data costs for quality-focused users. The features boost data quality monitoring by handling terabyte-scale validation proactively.
By End User Industry
The BFSI sector represented 35.0% of adoption. Financial institutions process transaction records, risk calculations, and customer identity information across multiple systems. Accuracy and traceability are mandatory due to strict compliance requirements. Observability platforms help ensure reconciliation between operational and reporting datasets.
Fraud detection and credit scoring models depend on timely and correct data ingestion. Missing or delayed records may create financial exposure. Monitoring tools track ingestion latency and transformation success rates across pipelines. This ensures risk evaluation systems operate with reliable inputs.
Audit and regulatory reporting further increases the need for transparent data lineage. Financial organizations must demonstrate how values were generated and transformed. Observability solutions provide historical tracking and alerting for unexpected changes. This capability supports compliance readiness and operational accountability.
For Instance, in December 2025, Acceldata pushed AI-driven observability tailored for strategic data management in finance sectors. It predicts pipeline issues before disruptions, ensuring reliable data for risk analysis and transactions in BFSI environments. High-growth firms used it to save product launches.
Regional Analysis
The market for Data Warehouse Observability within the U.S. is growing tremendously and is currently valued at USD 0.43 billion; the market has a projected CAGR of 13.02%. The market is expanding rapidly due to rising enterprise reliance on cloud data platforms, real time analytics, and AI driven decision making.
Organizations increasingly depend on accurate, high quality data for regulatory reporting, customer insights, and operational efficiency. Growing data complexity across hybrid environments has pushed companies to adopt observability tools that monitor data health, lineage, and performance, reducing downtime and strengthening trust in business intelligence systems.
For instance, in February 2026, Splunk Observability Cloud launched AI Agent Monitoring and Troubleshooting Agents, enhancing data warehouse visibility with root-cause analysis across metrics, logs, and traces for AI workloads on platforms like Snowflake. As a Cisco subsidiary, this bolsters U.S. dominance in unified observability, reducing incident resolution time.
In 2025, North America held a dominant market position in the Global Data Warehouse Observability Market, capturing more than a 38.6% share, holding USD 0.47 billion in revenue. This dominance is due to the early adoption of cloud technologies, the strong presence of data driven enterprises, and continuous investment in advanced analytics infrastructure.
Organizations across the region actively modernize legacy systems to support real time insights and AI initiatives. The availability of skilled data professionals, mature digital ecosystems, and high enterprise spending on SaaS and data engineering tools further strengthens regional leadership.
For instance, in February 2026, Datadog advanced LLM Observability for agent workflows on AWS Bedrock, integrating Metaplane’s data lineage for end-to-end warehouse monitoring. This AWS collaboration strengthens North American leadership in proactive data quality for hybrid clouds.
Emerging Trends Analysis
An important trend is monitoring based on the five core observability pillars: freshness, volume, schema, distribution, and lineage. These dimensions provide a comprehensive framework for assessing data health and detecting anomalies across the lifecycle.
Another trend is real time anomaly detection powered by machine learning. Automated monitoring systems can identify unusual behaviour patterns and trigger corrective action before downstream analytics are affected.
Growth Factors Analysis
One growth factor is expansion of real time analytics and automated decision systems. As organisations shift toward immediate operational intelligence, the tolerance for stale or inaccurate data decreases. Observability becomes essential to maintain continuous trust in reporting and automation.
Another growth factor is the rising cost of data downtime and poor quality insights. Reliable datasets enable better decision making, improved collaboration, and enhanced customer experience, encouraging long term investment in observability frameworks.
Opportunity Analysis
A key opportunity lies in regulatory and governance support. Observability platforms generate audit trails, lineage tracking, and validation logs that help organisations demonstrate data accuracy and compliance readiness. This is especially valuable in regulated industries requiring verifiable data handling practices.
Another opportunity is integration with artificial intelligence and advanced analytics initiatives. Reliable data is essential for model training and automated decision making, and observability ensures datasets remain accurate over time. This strengthens trust in AI outputs and improves business outcomes.
Customer Impact: Trends and Disruptors
For end users, the most visible impact is faster response and offline functionality. Applications such as safety alerts, personalized assistance, and device automation operate instantly because they no longer depend on continuous network connectivity. This improves reliability in environments where connectivity is unstable or unavailable.
Privacy expectations are also changing customer behavior. When sensitive information is processed locally, trust in digital services increases and adoption becomes easier in regulated sectors. This trust factor is becoming a decisive influence in technology selection decisions across industries.
Another disruptive impact is the rise of contextual personalization. Devices adapt to behavior patterns in real time and deliver tailored recommendations without sharing raw data externally. Such interaction shifts the user experience from generic automation toward intelligent assistance that feels integrated into daily activity.
Key Market Segments
By Deployment Mode
- Cloud-based
- On-premises
By Organization Size
- Large Enterprises
- Small and Medium-sized Enterprises
By Application
- Data Quality Monitoring
- Performance Analytics and Query Optimization
- Data Integration and Pipeline Health
- Security and Compliance Monitoring
- Cost Management and Resource Optimization
By End-User Industry
- Banking, Financial Services, and Insurance
- Retail and E-commerce
- Healthcare and Life Sciences
- IT and Telecommunications
- Manufacturing
- Logistics and Supply Chain
- Media and Entertainment
- Others
Key Regions and Countries
North America
- US
- Canada
Europe
- Germany
- France
- The UK
- Spain
- Italy
- Russia
- Netherlands
- Rest of Europe
Asia Pacific
- China
- Japan
- South Korea
- India
- Australia
- Singapore
- Thailand
- Vietnam
- Rest of APAC
Latin America
- Brazil
- Mexico
- Rest of Latin America
Middle East & Africa
- South Africa
- Saudi Arabia
- UAE
- Rest of MEA
Key Players Analysis
Specialized data observability vendors such as Monte Carlo, Bigeye, Anomalo, Acceldata, Soda, Metaplane, Validio, and Datafold lead the data warehouse observability market. Their platforms monitor freshness, volume, schema changes, and anomalies within cloud warehouses. Automated alerts and lineage tracking improve trust in analytics outputs. Demand is driven by increasing reliance on data-driven decision making and complex ELT pipelines.
Observability and monitoring providers such as Datadog, Splunk, Dynatrace, and New Relic integrate warehouse signals into broader infrastructure dashboards. These tools support root cause analysis and cross-stack visibility. Adoption is strong among enterprises managing hybrid data architectures. Data teams benefit from reduced downtime and improved reporting accuracy.
Cloud and enterprise platform providers such as IBM, Amazon Web Services, and Microsoft embed observability features within managed warehouse services. Their scalable infrastructure supports automated policy enforcement and monitoring. Other vendors expand innovation and regional reach. This competitive landscape supports steady growth in data warehouse observability solutions globally.
Top Key Players in the Market
- Monte Carlo
- Datadog
- Bigeye
- Anomalo
- Acceldata
- Soda
- Metaplane
- Validio
- Datafold
- IBM
- Splunk
- Dynatrace
- New Relic
- AWS
- Microsoft
- Others
Recent Developments
- In February 2025, Acceldata launched Agentic Data Management, an AI-first platform revolutionizing data governance for AI pipelines. In private beta, it predicts issues and optimizes costs across hybrid environments, earning praise for deep observability in data lakes and warehouses.
- In November 2025, Splunk unveiled enhanced observability features for unified IT visibility and data control. The updates improve digital resilience with better anomaly detection in data warehouses, helping ops teams handle complex streaming workloads.
Report Scope
Report Features Description Market Value (2025) USD 1.2 Billion Forecast Revenue (2035) USD 4.7 Billion CAGR(2025-2035) 14.3% Base Year for Estimation 2024 Historic Period 2020-2024 Forecast Period 2025-2035 Report Coverage Revenue forecast, AI impact on Market trends, Share Insights, Company ranking, competitive landscape, Recent Developments, Market Dynamics and Emerging Trends Segments Covered By Deployment Mode (Cloud-based, On-premises), By Organization Size (Large Enterprises, Small and Medium-sized Enterprises), By Application (Data Quality Monitoring, Performance Analytics and Query Optimization, Data Integration and Pipeline Health, Security and Compliance Monitoring, Cost Management and Resource Optimization), By End-User Industry (Banking, Financial Services, and Insurance, Retail and E-commerce, Healthcare and Life Sciences, IT and Telecommunications, Manufacturing, Logistics and Supply Chain, Media and Entertainment, Others) Regional Analysis North America – US, Canada; Europe – Germany, France, The UK, Spain, Italy, Russia, Netherlands, Rest of Europe; Asia Pacific – China, Japan, South Korea, India, New Zealand, Singapore, Thailand, Vietnam, Rest of Latin America; Latin America – Brazil, Mexico, Rest of Latin America; Middle East & Africa – South Africa, Saudi Arabia, UAE, Rest of MEA Competitive Landscape Monte Carlo, Datadog, Bigeye, Anomalo, Acceldata, Soda, Metaplane, Validio, Datafold, IBM, Splunk, Dynatrace, New Relic, AWS, Microsoft, Others Customization Scope Customization for segments, region/country-level will be provided. Moreover, additional customization can be done based on the requirements. Purchase Options We have three license to opt for: Single User License, Multi-User License (Up to 5 Users), Corporate Use License (Unlimited User and Printable PDF)  Data Warehouse Observability MarketPublished date: Feb. 2026add_shopping_cartBuy Now get_appDownload Sample
 -
-
- Monte Carlo
- Datadog
- Bigeye
- Anomalo
- Acceldata
- Soda
- Metaplane
- Validio
- Datafold
- IBM
- Splunk
- Dynatrace
- New Relic
- AWS
- Microsoft
- Others
Our Clients
- 177899
- Feb. 2026


