


Report Overview
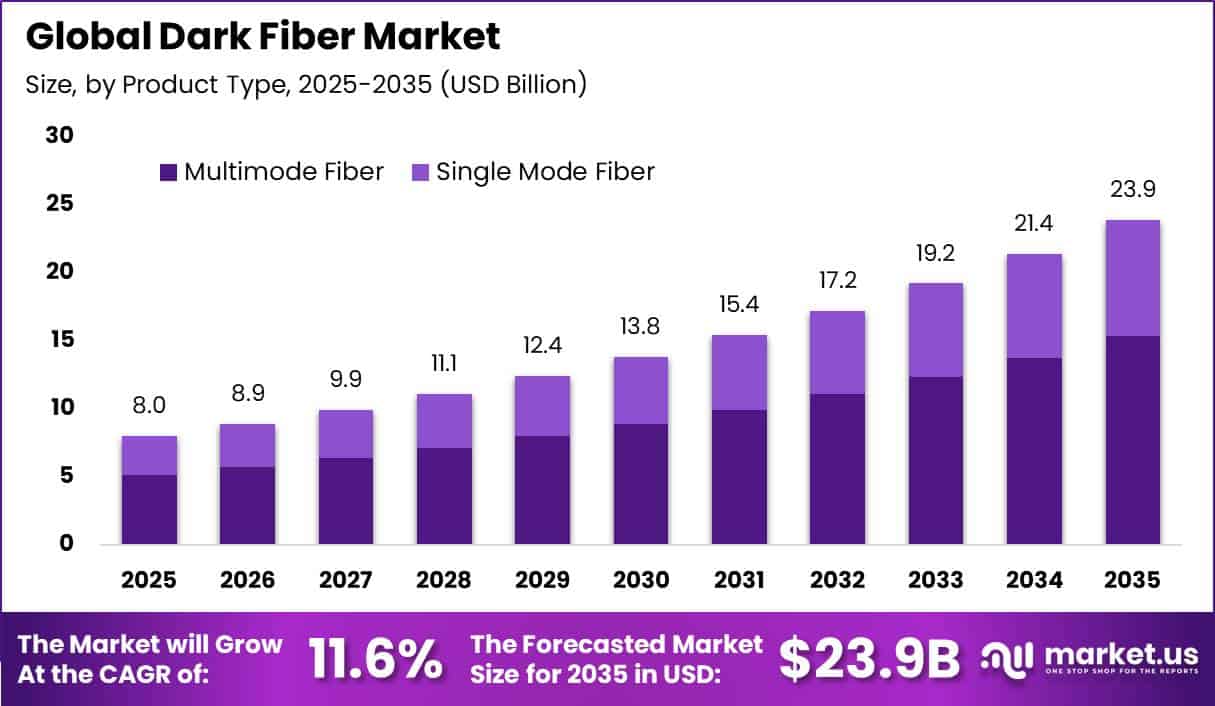
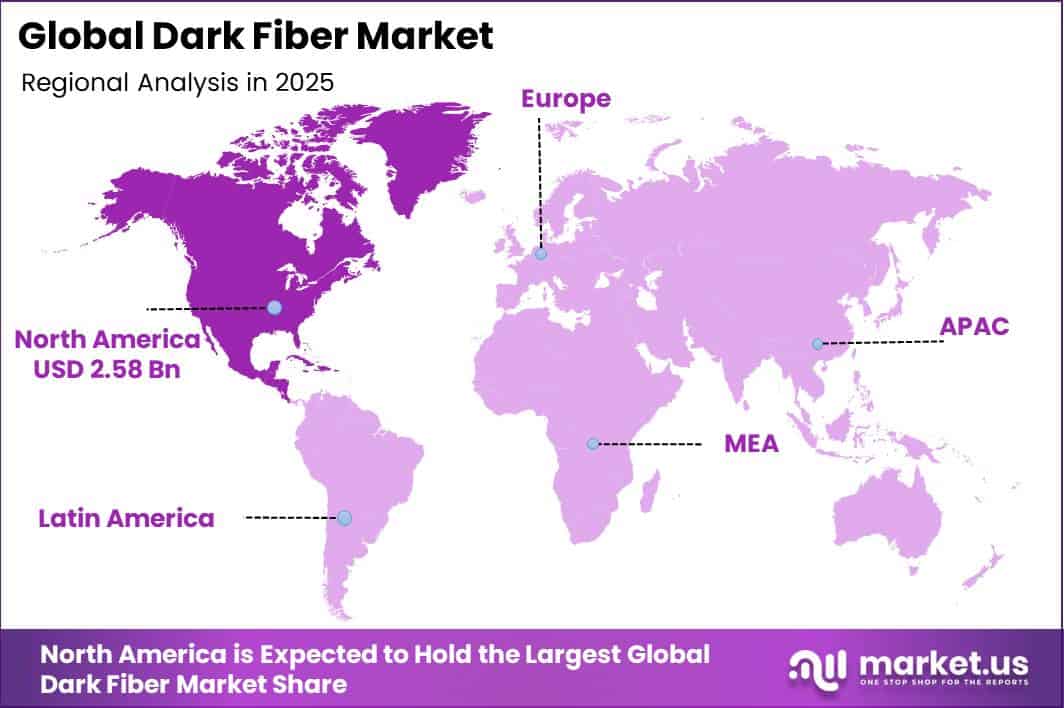
In 2025, the Global Dark Fiber Market was valued at USD 8.0 billion. The market is projected to grow at a CAGR of 11.6% during 2026–2035, reaching approximately USD 23.9 billion by 2035. North America dominated the global market in 2025, accounting for more than 32.3% of the total market share and generating approximately USD 2.58 billion in revenue.
This growth is mainly supported by rising internet traffic and mobile connectivity. According to the ITU, global fixed broadband traffic increased from 5.1 zettabytes in 2023 to 6 zettabytes in 2024. Mobile broadband traffic reached nearly 1.3 zettabytes, recording annual growth of 19.6% since 2021. The global internet user base reached 6 billion in 2025, with 240 million people coming online during the year.
Meanwhile, 5G subscriptions approached 3 billion, representing nearly one-third of mobile broadband connections. GSMA Intelligence also reported that global 5G connections exceeded 2.7 billion by the end of 2025. These developments are pushing telecom and cloud companies to lease dark fiber for faster and more flexible network expansion.
Data center expansion is adding further demand. The IEA reported that global data center electricity consumption reached 415 terawatt-hours in 2024, equal to around 1.5% of worldwide electricity use. Consumption could more than double to 945 terawatt-hours by 2030. The United States accounted for 45% of global data center electricity consumption in 2024. ITU data also shows that 5G coverage reaches 84% of people in high-income countries but only 4% in low-income countries.
Key Takeaway
- The Dark Fiber Market was valued at USD 8.0 billion in 2025 and is projected to reach USD 23.9 billion by 2035, growing at a CAGR of 11.6% during 2026–2035.
- Multimode fiber dominated the dark fiber market, holding a 64.2% share.
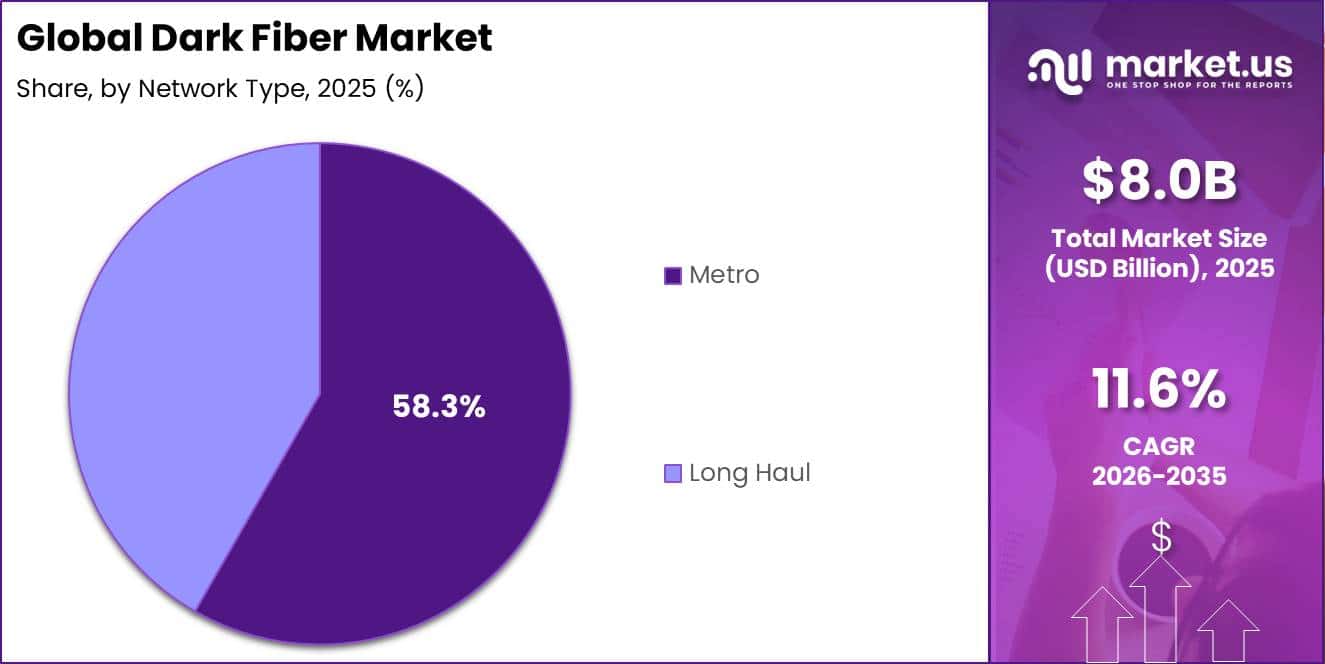
- Metro networks led the dark fiber market, accounting for a 58.3% share.
- Glass, particularly silica-based optical fiber, dominated the market with an 85.7% share.
- Internet service providers (ISPs) held the leading market position, accounting for a 34.6% share.
- North America led the market in 2025 with a 32.3% share and approximately USD 2.5 billion in revenue.
Market Statistics and Data Insights
- Average monthly mobile usage was 16.2 GB per subscription in high-income countries versus 2 GB in low-income countries. Fixed-broadband usage was 435 GB per subscription in high-income economies versus 200–250 GB in low- and middle-income economies.
- Cloudflare measured 19% growth in global internet traffic during 2025. It also recorded 174 major internet disruptions, 47% of which resulted from government-directed shutdowns.
- Global data-center electricity demand increased 17% in 2025, while AI-focused data-center demand rose 50%. Five major technology companies invested more than USD 400 billion, and the technology sector represented around 40% of corporate renewable-power agreements signed that year.
- Civil works can represent up to 70% of broadband-network deployment costs. The EU Gigabit Infrastructure Act, fully applicable from May 12, 2026, promotes shared ducts, poles and coordinated construction.
- IEEE 802.3cm supports 400 Gbps transmission over multimode fiber for distances of at least 100 meters. Separate IEEE standards support 50–400 Gbps over single-mode fiber for at least 40 kilometers, demonstrating the different roles of the two fiber types.
- OECD countries had 504 million fixed-broadband subscriptions by June 2024, averaging 36.3 per 100 inhabitants. Fiber represented 44.6% of fixed connections, while 5G subscriptions increased 48% in one year.
- Lumen reported nearly USD 13 billion in signed Private Connectivity Fabric contracts, 17 million intercity fiber miles deployed by year-end 2025, and more than 2,000 Network-as-a-Service customers.
- During 2025, Zayo added 899 route miles and 1.15 million fiber miles in North America, while its worldwide additions exceeded 1.3 million fiber miles.
- An August 2025 Censuswide survey of 100 data-center decision-makers found that 82% had delayed site construction or expansion because of fiber availability, while 95% said access to new high-capacity fiber would influence future expansion decisions.
- The same 2025 research surveyed 100 enterprise IT leaders and 100 local-government stakeholders; 89% of government respondents reported projects delayed by fiber gaps, 45% of enterprises identified fiber as a major infrastructure bottleneck, and 46% of authorities said their networks were not fully prepared for AI data centers.
- Global mobile-network traffic reached 210 exabytes per month in Q1 2026, representing 22% year-over-year growth; video accounted for approximately 75% of mobile traffic at the end of 2025, increasing fiber-backhaul loads.
By Product Type
Multimode fiber held a dominant position in the dark fiber market, accounting for a 64.2% share. Its leadership is mainly supported by strong demand for short-distance connections across data centers and enterprise campuses. Under the IEEE 802.3 Ethernet standards, OM3 and OM4 multimode fibers can support transmission speeds of 40–100 Gbps over distances of approximately 100–150 meters using cost-effective VCSEL technology.
The TIA-568.3-D cabling standard also confirms that OM4 fiber can carry 10 Gbps signals over distances of up to 550 meters, making it suitable for most data center and campus backbone networks. In addition, the IEA expects global data center electricity demand to more than double by 2030, driven largely by expanding AI workloads.
By Network Type
Metro networks held a dominant position in the dark fiber market, accounting for a 58.3% share. This leadership is mainly driven by the concentration of telecom traffic in densely populated urban areas, where high-capacity fiber loops connect data centers, network exchanges, cell towers, and business campuses.
According to the UN DESA World Urbanization Prospects 2025, cities are home to 45% of the world’s 8.2 billion people, equal to approximately 3.69 billion residents. The combined share of people living in cities and towns has reached 58% worldwide. In the United States, the Census Bureau reported that nearly 294 million people, or about 86% of the population, lived in metropolitan areas as of mid-2024.
It also found that 88% of metropolitan regions continued to gain residents. This growing urban concentration is encouraging telecom operators to expand short-distance fiber rings instead of relying only on long-haul routes. As cities attract more residents, metro fiber capacity will need to expand rapidly to handle rising local internet, mobile, cloud, and enterprise data traffic.
By Material
Glass, particularly silica-based optical fiber, held a dominant position in the dark fiber market with an 85.7% share. Its leadership is supported by low signal loss, high transmission efficiency, and reliable performance across long-distance networks. The ITU-T G.657 standard shows that modern silica fiber can achieve attenuation as low as 0.40 dB/km across the 1,310–1,625 nanometer wavelength range.
This allows data signals to travel over long distances with limited power loss, making glass more suitable than copper or plastic for high-bandwidth connections. The U.S. Geological Survey reported that domestic industrial sand and gravel production reached 130 million tons in 2024. Around 8% of this material has historically been used in glassmaking applications, supporting the wider silica supply chain.
By End-User
Internet service providers held a leading position in the dark fiber market, accounting for a 34.6% share. Their dominance is supported by the need to expand network capacity for a growing number of broadband customers. World Bank data shows that global fixed broadband subscriptions reached 1.6 billion in 2024.
Across OECD countries, fixed broadband penetration averaged 36.3 subscriptions per 100 people in June 2024, more than double the non-OECD global average of 16.2 subscriptions per 100 people. Fiber connections represented 45% of all fixed broadband lines in OECD countries, rising from 27% in 2019.
The Fiber Broadband Association also reported that U.S. fiber networks passed 84.6 million homes by the end of 2025, representing annual growth of 11%. Average fiber subscribers consumed around 837 GB of downstream data each month. These trends are encouraging internet service providers to lease dark fiber for both backbone and last-mile networks.
Key Market Segments
By Product Type
- Single Mode Fiber
- Multimode Fiber
By Network Type
- Metro
- Long Haul
By Material
- Glass
- Plastic
By End-User
- Internet Service Providers (ISPs)
- BFSI Industry
- IT Enabled Services
- Military and Aerospace Industry
- Oil and Gas Industry
- Healthcare Industry
- Railway Industry
- Others
Geopolitical Impact Analysis
Rising U.S.–China trade tensions are changing the cost structure of dark fiber networks by increasing prices for cables and optical equipment. Imported fiber-optic cables under HTS code 8544.70 face a 25% Section 301 duty plus a 20% IEEPA tariff, while optical transceivers are subject to an additional 7.5% Section 301 levy. These tariffs increase landed costs for operators purchasing network equipment from Asia.
Average U.S. tariffs on Chinese imports remained near 30% by mid-2026 following the May 2025 Geneva truce. This was below the 145% peak recorded in April 2025, but still higher than the 21% baseline at the beginning of that year.
China’s export licensing rules for rare earths and gallium, introduced in April 2025, created further pressure by reducing exports of heavy rare earth materials such as yttrium, dysprosium, and terbium by approximately 50% compared with pre-restriction levels. UNCTAD reported that Red Sea shipping through the Suez corridor remained 70% below the 2023 average by mid-2025.
Rerouting ships around the Cape of Good Hope increased global seaborne ton-miles by 5.9% in 2024, although cargo volumes grew by only 2.2%. Together, tariffs, export controls, and longer shipping routes are raising procurement costs, extending delivery times, and encouraging dark fiber operators to reduce dependence on China-based supply chains.
Regional Analysis
North America held a dominant position in the global dark fiber market, accounting for a 32.3% share and generating approximately USD 2.5 billion in revenue in 2025. Its leadership is supported by an advanced and widely established fiber network. According to the Fiber Broadband Association, U.S. fiber networks passed 84.6 million homes by the end of 2025, covering roughly 60% of all households.
Operators added 11.8 million new fiber passings during the year, representing annual growth of 11%. This large network provides telecom carriers, internet providers, and hyperscale data centers with extensive unlit fiber routes for capacity expansion. Europe remained a stable secondary market, supported by high fixed broadband penetration and continued enterprise migration to cloud services.
Asia Pacific emerged as the fastest-growing region due to expanding telecom networks and rapid 5G deployment across India and China. India’s telecom subscriber base reached 1,228.9 million in September 2025, while internet subscriptions increased to 1,017.8 million. The country’s 5G fixed wireless access subscribers rose from 7.8 million in June 2025 to 10.4 million, an increase of more than 32% within five months.
Meanwhile, Chinese data centers consumed 140 billion kilowatt-hours of electricity in 2024, equal to around 1.4% of national electricity use. Growing mobile connectivity, 5G networks, and data center capacity are expected to make Asia Pacific the fastest-expanding dark fiber market through 2035.
Key Regions and Countries
North America
- US
- Canada
Europe
- Germany
- France
- The UK
- Spain
- Italy
- Rest of Europe
Asia Pacific
- China
- Japan
- South Korea
- India
- Australia
- Rest of APAC
Latin America
- Brazil
- Mexico
- Rest of Latin America
Middle East & Africa
- GCC
- South Africa
- Rest of MEA
Market Dynamics
Drivers
| Driver | (~) % CAGR | Geographic Relevance | Impact Timeline |
|---|---|---|---|
| AI Network Capacity Contracts | +2.4% | North America, Europe | Short term (2 years or less) |
| Federal Broadband Buildout | +1.8% | United States | Medium term (2 to 4 years) |
| Enterprise Cloud Interconnection | +1.5% | Global metro markets | Short term (2 years or less) |
| Mobile Backhaul Densification | +1.1% | Asia Pacific, North America | Medium term (2 to 4 years) |
| Public-Sector Network Modernization | +0.7% | North America, Europe | Long term (4 years or more) |
AI Network Capacity Contracts
AI infrastructure is turning dark fiber into a contracted enterprise-network service rather than unused backup capacity. By 2025, Lumen had secured nearly USD 13 billion in prepaid construction fiber agreements, showing that hyperscale customers are reserving dedicated routes before networks are completed.
The IEA expects global data-center electricity consumption to rise from about 415 TWh in 2024 to approximately 945 TWh by 2030. These facilities require high-capacity links between campuses, including 400 Gbps or faster connections with low latency and separate physical routes. Longer contracts, upfront construction payments, and better route utilization could add an estimated +2.4% to the market’s 11.6% baseline CAGR.
Restraints
| Restraint | (~) % CAGR | Geographic Relevance | Impact Timeline |
|---|---|---|---|
| High Cost of Capital | -2.1% | North America, Europe | Short term (2 years or less) |
| Municipal Permit Delays | -1.4% | Urban North America, Europe | Medium term (2 to 4 years) |
| Import Tariff Exposure | -1.0% | United States | Short term (2 years or less) |
| Rural Build Economics | -0.8% | North America, Asia Pacific | Long term (4 years or more) |
| Utility Make-Ready Costs | -0.5% | United States | Medium term (2 to 4 years) |
High Cost of Capital
High borrowing costs remain a major short-term barrier to dark fiber construction because operators must fund trenching, conduit, splicing, and right-of-way costs before receiving lease revenue. The 10-year U.S. Treasury yield reached 4.64% on August 25, 2026, compared with 4.24% one year earlier. U.S. Treasury data placed the yield near 4.66% on August 26, 2026.
Dark fiber projects also face build, service, and reporting conditions before government support can be fully used. By late 2025, approved BEAD proposals had generated estimated taxpayer savings of at least USD 21 billion, increasing pressure on construction bids and unit costs. Higher financing expenses can weaken returns, delay lower-priority routes, and create an estimated −2.1% drag on the market’s baseline CAGR.
Challenges
| Challenge | (~) % CAGR | Geographic Relevance | Mitigation Horizon |
|---|---|---|---|
| Route Diversity Constraints | -1.6% | Global metro markets | Long term (4 years or more) |
| Skilled Fiber Labor Gap | -1.2% | North America, Europe | Medium term (2 to 4 years) |
| Network Mapping Fragmentation | -0.9% | Global | Medium term (2 to 4 years) |
| Construction Material Volatility | -0.7% | Global | Short term (2 years or less) |
| Physical Network Security | -0.5% | Europe, North America | Long term (4 years or more) |
Route Diversity Constraints
Route diversity remains a major technical challenge because separate fiber circuits may still share the same conduit, bridge, railway corridor, or metro site. The U.S. is directing USD 42.4 billion through the BEAD program, increasing competition for rights-of-way, utility poles, and limited urban routes.
By late 2025, 53 of 56 eligible states and territories had submitted their Final Proposals. Operators must build geographically separate routes, maintain accurate network maps, verify underground utilities, and secure repair capacity.
These measures reduce outage risks and improve network reliability, but they also increase construction and operating costs. As a result, route-diversity requirements could create an estimated −1.6% drag on achievable CAGR.
Opportunities
| Opportunity | (~) % CAGR | Geographic Relevance | Execution Window |
|---|---|---|---|
| Open-Access Fiber Platforms | +2.0% | North America, Europe | Medium term (2 to 4 years) |
| Intercity AI Fiber Corridors | +1.7% | North America, Europe, Asia Pacific | Long term (4 years or more) |
| Edge Data Center Links | +1.4% | Global metro markets | Medium term (2 to 4 years) |
| Public Infrastructure Leasing | +1.0% | North America, Europe | Long term (4 years or more) |
| Fiber Asset Roll-Ups | +0.8% | North America, Latin America | Short term (2 years or less) |
Open-Access Fiber Platforms
Open-access dark fiber platforms offer strong growth potential because many networks remain under the control of a single operator. OECD countries averaged 36.3 fixed-broadband subscriptions per 100 people in June 2024, creating a large customer base for shared infrastructure.
The NTIA’s USD 42.45 billion BEAD program also supports broadband expansion, while its 2025 reviews identified at least USD 21 billion in potential taxpayer savings. The European Commission’s Gigabit Infrastructure Act encourages easier access to existing ducts, poles, and other physical infrastructure, helping operators lower construction costs.
Leasing unused fiber to multiple tenants can improve network use, reduce investment per customer, and potentially raise recurring margins by 10%–20%. Effective open-access models could provide up to +2.0% CAGR upside beyond the baseline forecast.
Key Players Analysis
Tier-1 companies lead the dark fiber market through large capital investments and acquisitions. AT&T reported capital investment of USD 22.0 billion in 2025, helping its fiber broadband connections reach 10.4 million by year-end, an increase of 11.5% from the previous year. The company also completed its USD 5.75 billion acquisition of Lumen’s mass-market fiber-to-the-home business in early 2026, increasing the concentration of U.S. fiber assets.
Verizon invested USD 17 billion in 2025 and, together with its Frontier acquisition, added 1.9 million net broadband and fiber connections. The company aims to reach 40–50 million fiber passings over time. Lumen generated USD 12.4 billion in revenue during 2025, including USD 112 million in additional dark fiber and conduit revenue. It also secured nearly USD 13 billion in Prepaid Construction Fiber agreements linked to hyperscale AI demand.
Tier-2 competitors are expanding mainly through mergers and asset purchases. Crown Castle agreed to sell its Fiber Business for USD 8.5 billion, with Zayo acquiring the fiber solutions unit and EQT’s Active Core Infrastructure fund purchasing the small-cell operations. The transaction is expected to close in the first half of 2026.
Crown Castle’s fiber segment generated USD 1.19 billion in site-rental revenue in 2024. Consolidated Communications, Windstream, GTT, Colt, Zayo, UFINET, and Unite Private Networks compete through dense metro coverage and specialized enterprise wavelength services.
Top Key Players in the Market
- AT&T Inc.
- Colt Technology Services Group Limited
- Comcast
- Consolidated Communications
- GTT Communications, Inc.
- Lumen Technologies, Inc.
- Verizon Communications, Inc.
- Windstream Intellectual Property Services, LLC
- Zayo Group, LLC
- Microscan
- Sorrento Networks
- NexGen Networks Corporation
- UFINET
- Vikram Group
- DEPL
- UNITE PRIVATE NETWORKS
- Sterlite Power
- Crown Castle
- FirstLight
- Cologix
Recent Developments
- In 2025, Uniti Group completed its merger with Windstream on August 1. Uniti’s annual report recorded total merger consideration of approximately USD 2,376.6 million, while the combined company created a nationwide network covering about 240,000 fiber route miles.
- In 2026, Zayo completed its acquisition of Crown Castle’s Fiber Solutions business on May 1. The approximately USD 4.25 billion deal added around 90,000 route miles and 40,000 on-net enterprise locations, increasing Zayo’s North American network to 224,000 route miles. The acquisition formed part of Crown Castle’s broader USD 8.5 billion fiber-business divestiture.
Report Scope
| Report Features | Description |
|---|---|
| Market Value (2025) | USD 8.0 Billion |
| Forecast Revenue (2035) | USD 23.9 Billion |
| CAGR (2026-2035) | 11.6% |
| Base Year for Estimation | 2025 |
| Historic Period | 2020-2024 |
| Forecast Period | 2026-2035 |
| Report Coverage | Revenue Forecast, Market Dynamics, Competitive Landscape, Recent Developments |
| Segments Covered | By Product Type: (Single Mode Fiber, Multimode Fiber); By Network Type: (Metro, Long Haul); By Material: (Glass, Plastic); By End-User: (Internet Service Providers (ISPs), BFSI Industry, IT Enabled Services, Military and Aerospace Industry, Oil and Gas Industry, Healthcare Industry, Railway Industry, Others) |
| Regional Analysis | North America – US, Canada; Europe – Germany, France, The UK, Spain, Italy, Rest of Europe; Asia Pacific – China, Japan, South Korea, India, Australia, Singapore, Rest of APAC; Latin America – Brazil, Mexico, Rest of Latin America; Middle East & Africa – GCC, South Africa, Rest of MEA |
| Competitive Landscape | AT&T Inc., Colt Technology Services Group Limited, Comcast, Consolidated Communications, GTT Communications, Inc., Lumen Technologies, Inc., Verizon Communications, Inc., Windstream Intellectual Property Services, LLC, Zayo Group, LLC, Microscan, Sorrento Networks, NexGen Networks Corporation, UFINET, Vikram Group, DEPL, UNITE PRIVATE NETWORKS, Sterlite Power, Crown Castle, FirstLight, Cologix |
| Customization Scope | Customization for segments and region/country-level will be provided. Moreover, additional customization can be done based on the requirements. |
| Purchase Options | We have three licenses to opt for: Single User License, Multi-User License (Up to 5 Users), Corporate Use License (Unlimited Users and Printable PDF) |





























