
Global Cryogenic Equipment Market Size, Share Analysis Report By Product (Tank, Valve, Pumps, Vaporizers, Vacuum Jacketed Piping (VJP), Others), By Cryogen (Nitrogen, Oxygen, Argon, Liquified Natural Gas, Hydrogen, Others), By Application (Distribution, Storage), By End-use (Oil And Gas, Metallurgy, Automotive, Food And Beverage, Chemical, Other) , By Region and Companies - Industry Segment Outlook, Market Assessment, Competition Scenario, Trends and Forecast 2025-2034
- Published date: Jan 2026
- Report ID: 172754
- Number of Pages: 317
- Format:
-
keyboard_arrow_up
Quick Navigation
Report Overview
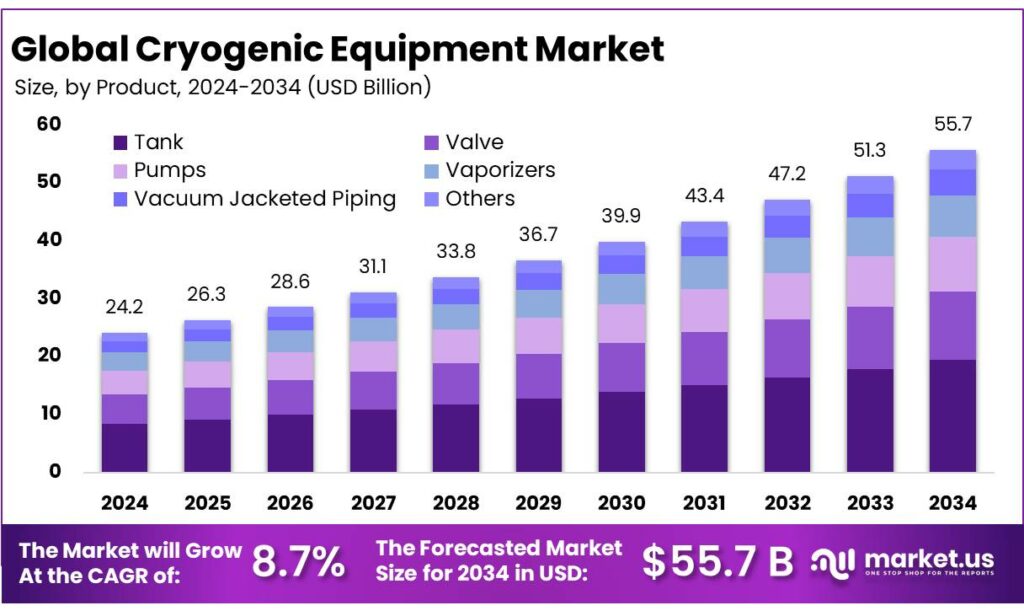
The Global Cryogenic Equipment Market size is expected to be worth around USD 55.7 Billion by 2034, from USD 24.2 Billion in 2024, growing at a CAGR of 8.7% during the forecast period from 2025 to 2034. In 2024 Asia Pacific held a dominant market position, capturing more than a 41.7% share, holding USD 10 Billion in revenue.
Cryogenic equipment refers to the insulated, pressure-rated systems used to produce, store, transfer, and use fluids at extremely low temperatures (typically below about −150°C), such as liquid nitrogen, liquid oxygen, liquid argon, LNG, and liquid hydrogen. In industrial value chains, this equipment set includes vacuum-insulated tanks, transport dewars, cold boxes, cryogenic pumps, vaporizers, valves, and vacuum-jacketed piping—engineered to minimize heat ingress, control boil-off, and maintain stable product quality.
- Industrially, the strongest pull is coming from global gas and clean-energy logistics. LNG trade reached 411.24 million tonnes in 2024, connecting 22 exporting and 48 importing markets, underscoring how much cryogenic storage and transfer hardware is embedded in modern energy security planning. In parallel, the International Energy Agency noted a coming wave of LNG capacity additions—about 300 billion cubic metres (bcm) per year of LNG export capacity is set to be added by 2030—which implies sustained requirements for cryogenic tanks, loading arms, pumps, and regasification trains across ports and terminals.
A second, very practical driver is food preservation and cold-chain performance—where “better cold” directly reduces waste and protects nutrition. FAO’s SDG indicator work estimates global food loss at 13.3% in 2023. Separately, SEforALL highlights that lack of sustainable cold chains is associated with 526 million tons of food production loss each year—an indicator of how much value can be protected when freezing and refrigerated logistics are upgraded.
- In parallel, the International Institute of Refrigeration (IIR) notes that 12% of global food production is lost due to insufficient cold chains, and that expanding cold-chain infrastructure could save 475 million tonnes of food annually—enough to feed 950 million people. The International Gas Union reports global LNG trade grew to 411.24 million tonnes in 2024, linking 22 exporting markets with 48 importing markets—activity that sustains investment in cryogenic terminals and midstream equipment.
Industrial gas demand also remains foundational: large cryogenic air separation units (ASUs) supply oxygen and nitrogen for steel, chemicals, refining, water treatment, and healthcare, while process optimization increasingly targets energy efficiency because cryogenic oxygen production can exceed 200 kWh of electricity per ton of oxygen.
Key Takeaways
- Cryogenic Equipment Market size is expected to be worth around USD 55.7 Billion by 2034, from USD 24.2 Billion in 2024, growing at a CAGR of 8.7%.
- Tank held a dominant market position, capturing more than a 35.8% share.
- Nitrogen held a dominant market position, capturing more than a 37.9% share.
- Storage held a dominant market position, capturing more than a 67.3% share.
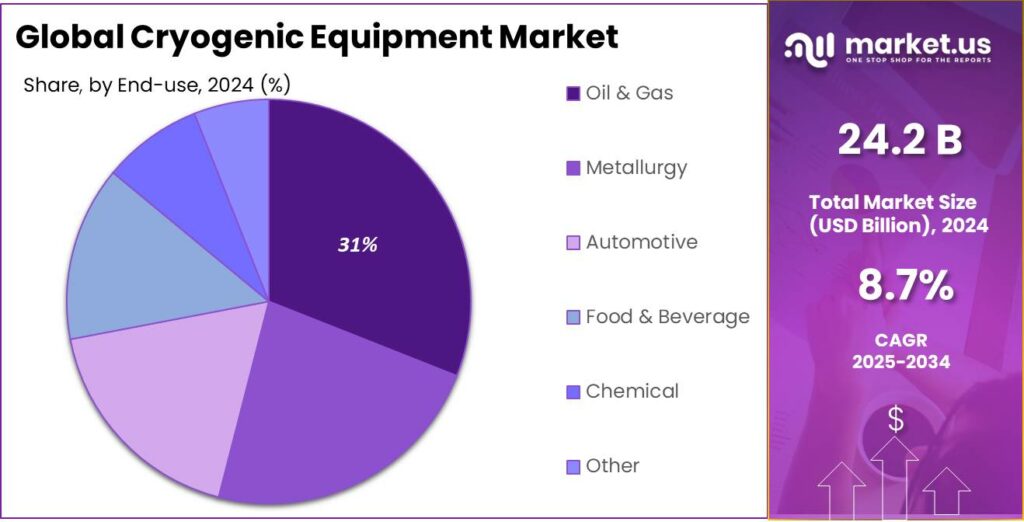
- Oil & Gas held a dominant market position, capturing more than a 31.6% share.
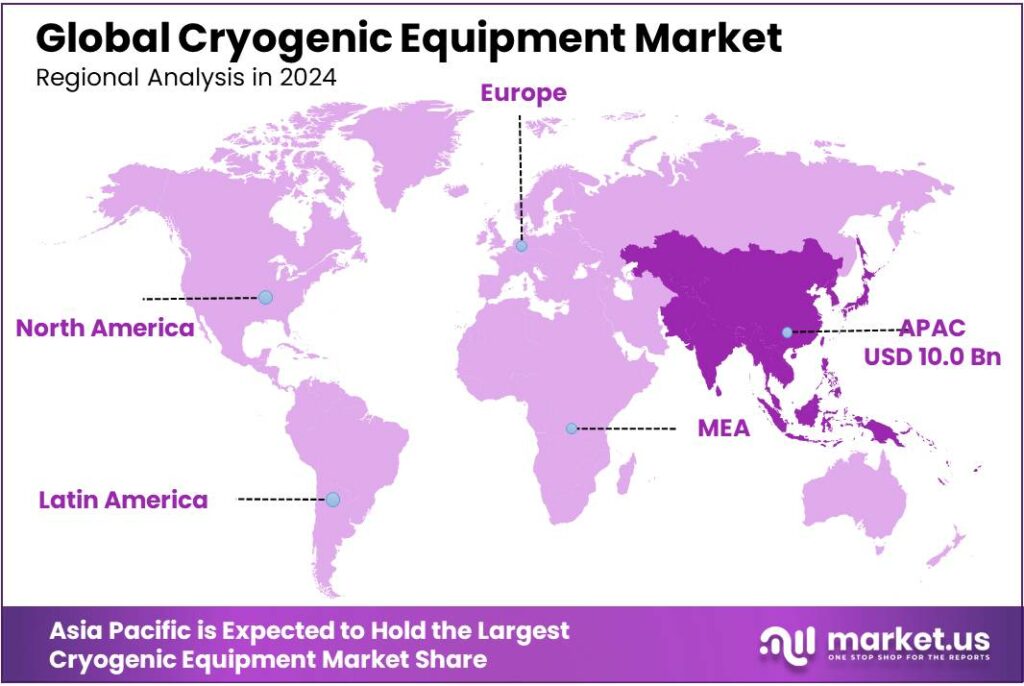
- Asia Pacific stood out as the dominating region in the global cryogenic equipment market in 2024, capturing 41.70% of the total market and reaching an estimated value of USD 10 Billion.
By Product Analysis
Tank dominates with 35.8% due to its critical role in safe storage of liquefied gases
In 2024, Tank held a dominant market position, capturing more than a 35.8% share, supported by its essential function in the storage and transportation of cryogenic liquids such as nitrogen, oxygen, LNG, and hydrogen. The demand for cryogenic tanks was driven by steady expansion in industrial gas production, healthcare infrastructure, and energy-related applications, where safe temperature control is mandatory. Tanks were widely adopted across on-site and bulk storage needs because they offer long holding times, low evaporation loss, and reliable insulation performance.
In 2024, investments were directed toward large-capacity and vacuum-insulated tanks to support higher consumption volumes and operational efficiency. Moving into 2025, growth was sustained by increasing LNG usage, rising hydrogen projects, and continuous upgrades in medical gas storage systems. The segment benefited from long replacement cycles and mandatory safety compliance, which supported consistent demand across developed and emerging regions. The strong preference for tanks reflects their non-substitutable role within cryogenic systems, making them a stable and revenue-generating product category within the overall market.
By Cryogen Analysis
Nitrogen dominates with 37.9% driven by its wide industrial and medical usage
In 2024, Nitrogen held a dominant market position, capturing more than a 37.9% share, mainly due to its extensive use across manufacturing, healthcare, food processing, and electronics industries. Nitrogen is widely preferred in cryogenic equipment because it is inert, cost-efficient, and easy to handle compared to other cryogens. In 2024, strong demand was observed from metal fabrication, chemical processing, and pharmaceutical storage, where controlled low-temperature environments are essential for safety and product quality.
Hospitals and laboratories continued to rely on liquid nitrogen for preservation, cryosurgery, and diagnostic applications, supporting steady equipment demand. Entering 2025, growth remained stable as nitrogen consumption increased in food freezing, semiconductor manufacturing, and packaging applications. The segment benefited from high-volume usage and frequent refill cycles, which supported consistent equipment utilization. Its broad application base and stable supply chain kept nitrogen as the most commonly used cryogen, reinforcing its leading position within the cryogenic equipment market.
By Application Analysis
Storage dominates with 67.3% as safe containment remains the core need across cryogenic uses
In 2024, Storage held a dominant market position, capturing more than a 67.3% share, as the safe holding of liquefied gases remained the most critical requirement across all cryogenic applications. Cryogenic storage systems were widely used to maintain extremely low temperatures for gases such as nitrogen, oxygen, and LNG across industrial, medical, and energy sectors. In 2024, higher consumption of industrial gases and the expansion of healthcare facilities increased the need for reliable on-site and bulk storage solutions.
Storage equipment was preferred due to its ability to minimize evaporation losses, ensure long-duration containment, and meet strict safety standards. Moving into 2025, demand stayed strong as LNG infrastructure projects and hydrogen-related storage needs continued to expand. The segment also benefited from regular capacity expansion and replacement demand, as storage systems are long-term assets but require periodic upgrades for efficiency and compliance. This strong reliance on storage applications kept the segment firmly in the leading position within the cryogenic equipment market.
By End-use Analysis
Oil & Gas dominates with 31.6% supported by rising LNG and gas processing activities
In 2024, Oil & Gas held a dominant market position, capturing more than a 31.6% share, driven by the extensive use of cryogenic equipment in liquefied natural gas processing, storage, and transportation. The sector relies heavily on cryogenic systems to cool, liquefy, and store natural gas at extremely low temperatures, making this equipment essential across upstream and midstream operations. In 2024, increased LNG trade and capacity expansion at terminals supported steady demand for cryogenic tanks, vaporizers, and related systems.
The use of cryogenic technology also expanded in gas separation and purification processes, improving efficiency and safety. Moving into 2025, demand remained stable as new LNG infrastructure projects and gas-based energy investments continued, especially in regions focusing on cleaner fuel transitions. The long operational life and safety-critical nature of cryogenic equipment ensured consistent procurement and replacement activity, reinforcing the Oil & Gas sector’s leading role within the overall market.
Key Market Segments
By Product
- Tank
- Valve
- Pumps
- Vaporizers
- Vacuum Jacketed Piping (VJP)
- Others
By Cryogen
- Nitrogen
- Oxygen
- Argon
- Liquified Natural Gas
- Hydrogen
- Others
By Application
- Distribution
- Storage
By End-use
- Oil & Gas
- Metallurgy
- Automotive
- Food & Beverage
- Chemical
- Other
Emerging Trends
Rise of Sustainable Cold Chains and Energy-Efficient Cryogenics
Food waste is the starting point for many of these decisions. The UN Food and Agriculture Organization (FAO) estimates that roughly 1.3 billion tonnes of food produced for human consumption is lost or wasted every year—about one-third of all food. That is not just a number; it represents farmers, truck drivers, small processors, and families losing value before food ever reaches a plate.
The International Institute of Refrigeration (IIR) has also emphasized how refrigeration systems contribute to energy use. Their reports indicate that refrigeration (not counting heat pumps) accounts for about 20% of global electricity consumption and is linked to roughly 10% of energy-related carbon emissions. In the food sector, this has fueled interest in cryogenic technologies that work harder with less power. Companies are now comparing nitrogen-based flash freezing, vacuum cryogenic loops, and hybrid systems against traditional mechanical compressors—not just on freezing speed, but on energy per kilogram of product frozen.
Policy incentives and government programs are reinforcing this trend. For example, many countries are tying cold-chain funding to sustainability criteria. In India, cold-chain development under schemes like the Pradhan Mantri Kisan SAMPADA Yojana (PMKSY) has not only expanded capacity but also encouraged energy-efficient and quality-preserving technology. As of 30.06.2025, PMKSY had approved 1,601 projects with 1,133 completed, supporting cold storage and processing capacity of 255.66 lakh metric tonnes per year.
Drivers
Food cold-chain expansion to cut waste drives demand
One major driving factor for cryogenic equipment is the global push to reduce food loss by strengthening cold-chain and rapid-freezing capacity. Food companies and public agencies increasingly treat temperature control as a “first-mile” and “last-mile” infrastructure problem, because spoilage starts the moment fresh produce, meat, or dairy leaves the farm or processing line. The FAO has long highlighted the scale of the issue—roughly one-third of food produced for human consumption is lost or wasted, about 1.3 billion tonnes each year—making waste reduction one of the fastest ways to improve food availability without expanding farmland.
Trusted refrigeration bodies also quantify how much cold-chain gaps cost the world. The International Institute of Refrigeration (IIR) reports that 12% of global food production is lost due to insufficient cold chains, and that expanding food cold-chain infrastructure could save 475 million tonnes of food annually—enough to feed 950 million people. Those numbers are a direct demand signal for equipment makers: when governments and large food processors budget for cold rooms, reefer transport, and freezing lines, cryogenic tanks, vaporizers, vacuum-insulated piping, and dosing systems become part of the standard buildout.
- Policy support strengthens this driver because many countries are funding food processing and preservation to cut post-harvest losses and stabilize farmer incomes. In India, the Ministry of Food Processing Industries (MoFPI) has published progress under the Pradhan Mantri Kisan SAMPADA Yojana (PMKSY): as of 30.06.2025, 1,601 projects were approved and 1,133 were completed/operationalized, supported by total approved grants of ₹5,365.32 crore, creating preservation and processing capacity of 255.66 LMT/year.
Restraints
High energy and operating costs limit adoption
Energy intensity shows up at multiple points in the chain. At a system level, the International Institute of Refrigeration (IIR) highlights that electricity consumption attributable to the refrigeration sector (excluding heat pumps) is around 20% of global electricity use, and the associated emissions are about 10% of global energy-related emissions.
For food companies, that translates into real pressure to justify any solution that increases energy demand, especially in regions where electricity prices are volatile or supply is unreliable. Even in a conventional cold store, research frequently finds a large share of facility electricity goes into cooling; one widely cited analysis notes that within cold storage facilities, roughly 60–70% of electrical energy may be used for refrigeration.
- The cryogen itself also carries an embedded energy cost. For example, one life-sciences industry assessment cites an energy intensity for liquid nitrogen production of 0.549 kWh/kg. A peer-reviewed energy assessment notes oxygen production via cryogenic air separation is associated with high specific energy consumption, commonly around ~200–300 kWh per ton of O₂ in the context discussed.
Safety compliance adds another “hidden” operating cost. Liquid nitrogen expands dramatically when it vaporizes, which can create oxygen-deficient atmospheres if ventilation and detection are not designed properly. University EHS guidance notes that oxygen deficiency risk increases when oxygen drops below 19.5%, which is a commonly used safety threshold in standards and guidance.
Opportunity
Cold-chain buildout creates a clear runway
The size of the prize is visible in trusted, non-commercial data. The International Institute of Refrigeration (IIR) estimates that 12% of global food production is lost due to insufficient cold chains, and that expanding cold-chain infrastructure could save 475 million tonnes of food each year—enough to feed 950 million people. For equipment suppliers, these numbers translate into a practical business case: processors and governments do not need perfect market forecasts to act; they can see the waste, the rejected loads, and the lost income.
- In India, official updates around the Pradhan Mantri Kisan SAMPADA Yojana (PMKSY) show scale that matters for equipment demand. As of 30.06.2025, 1,601 projects were approved and 1,133 were completed/operationalized, benefiting 3,415,102 farmers. Related government documentation also reports total approved grants of ₹5,365.32 crore, creating preservation and processing capacity of 255.66 LMT/annum, and notes that 395 cold-chain projects were approved under the integrated cold-chain and value addition scheme.
For example, industry reporting on USDA-linked cooperative efforts highlights cold-storage-related grant activity such as $6.3 million in supply chain grants in Virginia under the Resilient Food Systems Infrastructure approach. Other state guidance tied to the same USDA framework describes award sizing, with a defined funding range of $100,000 to $3,000,000 per application (program-dependent), helping smaller operators move forward with infrastructure that may have been out of reach.
Regional Insights
Asia Pacific Leads with 41.70% Share and USD 10 Billion Market Value
Asia Pacific stood out as the dominating region in the global cryogenic equipment market in 2024, capturing 41.70% of the total market and reaching an estimated value of USD 10 billion. This strong regional position was supported by rapid industrial growth, expanded LNG infrastructure, and rising demand for industrial gases across major economies including China, India, Japan, and South Korea.
The industrial sector in Asia Pacific continued to drive demand for cryogenic equipment such as storage tanks, vaporizers, and process systems, which are essential for applications in petrochemicals, metal fabrication, and chemicals. Healthcare and laboratory demand also increased in 2024, with hospitals and research facilities expanding their use of cryogenic storage for medical gases and biological materials.
Key Regions and Countries Insights
- North America
- US
- Canada
- Europe
- Germany
- France
- The UK
- Spain
- Italy
- Rest of Europe
- Asia Pacific
- China
- Japan
- South Korea
- India
- Australia
- Rest of APAC
- Latin America
- Brazil
- Mexico
- Rest of Latin America
- Middle East & Africa
- GCC
- South Africa
- Rest of MEA
Key Players Analysis
Linde plc is a multinational industrial gases and engineering company commanding one of the largest shares in the cryogenic equipment market, with about 18–23% market share in related equipment segments. Its portfolio includes cryogenic storage tanks, vaporizers, and distribution systems that serve energy, healthcare, manufacturing and industrial applications worldwide.
INOX India Limited is a major cryogenic equipment supplier in India, with revenue exceeding INR 1,300 crore in FY25 and a strong export footprint. The company leads the domestic market, particularly in LNG tanks and cryogenic storage solutions, and has executed large turnkey facilities supporting industrial and energy sectors.
Chart Industries Inc. is a leading global manufacturer of cryogenic storage, tanks, vaporizers, and process equipment. The company’s product range supports LNG, industrial gases, and hydrogen applications, with strategic collaborations to expand hydrogen technology solutions and LNG infrastructure globally. Chart continues to invest in larger fabrication facilities to meet rising demand across energy and industrial sectors.
Top Key Players Outlook
- Chart Industries Inc.
- Linde plc
- Nikkiso Co. Ltd.
- Standex International
- INOX India Limited
- Air Liquide SA
- Premier Cryogenics Ltd.
- Galileo Technologies S.A.
- Herose GmbH
- Wessington Cryogenics
Recent Industry Developments
In 2024, Chart Industries Inc. maintained its position as a key global supplier of cryogenic equipment, reporting full-year 2024 sales of approximately $4,160.3 million with a strong product mix in cryogenic tanks, heat transfer systems, specialty products, and repair and service segments.
In 2024, Linde plc continued to strengthen its position in the cryogenic equipment and industrial gases sector with total sales of USD 33,005 million, reflecting stable revenue while serving a broad range of industries including energy, healthcare, manufacturing, and electronics through its cryogenic air separation, storage, and processing solutions
Report Scope
Report Features Description Market Value (2024) USD 24.2 Bn Forecast Revenue (2034) USD 55.7 Bn CAGR (2025-2034) 8.7% Base Year for Estimation 2024 Historic Period 2020-2023 Forecast Period 2025-2034 Report Coverage Revenue Forecast, Market Dynamics, Competitive Landscape, Recent Developments Segments Covered By Product (Tank, Valve, Pumps, Vaporizers, Vacuum Jacketed Piping (VJP), Others), By Cryogen (Nitrogen, Oxygen, Argon, Liquified Natural Gas, Hydrogen, Others), By Application (Distribution, Storage), By End-use (Oil And Gas, Metallurgy, Automotive, Food And Beverage, Chemical, Other) Regional Analysis North America – US, Canada; Europe – Germany, France, The UK, Spain, Italy, Rest of Europe; Asia Pacific – China, Japan, South Korea, India, Australia, Singapore, Rest of APAC; Latin America – Brazil, Mexico, Rest of Latin America; Middle East & Africa – GCC, South Africa, Rest of MEA Competitive Landscape Chart Industries Inc., Linde plc, Nikkiso Co. Ltd., Standex International, INOX India Limited, Air Liquide SA, Premier Cryogenics Ltd., Galileo Technologies S.A., Herose GmbH, Wessington Cryogenics Customization Scope Customization for segments, region/country-level will be provided. Moreover, additional customization can be done based on the requirements. Purchase Options We have three licenses to opt for: Single User License, Multi-User License (Up to 5 Users), Corporate Use License (Unlimited User and Printable PDF) 
-
-
- Chart Industries Inc.
- Linde plc
- Nikkiso Co. Ltd.
- Standex International
- INOX India Limited
- Air Liquide SA
- Premier Cryogenics Ltd.
- Galileo Technologies S.A.
- Herose GmbH
- Wessington Cryogenics
Our Clients
- 172754
- Jan 2026


